Previous NG thread:
https://www.marketforum.com/forum/topic/93288/
Current/recent weather threads:
https://www.marketforum.com/forum/topic/93742/
Temps from last week for this weeks EIA report.
Bearish/warm again in the eastern 60%, cold in the West.
So a seasonally bearish/small withdrawal.
Look at the unusually large drawdowns from last year that we've been comparing too and gaining a massive supply surplus vs 2022 and the 5 year average.
https://www.marketforum.com/forum/topic/92520/#92588
| Release Date | Time | Actual | Forecast | Previous |
|---|
| Apr 28, 2022 | 09:30 | 40B | 38B | 53B | |
| Apr 21, 2022 | 09:30 | 53B | 37B | 15B | |
| Apr 14, 2022 | 09:30 | 15B | 15B | -33B | |
| Apr 07, 2022 | 09:30 | -33B | -26B | 26B | |
| Mar 31, 2022 | 09:30 | 26B | 21B | -51B | |
| Mar 24, 2022 | 09:30 | -51B | -56B | -79B | |
| Mar 17, 2022 | 09:30 | -79B | -73B | -124B | |
| Mar 10, 2022 | 10:30 | -124B | -117B | -139B | |
| Mar 03, 2022 | 10:30 | -139B | -138B | -129B | |
| Feb 24, 2022 | 10:30 | -129B | -134B | -190B | |
| Feb 17, 2022 | 10:30 | -190B | -193B | -222B | |
| Feb 10, 2022 | 10:30 | -222B | -222B | -268B | |
| Feb 03, 2022 | 10:30 | -268B | -216B | -219B | |
| Jan 27, 2022 | 10:30 | -219B | -216B | -206B | |
| Jan 20, 2022 | 10:30 | -206B | -194B | -179B | |
| Jan 13, 2022 | 10:30 | -179B | -173B | -31B | |
| Jan 06, 2022 | 10:30 | -31B | -54B | -136B |
+++++++++++
![]()
for week ending March 3, 2023 | Released: March 9, 2023 at 10:30 a.m. | Next Release: March 16, 2023
| Working gas in underground storage, Lower 48 states Summary text CSV JSN | |||||||||||||||||||||||||
|---|---|---|---|---|---|---|---|---|---|---|---|---|---|---|---|---|---|---|---|---|---|---|---|---|---|
| Historical Comparisons | |||||||||||||||||||||||||
| Stocks billion cubic feet (Bcf) | Year ago (03/03/22) | 5-year average (2018-22) | |||||||||||||||||||||||
| Region | 03/03/23 | 02/24/23 | net change | implied flow | Bcf | % change | Bcf | % change | |||||||||||||||||
| East | 416 | 451 | -35 | -35 | 323 | 28.8 | 354 | 17.5 | |||||||||||||||||
| Midwest | 515 | 544 | -29 | -29 | 370 | 39.2 | 411 | 25.3 | |||||||||||||||||
| Mountain | 92 | 99 | -7 | -7 | 93 | -1.1 | 95 | -3.2 | |||||||||||||||||
| Pacific | 81 | 99 | -18 | -18 | 162 | -50.0 | 170 | -52.4 | |||||||||||||||||
| South Central | 925 | 922 | 3 | 3 | 587 | 57.6 | 640 | 44.5 | |||||||||||||||||
| Salt | 261 | 261 | 0 | 0 | 153 | 70.6 | 182 | 43.4 | |||||||||||||||||
| Nonsalt | 664 | 661 | 3 | 3 | 435 | 52.6 | 458 | 45.0 | |||||||||||||||||
| Total | 2,030 | 2,114 | -84 | -84 | 1,537 | 32.1 | 1,671 | 21.5 | |||||||||||||||||
Totals may not equal sum of components because of independent rounding. | |||||||||||||||||||||||||
Working gas in storage was 2,030 Bcf as of Friday, March 3, 2023, according to EIA estimates. This represents a net decrease of 84 Bcf from the previous week. Stocks were 493 Bcf higher than last year at this time and 359 Bcf above the five-year average of 1,671 Bcf. At 2,030 Bcf, total working gas is within the five-year historical range.
For information on sampling error in this report, see Estimated Measures of Sampling Variability table below.
Look at the blue line below!!

Note: The shaded area indicates the range between the historical minimum and maximum values for the weekly series from 2018 through 2022. The dashed vertical lines indicate current and year-ago weekly periods.
Natural gas futures faltered on Wednesday, a second-consecutive loss, as analysts anticipated another soft government inventory print and traders started to look past a late-winter surge of cold and toward likely benign spring weather. At A Glance: Analysts see modest storage draw Forecasts call for near-term cold Mixed reads on gas production The April Nymex…
+++++++++++++++
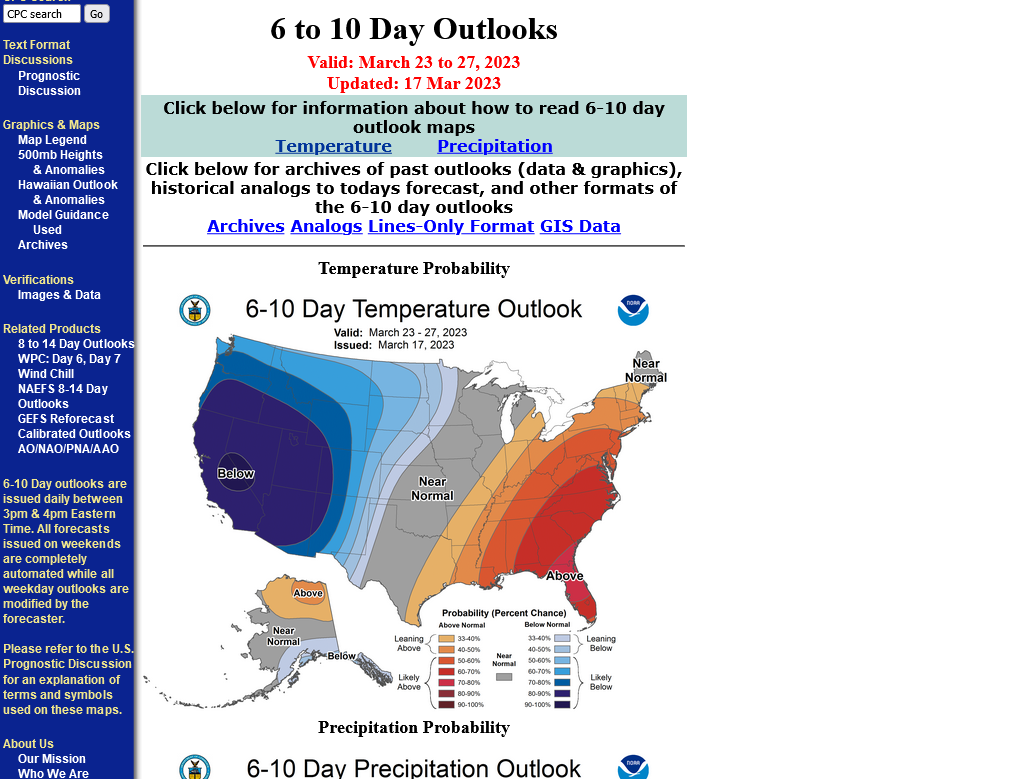
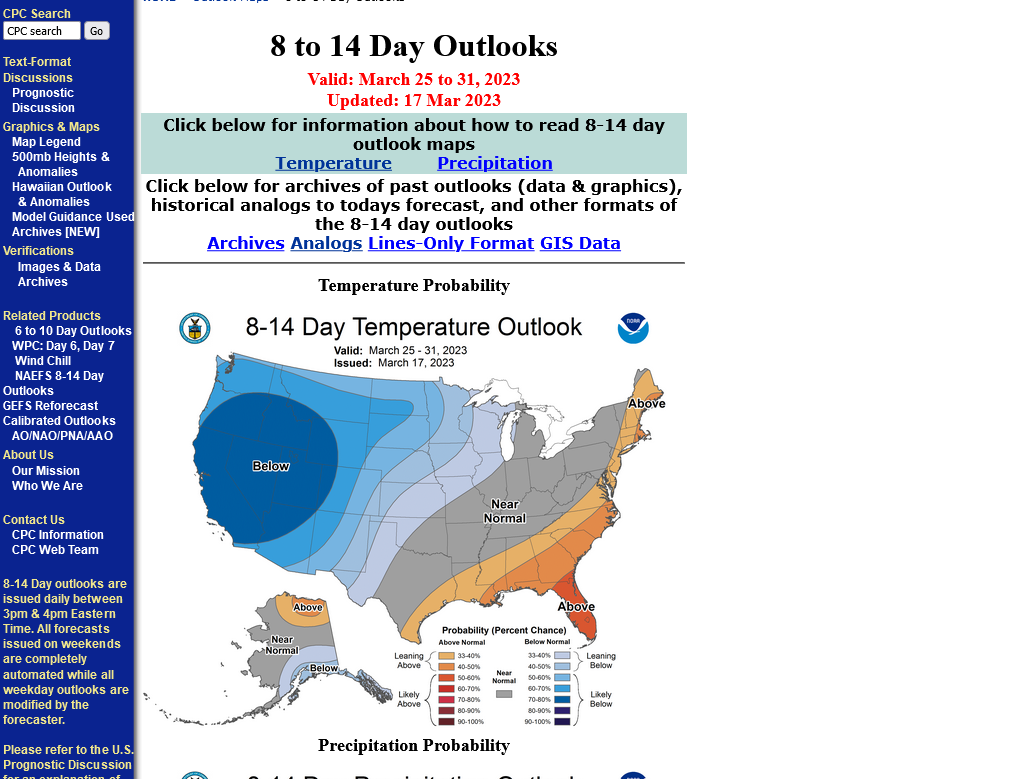
Yep! Temps the last week of March just slightly below average, most of it in the West again with the current chill moderating quickly next week.
https://www.cpc.ncep.noaa.gov/products/predictions/814day/index.php

All the weather:
![]()
for week ending March 10, 2023 | Released: March 16, 2023 at 10:30 a.m. | Next Release: March 23, 2023
Bearish but expected!
Look at the blue line on the graph below!
| Working gas in underground storage, Lower 48 states Summary text CSV JSN | |||||||||||||||||||||||||
|---|---|---|---|---|---|---|---|---|---|---|---|---|---|---|---|---|---|---|---|---|---|---|---|---|---|
| Historical Comparisons | |||||||||||||||||||||||||
| Stocks billion cubic feet (Bcf) | Year ago (03/10/22) | 5-year average (2018-22) | |||||||||||||||||||||||
| Region | 03/10/23 | 03/03/23 | net change | implied flow | Bcf | % change | Bcf | % change | |||||||||||||||||
| East | 391 | 416 | -25 | -25 | 294 | 33.0 | 322 | 21.4 | |||||||||||||||||
| Midwest | 490 | 515 | -25 | -25 | 341 | 43.7 | 383 | 27.9 | |||||||||||||||||
| Mountain | 87 | 92 | -5 | -5 | 88 | -1.1 | 91 | -4.4 | |||||||||||||||||
| Pacific | 72 | 81 | -9 | -9 | 156 | -53.8 | 165 | -56.4 | |||||||||||||||||
| South Central | 933 | 925 | 8 | 8 | 573 | 62.8 | 632 | 47.6 | |||||||||||||||||
| Salt | 266 | 261 | 5 | 5 | 158 | 68.4 | 181 | 47.0 | |||||||||||||||||
| Nonsalt | 667 | 664 | 3 | 3 | 415 | 60.7 | 451 | 47.9 | |||||||||||||||||
| Total | 1,972 | 2,030 | -58 | -58 | 1,451 | 35.9 | 1,594 | 23.7 | |||||||||||||||||
Totals may not equal sum of components because of independent rounding. | |||||||||||||||||||||||||
Working gas in storage was 1,972 Bcf as of Friday, March 10, 2023, according to EIA estimates. This represents a net decrease of 58 Bcf from the previous week. Stocks were 521 Bcf higher than last year at this time and 378 Bcf above the five-year average of 1,594 Bcf. At 1,972 Bcf, total working gas is within the five-year historical range.
For information on sampling error in this report, see Estimated Measures of Sampling Variability table below.
Note: The shaded area indicates the range between the historical minimum and maximum values for the weekly series from 2018 through 2022. The dashed vertical lines indicate current and year-ago weekly periods.
++++++++++++++++
European model was -8 HDDs bearish overnight but it's now the 2nd half of March. HDDs can't make much difference anymore to the main demand/supply dynamic that determines market direction. It's too late in the season. Traders might pay attention still for psychological reasons(which will affect short term, speculative pricing) but its not going to make a substantive difference when there isn't enough potential HDDs left to accomplish that.
Natural gas futures floundered Friday, capping a see-saw week of trading that ultimately left prompt prices in a holding pattern of sorts, with traders trying to assess an uncertain weather outlook, choppy production estimates and stubbornly high storage levels. At A Glance: Stout storage endures Weather outlook evolves Freeport remains key factor The April Nymex…
++++++++++++++++++++++++++
Snap shot of 6-10/8-14 day outlooks. Very cold outlooks for the month of March from late last month, have instead, turned into just a few transient shots of seasonably cold.
https://www.cpc.ncep.noaa.gov/products/predictions/610day/
++++++++++++
Temps thru yesterday for next Thursday EIA report below. More bullish than recent reports(mostly bearish reports) compared to seasonal averages for that week but not enough to make any difference at all in the storage dynamic.
https://www.cpc.ncep.noaa.gov/products/tanal/temp_analyses.php
The month of March has been above average everywhere in the eastern half of the country and MUCH above average along the Gulf Coast, especially in S.TX.:
++++++++++++++
Weather doesn't matter much this late in the heating season. Supplies continue to gush in which are fighting against an extremely positive seasonal here. We're getting close to the April contract lows from last month. I think that was 2.113 for NGJ3.
April contract only below. We're almost down to the Low for this contract set in Feb/almost a month ago!

The March contract low from a continuation chart is shown below:
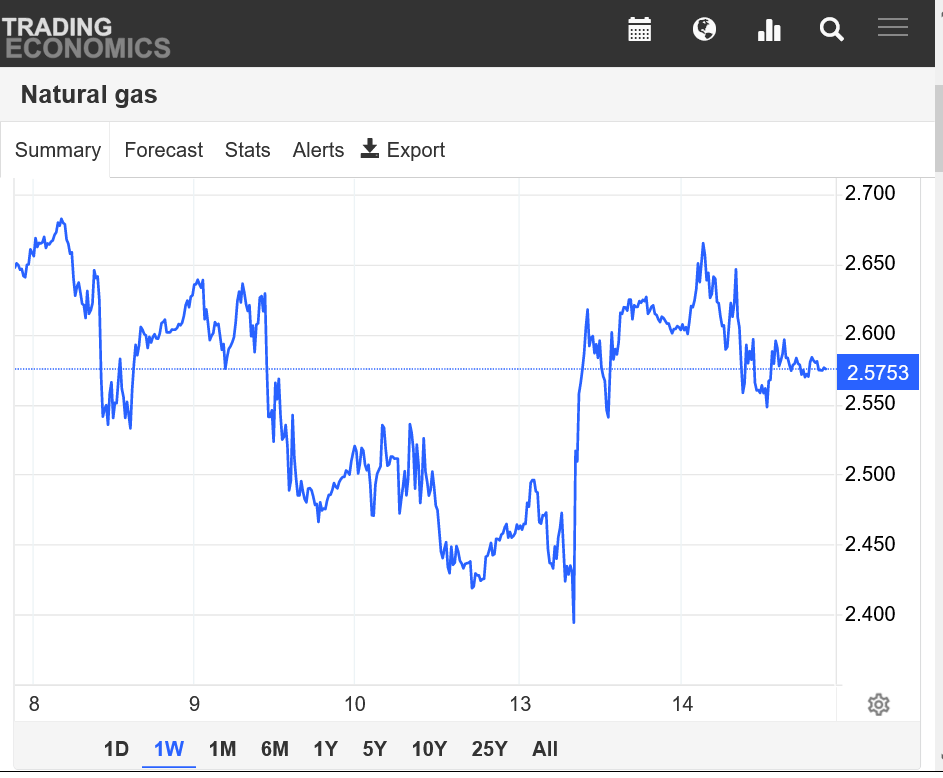
https://tradingeconomics.com/commodity/natural-gas
IMPRESSIVE reversal for ngk.
Made a new contract low at 2.24, then reversed. As MetMike stated, tested, but did not break, continous (lead) low near 2.11. Fundamentals based upon production are terrible. Seasonals suggest a 3-4 week rally.
(Long and will not let it make new low)
Thanks tjc!
Right after I said that weather didn't matter much, the GEFS came out a whopping +20 HDDs vs the previous run.
I don't think that I've seen that much change IN JUST 6 HOURS in the Winter!
Like you stated, this would look like a nice double bottom on the price charts.
The EE came out just +3 HDDs.
Natural gas futures rebounded Tuesday, avoiding a third consecutive loss amid modestly lighter production and expectations for more late season heating demand. The April Nymex gas futures contract gained 12.5 cents day/day and settled at $2.348/MMBtu. May futures advanced 15.4 cents to $2.485. NGI’s Spot Gas National Avg. went the opposite direction, falling 16.0 cents…
++++++++++++++++
I really didn't think that we would drop this low again the rest of the year after the spike low in Feb. and recovery to near $3.
Must be the bearish fundamentals with NG supplies gushing in at a record pace since late last Summer. Biggest gain in storage for that period in history.
Mike said:
"Right after I said that weather didn't matter much, the GEFS came out a whopping +20 HDDs vs the previous run."
-------------
When comparing 12Z to prior runs, one can clearly see why there was a 20 HDD gain. Typically after a drastic change in HDDs in a certain direction, the subsequent run gives back at least some of that change. It looks like the 18Z did based on the maps not being as cold as 12Z. However, the 18Z is still significantly colder than 6Z/0Z. So, my wild guess is that the 18Z gave back 5-7 of the 20. If you get a chance, please post how 18Z GEFS turned out. Thank you in advance.
Excellent point, Larry!
I was expecting that and getting ready to post about it but you beat me to it.
That last 12z GEFS solution was so extreme that the -9 HDDs on the last 18z solution right after it was very expected as you stated.
We were knocked offline overnight.
EE was -8 HDDs overnight. Yesterday's outlier cold 12z GEFS run looks like a fluke.
Another -8HDDs from the last 12z GEFS, confirming that the extreme one 24 hours ago was just an outlier.
Natural gas futures on Wednesday lost ground for the third time in four sessions, succumbing to spring weather expectations and stout production levels. The April Nymex gas futures contract settled at $2.171/MMBtu, down 17.7 cents day/day. May fell 17.8 cents to $2.307. At A Glance: Front month sheds 17.7 cents day/day Next-day cash prices under…
++++++++++++
The EIA report tomorrow at 9:30 am may be a bit more bullish than recent reports.
![]()
https://ir.eia.gov/ngs/ngs.html
for week ending March 17, 2023 | Released: March 23, 2023 at 10:30 a.m. | Next Release: March 30, 2023
-72 BCF Seasonally robust but as expected
| Working gas in underground storage, Lower 48 states Summary text CSV JSN | |||||||||||||||||||||||||
|---|---|---|---|---|---|---|---|---|---|---|---|---|---|---|---|---|---|---|---|---|---|---|---|---|---|
| Historical Comparisons | |||||||||||||||||||||||||
| Stocks billion cubic feet (Bcf) | Year ago (03/17/22) | 5-year average (2018-22) | |||||||||||||||||||||||
| Region | 03/17/23 | 03/10/23 | net change | implied flow | Bcf | % change | Bcf | % change | |||||||||||||||||
| East | 355 | 391 | -36 | -36 | 271 | 31.0 | 299 | 18.7 | |||||||||||||||||
| Midwest | 461 | 490 | -29 | -29 | 321 | 43.6 | 361 | 27.7 | |||||||||||||||||
| Mountain | 84 | 87 | -3 | -3 | 87 | -3.4 | 89 | -5.6 | |||||||||||||||||
| Pacific | 72 | 72 | 0 | 0 | 157 | -54.1 | 163 | -55.8 | |||||||||||||||||
| South Central | 927 | 933 | -6 | -6 | 561 | 65.2 | 637 | 45.5 | |||||||||||||||||
| Salt | 262 | 266 | -4 | -4 | 156 | 67.9 | 187 | 40.1 | |||||||||||||||||
| Nonsalt | 664 | 667 | -3 | -3 | 405 | 64.0 | 449 | 47.9 | |||||||||||||||||
| Total | 1,900 | 1,972 | -72 | -72 | 1,396 | 36.1 | 1,549 | 22.7 | |||||||||||||||||
Totals may not equal sum of components because of independent rounding. | |||||||||||||||||||||||||
Working gas in storage was 1,900 Bcf as of Friday, March 17, 2023, according to EIA estimates. This represents a net decrease of 72 Bcf from the previous week. Stocks were 504 Bcf higher than last year at this time and 351 Bcf above the five-year average of 1,549 Bcf. At 1,900 Bcf, total working gas is within the five-year historical range.
For information on sampling error in this report, see Estimated Measures of Sampling Variability table below.
Note: The shaded area indicates the range between the historical minimum and maximum values for the weekly series from 2018 through 2022. The dashed vertical lines indicate current and year-ago weekly periods.
+++++++++++++
Note the blue line above. We went from a deficit vs the prior year of -349 BCF in early September to a surplus of 504 BCF on this report. +853 BCF added to storage compared to the previous year in just over 6 months! It's very hard to comprehend how a thing is even possible without some sort of profound intervention to stimulate natural gas production by a powerful entity.
The U.S. Energy Information Administration (EIA) on Thursday reported a withdrawal of 72 Bcf natural gas from storage for the week ended March 17. The result fell just shy of the median estimates produced by major polls but was bullish relative to recent history, supporting Nymex natural gas futures. Ahead of the 10:30 ET EIA…
++++++++++++++++
I said that weather didn't matter any more earlier this week, then we had the +20 HDD solution come out of nowhere to prove me wrong.
So, lets say: The influence of cold weather in early Spring is almost never a significant factor and isn't right now. HDDs slightly above average below but dropping in week 2 as the increasing sun angle does its thing to warm the Northern Latitudes.
April NG expires next week and volume for May NG has gone to well over double that of NGJ. As front month expiration approaches, wacky things can happen to prices that defy expectations.
NG opened modestly lower and is staying down around -$800/contract.
April NG expires on Wednesday and volatility can increase ahead of expiration of the front month.
Volume of May NG is more than triple the April tonight.
Does the summer cooling season affect NG prices?
Scroll down for more, including price charts!
Absolutely, cutworm!
A lot of NG gets burned to generate electricity that's used for residential cooling, especially in the high population regions of the Midwest, East and South.
We’re at new contract lows for April and May. This is opposing the extremely strong upward seasonal here And pretty usual.
there could be several reasons.
The biggest is the sudden, incredible/historical shift by producers that started gushing out natural gas at the end of last Summer. The market had 6 weekly injections of 100+ last Fall, double the previous record and gained over +850 BCF over the previous year in just 6 months. This can’t go on forever because there won’t be enough room later this year, towards the end of the injection season to store the NG.
I personally speculate that this is tied to the US blowing up Nordstream 2 and this monumental shift in producers and Biden policy, exactly when the Russian pipeline was eliminated to replace that gas for Europe/Germany with US gas.
so instead of running out of space…….we,ll be ramping up exports to Europe To lap up the extra supplies.
We'll have to see if that happens!
The problems with this are that it’s using up US supplies of natural gas. We have between 50-90 years of supply left but it will be increasingly more expensive to extract with time. Producers are going after the easier, less expensive plays first. The quicker we deplete those, the sooner the more expensive ng will be to bring to the market.
it also reduces our energy security if we are Committed to providing X amount to foreign countries. when market dynamics become more bullish, the bigger demand base means price spikes will be higher for US natural gas consumers.
Natural gas futures kicked off the new week on a low note, slumping alongside warmer trends in weather forecasts, lighter LNG demand and continued robust production levels. At A Glance: Front month sheds 12.8 cents Weather outlook adds warmth Production holds at 100 Bcf/d The April Nymex gas futures contract settled at $2.088/MMBtu, down 12.8…
+++++++++++
As mentioned, life of contract lows. I'm surprised the market is so incredibly bearish!
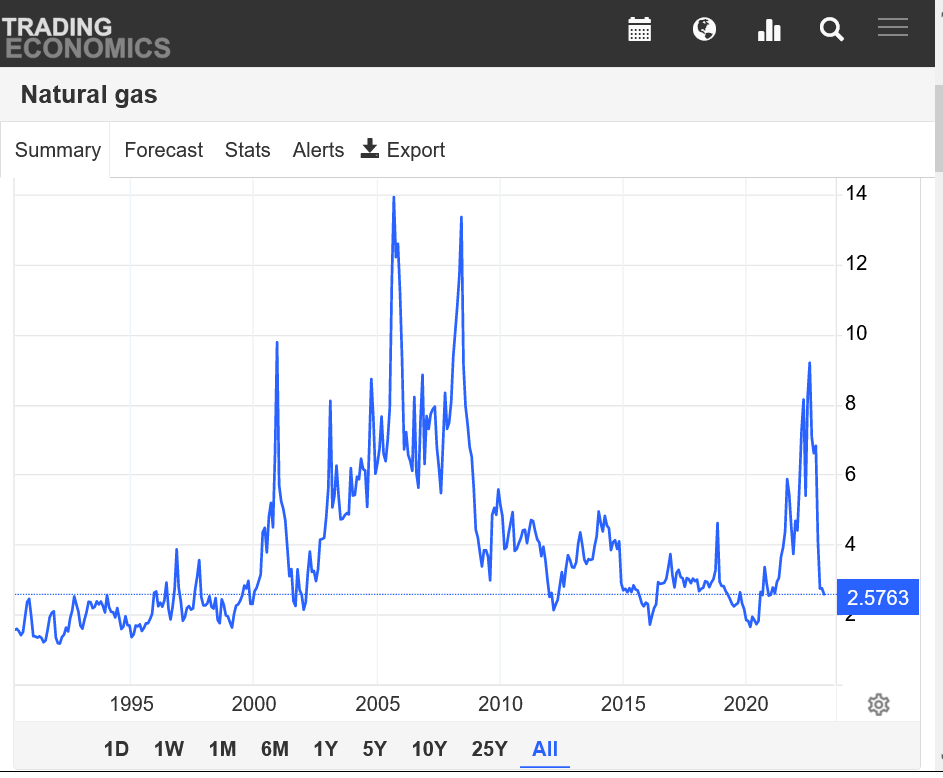
https://tradingeconomics.com/commodity/natural-gas
1. 1 year chart
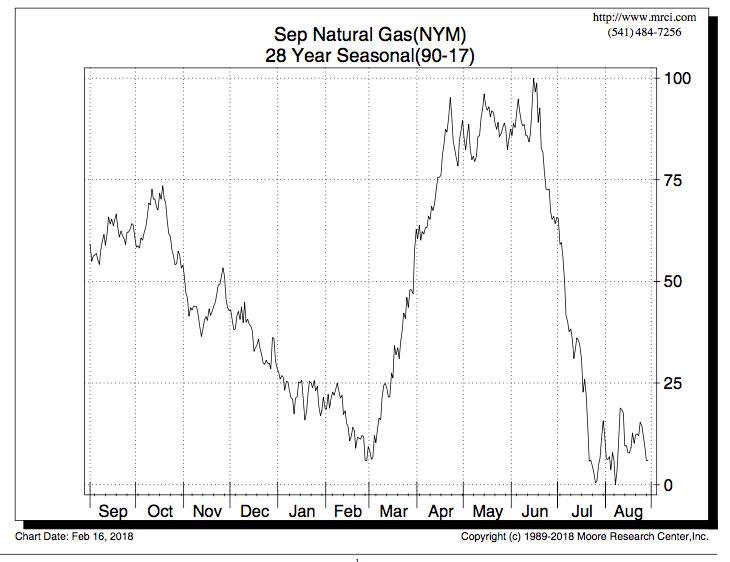
2. 30+ year chart

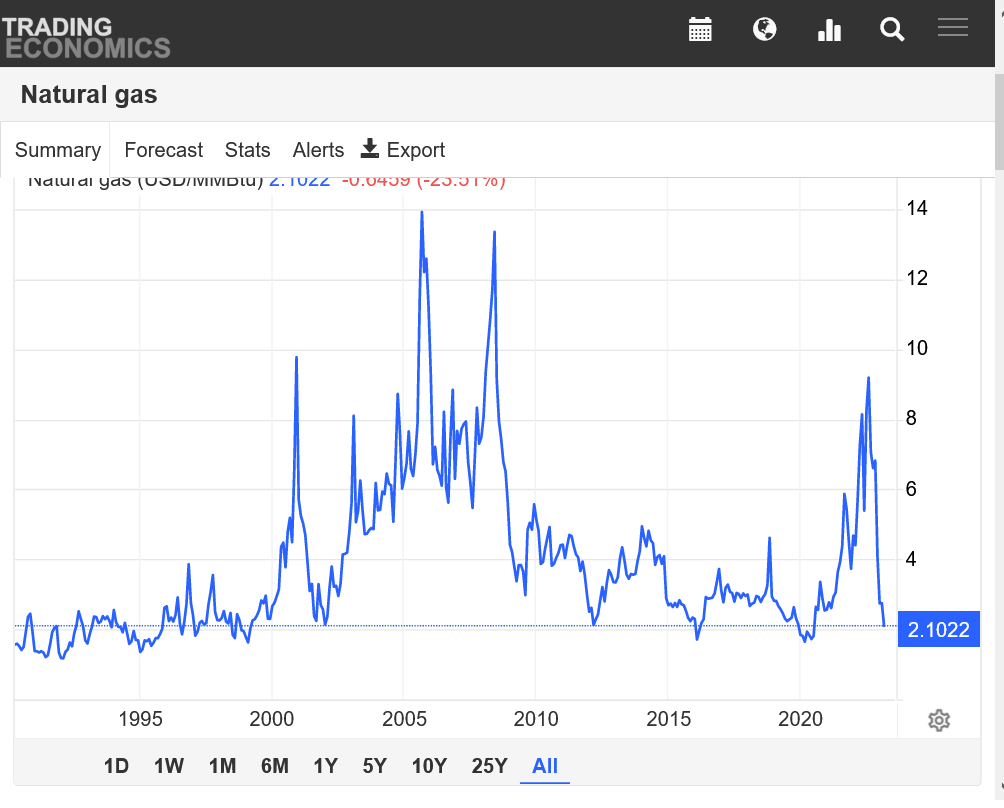
+++++++++++++
Below: Look at what the price of natural gas did historically based on the averages in March. It seems hard to believe that this will continue thru April but supplies are really gushing in at record levels right now.
++++++++++++
The EIA report on Thursday at 9:30 am will use the 7 day period that featured temperatures below. This forebodes a fairly robust drawdown by late March standards, at a time when the injection season is usually right around the corner in most years and no matter how much cold, there's not enough to make a substantive difference in storage. The market can still have very brief, knee jerk reactions to big HDD changes on a particular model run but thats about it.
https://www.cpc.ncep.noaa.gov/products/tanal/temp_analyses.php
++++++++++++
This is the March, month to date temperature map.
The U.S. natural gas market is predicted to be oversupplied this year from a warmer-than-normal start to the year and declining demand, which are likely to suppress prices into 2024. Energy analysts trimming their domestic natural gas price forecasts include BMO Capital Markets, Goldman Sachs Commodity Markets, Jefferies and Tudor, Pickering, Holt & Co. (TPH). …
++++++++++++++++++
Why no mention of producers massively ramped up supplies?......which has been the main price driver. Even when we had the extreme, widespread cold in December, ng prices only had a spike higher for a few days, then continued to collapse lower with another week+ of extreme cold left.
Many people seem to be oblivious. These new contract low weak prices in late March have also been a huge surprise to me. I insisted in late February that the lows were in for a very long time.....meaning more like the rest of the year, not for a month (-:
Front month, April expires tomorrow. That might be playing a role here too. It's also possible that the economy is much weaker than what we here. This always reduces industrial demand of ng.
Weighed down by a healthy storage cushion as the market exits the withdrawal season, natural gas futures continued to grind lower in early trading Wednesday. The expiring April Nymex contract was down 3.9 cents to $1.991/MMBtu at around 8:40 a.m. ET. May was off 2.2 cents to $2.125. Natural gas prices have been “tempting the…
+++++++
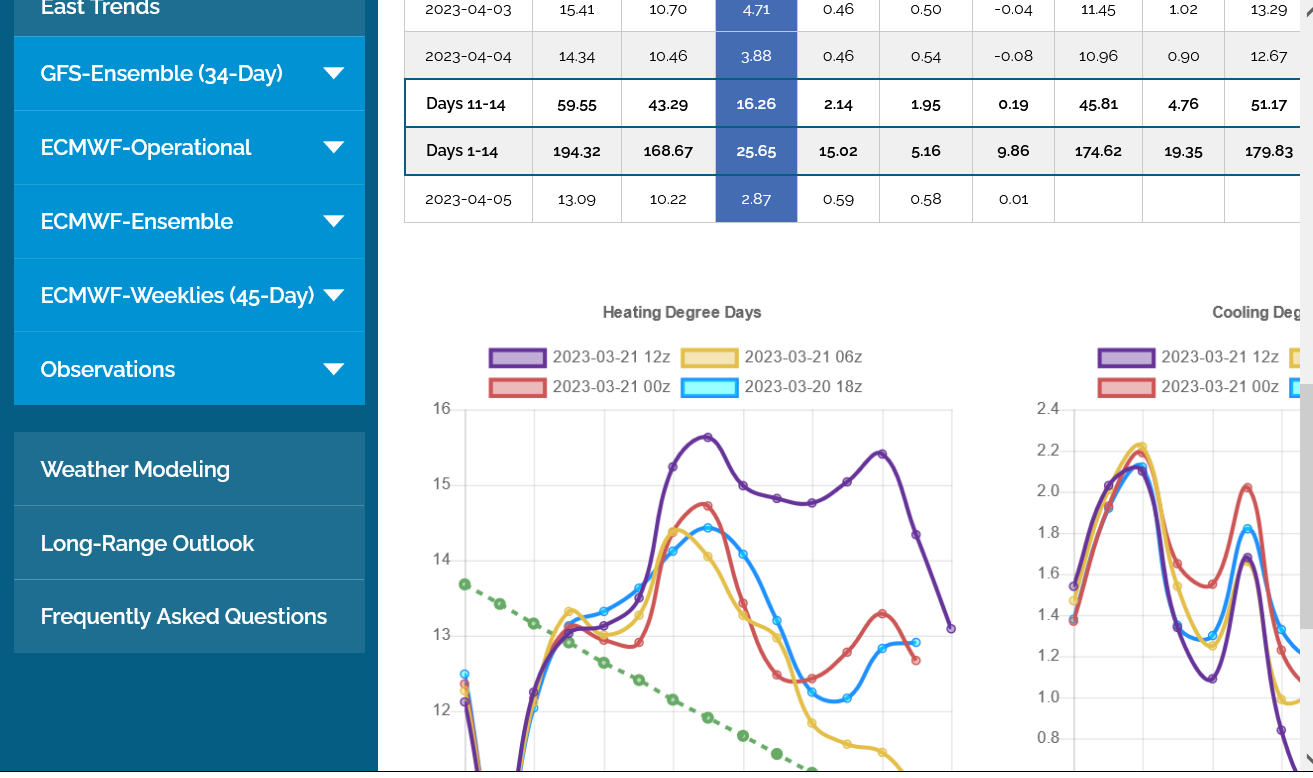
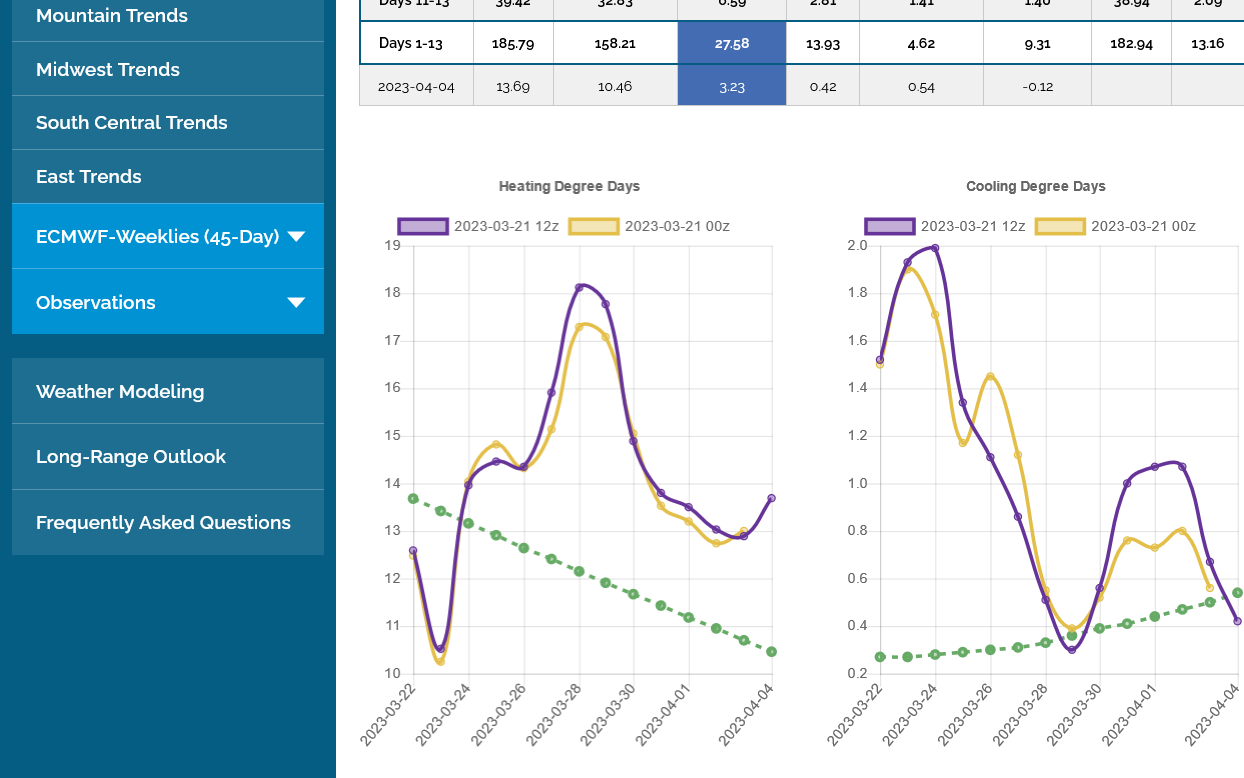
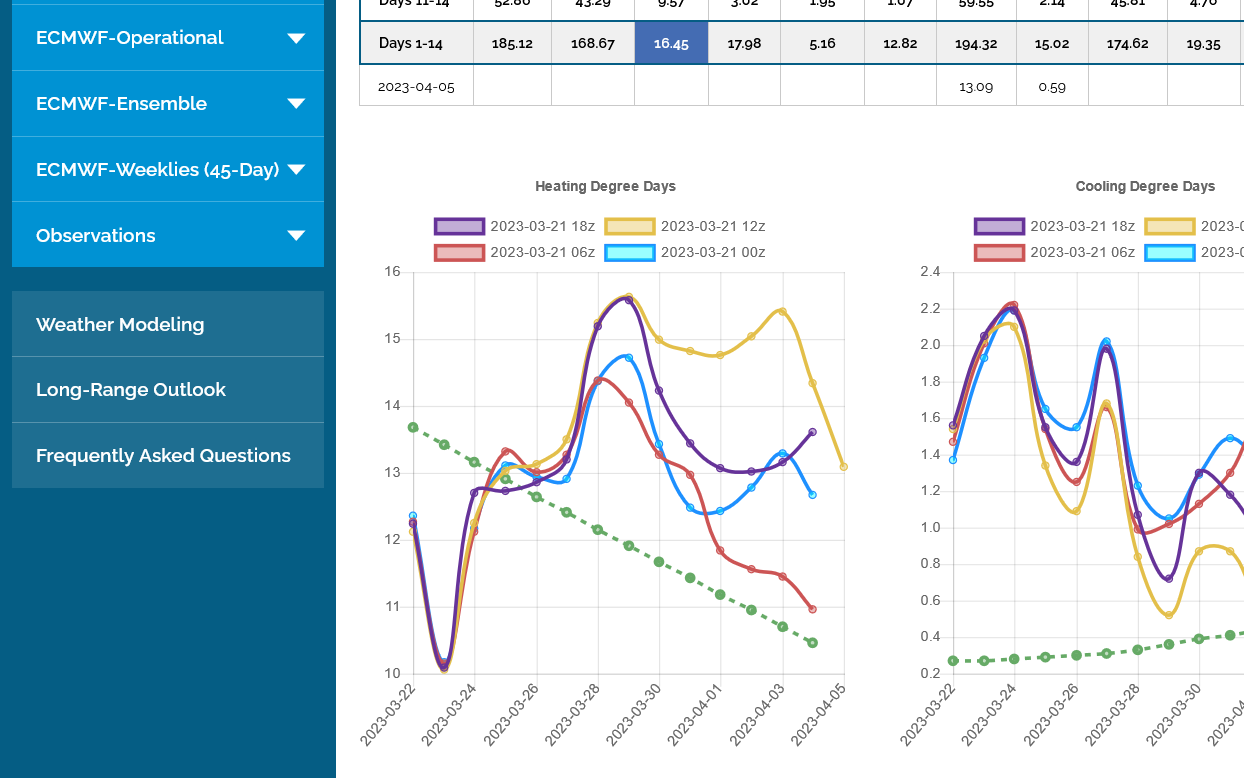
0z European Ensemble below was +5.5 HHDs but for April weather on 1 model run it means almost nothing with a pattern that looks like only slightly above average HDDs.
Interesting spike higher in CDDs on the right graph because of the heat generated from the Southeast upper level ridge. That makes the total HDDS +CDDs slightly more robust but still not big enough. Temps cool way down in week 2.

0z EE was -4 HDDs.
12z GEFS is also coming out milder.
This is April. HDDs are going away fast and CDDs, typically have a month to go for significance.
Temps for the EIA: https://www.marketforum.com/forum/topic/93796/#94152
![]()
https://ir.eia.gov/ngs/ngs.html
for week ending March 24, 2023 | Released: March 30, 2023 at 10:30 a.m. | Next Release: April 6, 2023
-47 BCF BEARISH for the amount of cold we had last week!
| Working gas in underground storage, Lower 48 states Summary text CSV JSN | |||||||||||||||||||||||||
|---|---|---|---|---|---|---|---|---|---|---|---|---|---|---|---|---|---|---|---|---|---|---|---|---|---|
| Historical Comparisons | |||||||||||||||||||||||||
| Stocks billion cubic feet (Bcf) | Year ago (03/24/22) | 5-year average (2018-22) | |||||||||||||||||||||||
| Region | 03/24/23 | 03/17/23 | net change | implied flow | Bcf | % change | Bcf | % change | |||||||||||||||||
| East | 343 | 355 | -12 | -12 | 268 | 28.0 | 285 | 20.4 | |||||||||||||||||
| Midwest | 437 | 461 | -24 | -24 | 317 | 37.9 | 346 | 26.3 | |||||||||||||||||
| Mountain | 82 | 84 | -2 | -2 | 89 | -7.9 | 89 | -7.9 | |||||||||||||||||
| Pacific | 73 | 72 | 1 | 1 | 160 | -54.4 | 164 | -55.5 | |||||||||||||||||
| South Central | 917 | 927 | -10 | -10 | 578 | 58.7 | 648 | 41.5 | |||||||||||||||||
| Salt | 262 | 262 | 0 | 0 | 167 | 56.9 | 194 | 35.1 | |||||||||||||||||
| Nonsalt | 655 | 664 | -9 | -9 | 411 | 59.4 | 453 | 44.6 | |||||||||||||||||
| Total | 1,853 | 1,900 | -47 | -47 | 1,411 | 31.3 | 1,532 | 21.0 | |||||||||||||||||
Totals may not equal sum of components because of independent rounding. | |||||||||||||||||||||||||
Working gas in storage was 1,853 Bcf as of Friday, March 24, 2023, according to EIA estimates. This represents a net decrease of 47 Bcf from the previous week. Stocks were 442 Bcf higher than last year at this time and 321 Bcf above the five-year average of 1,532 Bcf. At 1,853 Bcf, total working gas is within the five-year historical range.
For information on sampling error in this report, see Estimated Measures of Sampling Variability table below.
Note: The shaded area indicates the range between the historical minimum and maximum values for the weekly series from 2018 through 2022. The dashed vertical lines indicate current and year-ago weekly periods.
+++++++++
The U.S. Energy Information Administration (EIA) posted a withdrawal of 47 Bcf natural gas from storage for the week ended March 24. The result fell short of median estimates in polls while inventories remained well above average levels. Natural gas futures faltered in the wake of the report. Ahead of the print, May Nymex futures…
++++++++++++
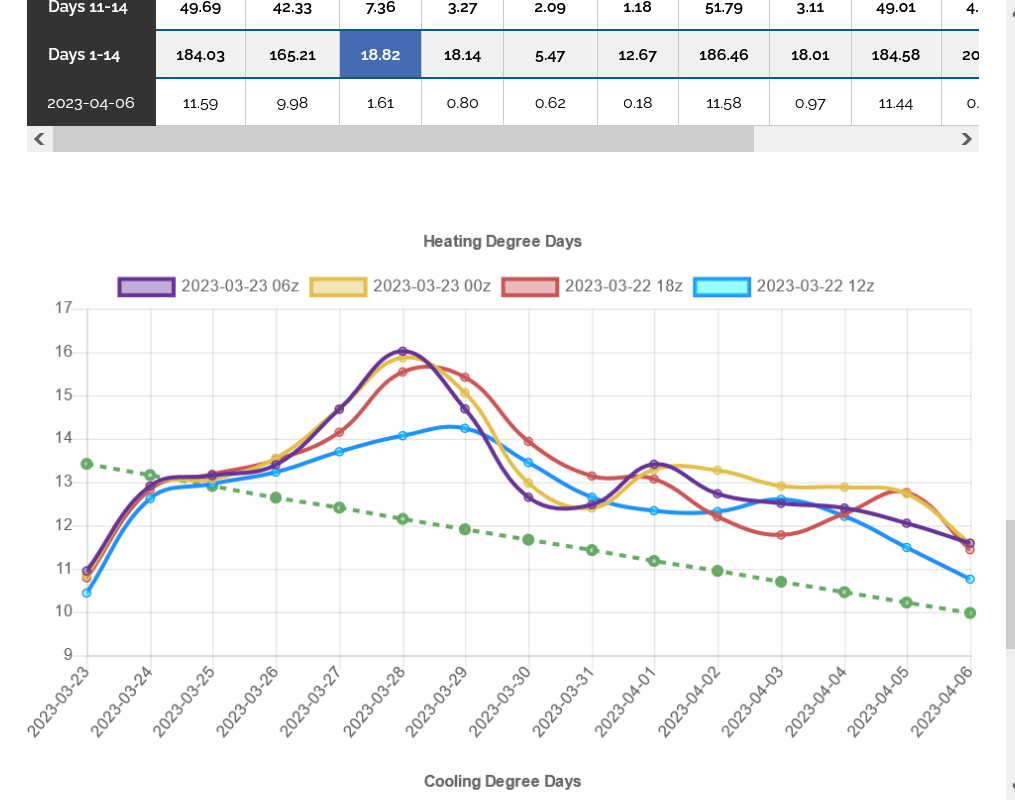
12z EE just out 2:30pm was +10 HDDs!
+++++++++++++++++
The likely plan with the record production/supplies since they blew up the Russian pipeline is to export record amounts to Europe to help replace the losses from Biden blowing up the Russian gas pipeline, Nordstream 2. This should gobble up a large chunk of the huge surplus.