Previous NG thread:
NG 3-14-23 33 responses
https://www.marketforum.com/forum/topic/93796/
+++++++++
Comprehensive weather thread: 95 responses
https://www.marketforum.com/forum/topic/83844/
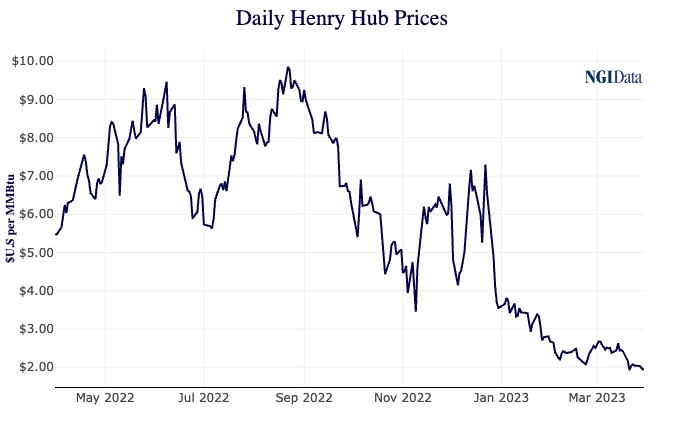
NG almost gapped lower and continues lower to new contract lows.
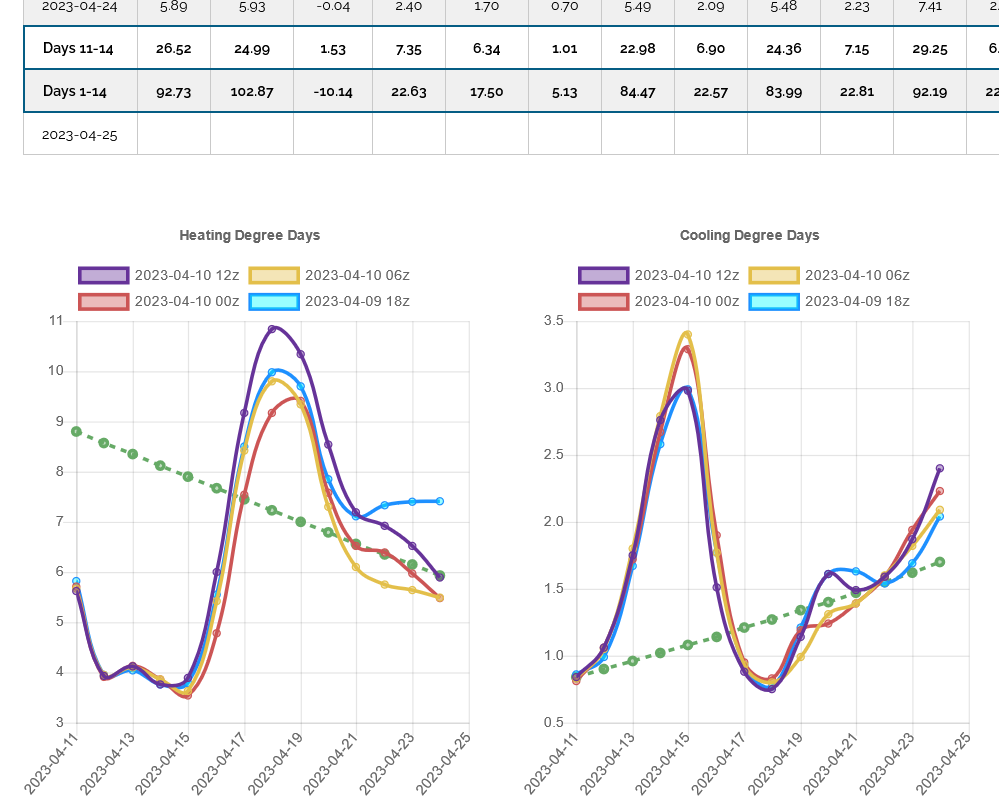
Models are milder, Not much change on the last EE but over the last 3 model runs, the GEFS was -25 HDDs!!!
The huge bearish factors with NG crashing from $10 to $2 since late last Summer are:
1. NG production +5-7 Bcf/day.
2. Freeport fire causing a loss in exports of 400+ Bcf from June 2022 to Feb 2023.
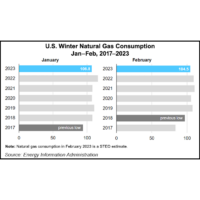
3. Mild weather over the Eastern half of the country which cut residential heating demand. Intense cold in the West has caused the Pacific region natural gas storage to be extremely low. The Mountain region is a bit low. Everywhere else added robust amounts to storage.
More details below:
2. Freeport exports averaged 1.77 Bcf/d before the explosion, which is almost 20% of our total export capacity. Multiply that over 8 months (partial restart in Feb.) and that’s well over 400 Bcf.
https://www.eia.gov/todayinenergy/detail.php?id=52859

3. Some amazing positive temperature anomalies for such a long period, 3 months in the Eastern and Southern US where the most people live. Dec-Jan-Feb!
https://www.cpc.ncep.noaa.gov/products/tanal/temp_analyses.php
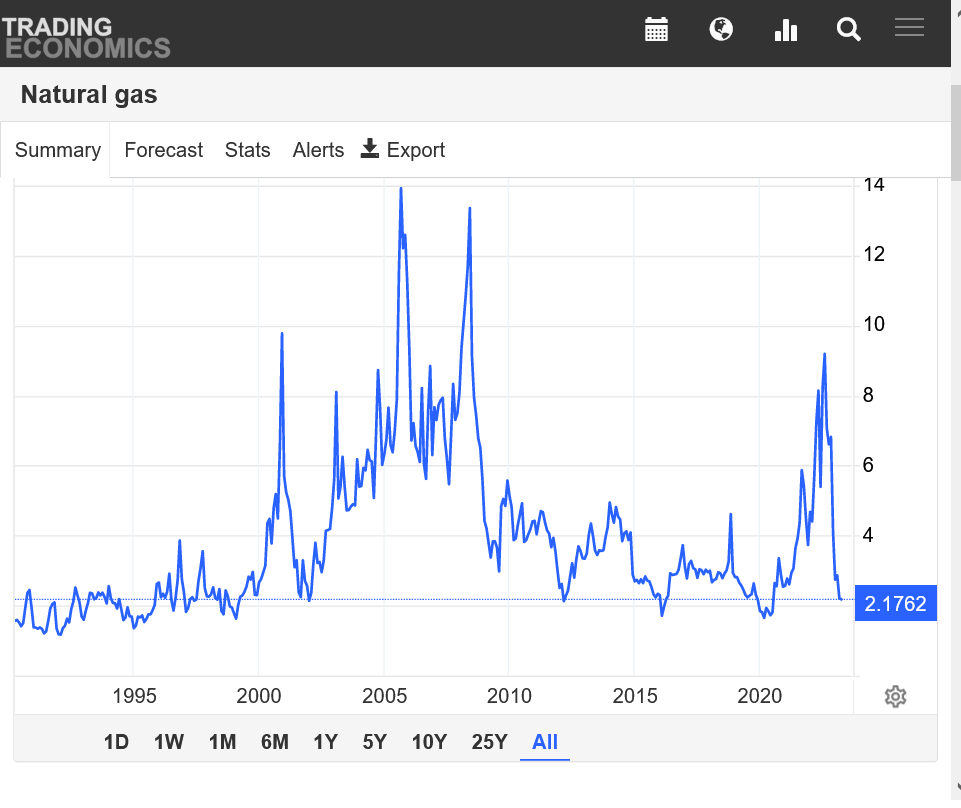
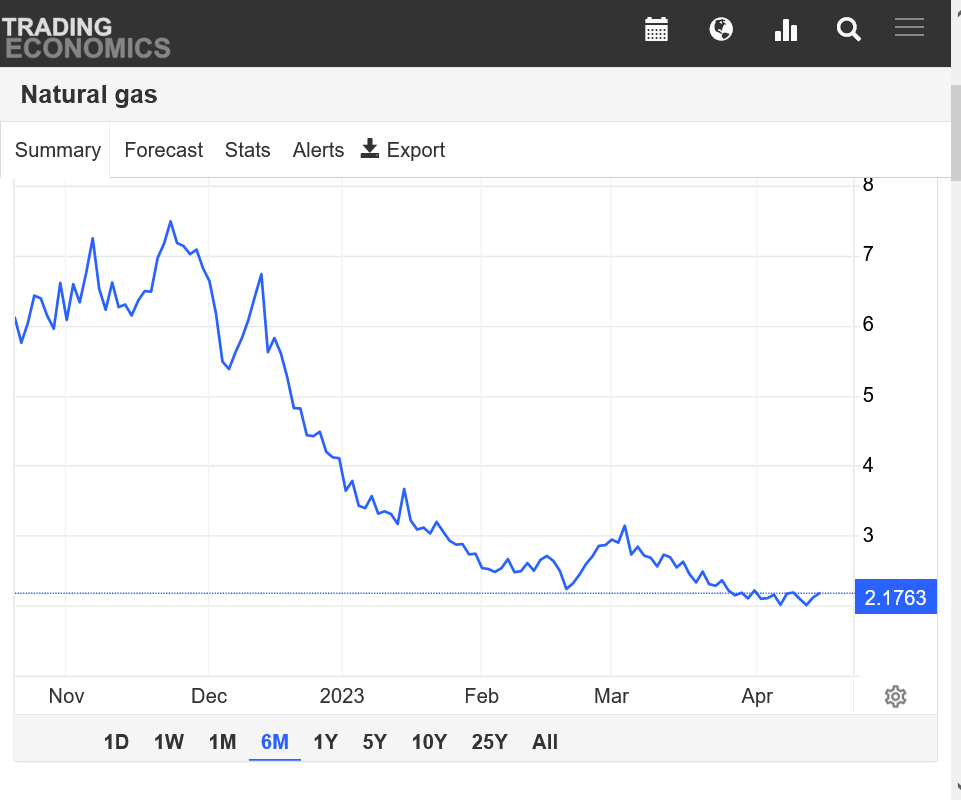
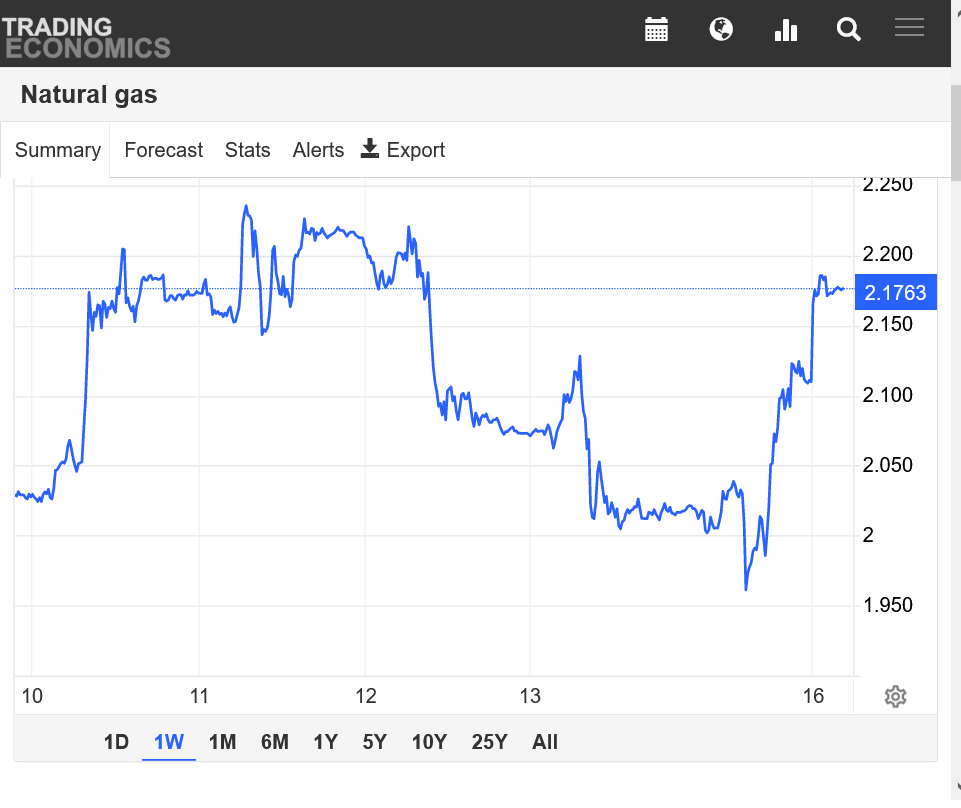
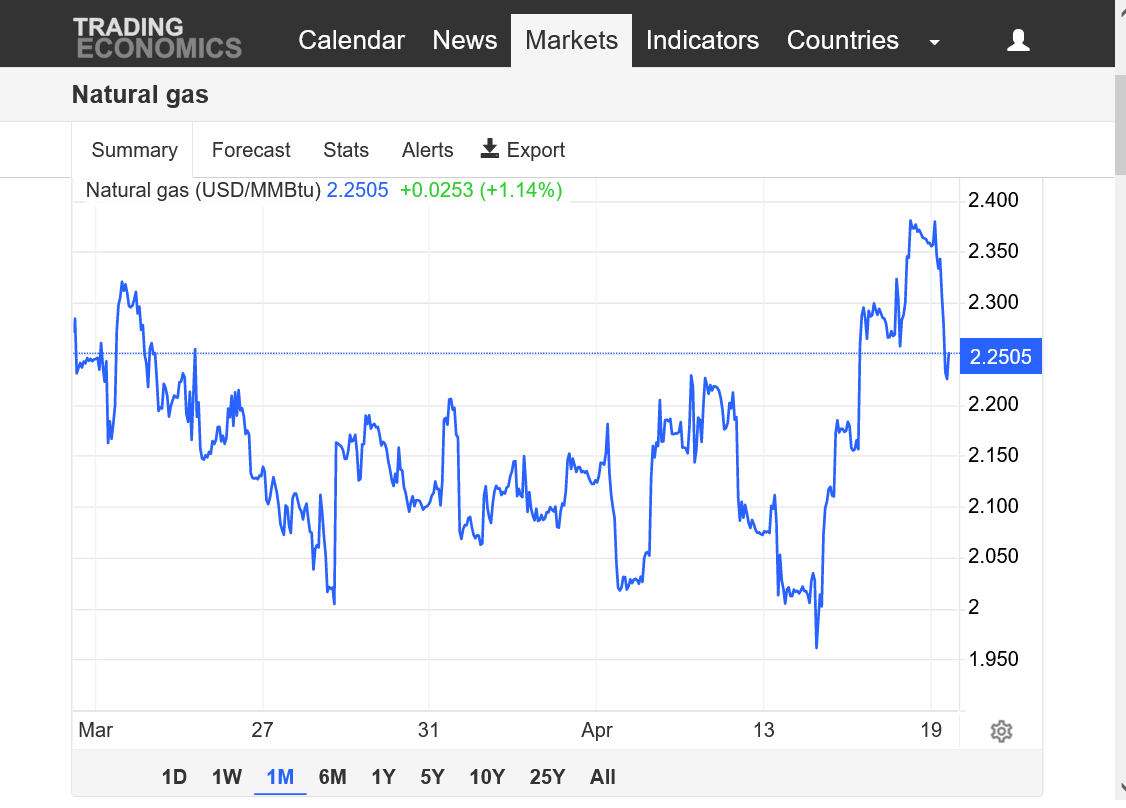
https://tradingeconomics.com/commodity/natural-gas
1. 1 year chart
2. 30+ year chart

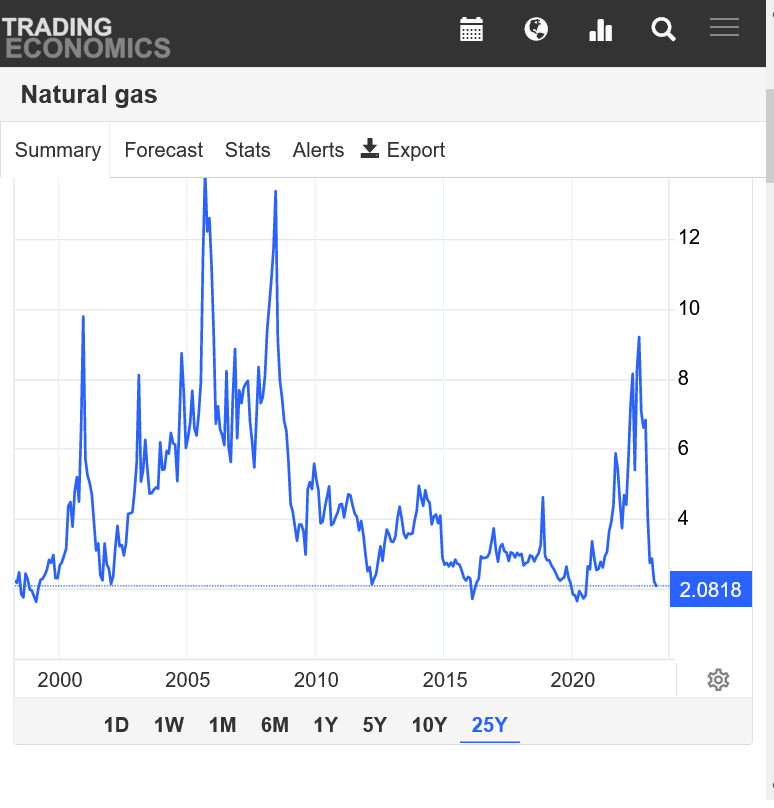
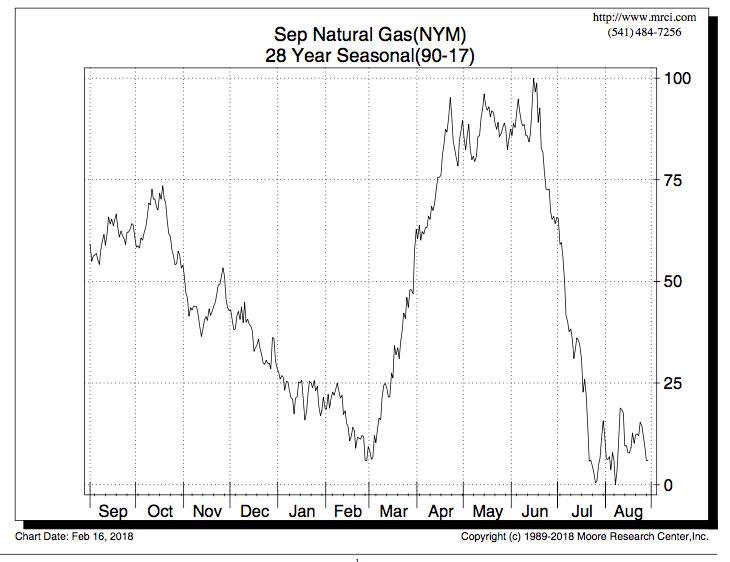
Below: Look at what the price of natural gas did historically based on the averages in March. It seems hard to believe that we are making contracts lows with such a strong positive seasonal but supplies are really gushing in at record levels right now.
Temps for this last EIA, from March 30, 2023
https://www.cpc.ncep.noaa.gov/products/tanal/temp_analyses.php
![]()
https://ir.eia.gov/ngs/ngs.html
for week ending March 24, 2023 | Released: March 30, 2023 at 10:30 a.m. | Next Release: April 6, 2023
-47 BCF BEARISH for the amount of cold we had last week! Look at the blue line on the graph below over the last 6 months! We went from LOW ng in storage to a HIGH amount in storage. But not in the Pacific Region or the Mountain Region.
| Working gas in underground storage, Lower 48 states Summary textCSVJSN | |||||||||||||||||||||||||
|---|---|---|---|---|---|---|---|---|---|---|---|---|---|---|---|---|---|---|---|---|---|---|---|---|---|
| Historical Comparisons | |||||||||||||||||||||||||
| Stocks billion cubic feet (Bcf) | Year ago (03/24/22) | 5-year average (2018-22) | |||||||||||||||||||||||
| Region | 03/24/23 | 03/17/23 | net change | implied flow | Bcf | % change | Bcf | % change | |||||||||||||||||
| East | 343 | 355 | -12 | -12 | 268 | 28.0 | 285 | 20.4 | |||||||||||||||||
| Midwest | 437 | 461 | -24 | -24 | 317 | 37.9 | 346 | 26.3 | |||||||||||||||||
| Mountain | 82 | 84 | -2 | -2 | 89 | -7.9 | 89 | -7.9 | |||||||||||||||||
| Pacific | 73 | 72 | 1 | 1 | 160 | -54.4 | 164 | -55.5 | |||||||||||||||||
| South Central | 917 | 927 | -10 | -10 | 578 | 58.7 | 648 | 41.5 | |||||||||||||||||
| Salt | 262 | 262 | 0 | 0 | 167 | 56.9 | 194 | 35.1 | |||||||||||||||||
| Nonsalt | 655 | 664 | -9 | -9 | 411 | 59.4 | 453 | 44.6 | |||||||||||||||||
| Total | 1,853 | 1,900 | -47 | -47 | 1,411 | 31.3 | 1,532 | 21.0 | |||||||||||||||||
Totals may not equal sum of components because of independent rounding. | |||||||||||||||||||||||||
Working gas in storage was 1,853 Bcf as of Friday, March 24, 2023, according to EIA estimates. This represents a net decrease of 47 Bcf from the previous week. Stocks were 442 Bcf higher than last year at this time and 321 Bcf above the five-year average of 1,532 Bcf. At 1,853 Bcf, total working gas is within the five-year historical range.
For information on sampling error in this report, see Estimated Measures of Sampling Variability table below.

Note: The shaded area indicates the range between the historical minimum and maximum values for the weekly series from 2018 through 2022. The dashed vertical lines indicate current and year-ago weekly periods.
Natural gas traders are scrambling to manage volatility and uncertainty in U.S. and global prices, resulting in a frenzy of hedging activity across the markets served by Intercontinental Exchange Inc., aka ICE.
The financial futures and physical exchange operator said Thursday (March 30) that open interest across ICE North American natural gas futures had hit a record high of 17.45 million contracts on Tuesday (March 28).
In futures and options, open interest was up 17% year/year at 27.84 million contracts, with volumes up 15% and average daily volume year-to-date of one million contracts.
As of March 28, ICE’s total natural gas complex spanning U.S., Canadian, European, UK and northeast Asian benchmarks for natural gas and LNG, also hit record open interest of 19.19 million futures contracts, eclipsing the previous record set in June 2021.
“We are seeing high levels of trading activity across North American natural gas markets as customers manage volatility and locational price risk, leading to higher demand for hedging which in turn is attracting more participants into the market and further benefiting liquidity,” said ICE’s J.C. Kneale, vice president for North America power, natural gas and natural gas liquids.
NGI is one of just two price reporting agencies that include ICE trade data in the price index determination process.
On March 28, ICE U.S. financial natural gas futures and options hit record open interest of 10.4 million contracts, with open interest up 11% y/y, the firm said.
ICE’s U.S. financial gas markets cover 64 hubs across North America.
“Hubs which have seen particularly strong volume activity this year include Houston Ship Channel Basis futures where volume is up 85%, Waha Basis futures volume up 25%, NWP Rockies Basis futures volume up 157%, CIG Rockies Basis futures volume up 243%, and REX Zone 3 Basis futures volume up 128%,” the firm said. “Meanwhile, cleared physical U.S. natural gas volumes rose by 24% y/y at ICE NGX, which offers clearing for physical natural gas delivered at 81 hubs covering 30 states across the U.S.”
In ICE’s Henry Hub LD1 future, meanwhile, open interest was up 22% y/y at 17.43 million contracts across futures and options, with volume up 11%, the firm said. “Options volume in Henry Hub is particularly strong this year, up 46% y/y, with open interest up 43%.”
U.S. natural gas prices have plunged to lows not seen since the height of the pandemic in 2020.
Upstream executives cited the plunge in gas prices and uncertainty about their recovery among the many challenges facing the industry in a recent survey by the Federal Reserve Bank of Dallas. Respondents, on average, said they expect Henry Hub prices to recover to $3.43/MMbtu by year-end.
The prompt-month Nymex contract was trading at $2.114/MMbtu early Friday.
The recent collapse in prices has made drilling unattractive in gas-rich plays such as the Haynesville and Marcellus shales, according to new research by Rystad Energy.
The Energy Information Administration, for its part, is forecasting an average Henry Hub price of around $3.00/MMBtu for 2023, down 50%/ year/year.
Get all the weather here:
https://www.marketforum.com/forum/topic/83844/
Extended week 2 VERY WARM and dry.
https://www.marketforum.com/forum/topic/83844/#83852
12z EE was -7 HDDs but heating degree weather trading is over for natural gas!
Natural gas futures were trading just shy of even early Thursday as mild April forecasts and a healthy storage cushion exiting the winter heating season kept the pressure on prices. The May Nymex contract was off 1.6 cents to $2.139/MMBtu at around 8:40 a.m. ET. The $2.197 high for May natural gas in Wednesday’s session…
+++++++++++++++++
Temps for the EIA report this morning. Warm Southeast last week. Cold elsewhere.
EIA -23 Bcf. Bearish.
NOTE THE BLUE LINE ON THE GRAPH BELOW!
We added more than +800 Bcf vs the previous year since last September.
![]()
for week ending March 31, 2023 | Released: April 6, 2023 at 10:30 a.m. | Next Release: April 13, 2023
| Working gas in underground storage, Lower 48 states Summary text CSV JSN | |||||||||||||||||||||||||
|---|---|---|---|---|---|---|---|---|---|---|---|---|---|---|---|---|---|---|---|---|---|---|---|---|---|
| Historical Comparisons | |||||||||||||||||||||||||
| Stocks billion cubic feet (Bcf) | Year ago (03/31/22) | 5-year average (2018-22) | |||||||||||||||||||||||
| Region | 03/31/23 | 03/24/23 | net change | implied flow | Bcf | % change | Bcf | % change | |||||||||||||||||
| East | 335 | 343 | -8 | -8 | 245 | 36.7 | 274 | 22.3 | |||||||||||||||||
| Midwest | 421 | 437 | -16 | -16 | 299 | 40.8 | 335 | 25.7 | |||||||||||||||||
| Mountain | 80 | 82 | -2 | -2 | 91 | -12.1 | 89 | -10.1 | |||||||||||||||||
| Pacific | 73 | 73 | 0 | 0 | 164 | -55.5 | 169 | -56.8 | |||||||||||||||||
| South Central | 921 | 917 | 4 | 4 | 588 | 56.6 | 665 | 38.5 | |||||||||||||||||
| Salt | 263 | 262 | 1 | 1 | 172 | 52.9 | 203 | 29.6 | |||||||||||||||||
| Nonsalt | 658 | 655 | 3 | 3 | 415 | 58.6 | 462 | 42.4 | |||||||||||||||||
| Total | 1,830 | 1,853 | -23 | -23 | 1,387 | 31.9 | 1,532 | 19.5 | |||||||||||||||||
Totals may not equal sum of components because of independent rounding. | |||||||||||||||||||||||||
Working gas in storage was 1,830 Bcf as of Friday, March 31, 2023, according to EIA estimates. This represents a net decrease of 23 Bcf from the previous week. Stocks were 443 Bcf higher than last year at this time and 298 Bcf above the five-year average of 1,532 Bcf. At 1,830 Bcf, total working gas is within the five-year historical range.
For information on sampling error in this report, see Estimated Measures of Sampling Variability table below.
Note: The shaded area indicates the range between the historical minimum and maximum values for the weekly series from 2018 through 2022. The dashed vertical lines indicate current and year-ago weekly periods.
+++++++++++++
HDD season is over. CDD season usually doesn't get going until May with early heat waves, typically lasting until September. Obviously, J-J-A are the key months of residential cooling demand when burning natural gas is used to generate electricity.
The high population centers of the Midwest, East and South consume the most natural gas for heating and cooling. The market can start dialing in higher prices on the first sign of major heat waves in those regions as early as the 10-14 day period on models. In rare situations even a week 3 event but with the massive supplies gushing in, we may have a suppressed speculative tone. On the other hand, these prices are extraordinarily low.
Other than 2020, when COVID hit, I've never seen ng do this in March/April, almost always the strongest time of year for price.
I wonder if the big market players that hedge and others that do much of the buying in the Spring are seeing a weak economy and lower industrial demand from these record fast interest rate hikes.
Why not just end the war in Ukraine instead of killing the US economy and hurting consumers around the globe?
The low for NGK today has been $2 exactly! -$1,550/contract.
https://tradingeconomics.com/commodity/natural-gas


NG up slightly. Weather not a factor. Usually isn't in April. Heating season is almost over. Cooling season a month+ away.
+++++++++++++++++
They're wrong about the reason. The previous 2 model runs, 0/6z GEFS came out -8 HDDs bearish right before market took off this morning. We have robust ng in storage and record supplies gushing in. I find it hard to believe that a 4 day moderate cold snap in mid April caused prices to go up $2,000/contract.
However, exports are picking up, seasonals very strong and $2 is extremely cheap and it held the test last night. The main thing that threatens lower prices is if the market senses an impending recession with a reduction in industrial demand.........which is a legit fear considering the decision makers are doing all the wrong things.
The 12z run just out was +9 HDDs!
Natural gas futures hovered close to even early Wednesday as traders continued to mull comparatively loose balances and mild spring-time weather-driven demand. The May Nymex contract was up 1.3 cents to $2.199/MMBtu at around 8:40 a.m. ET. While the May contract finished in positive territory Tuesday, bulls still have plenty of work to do to…
++++++++++++++
Temps below for tomorrows EIA. Southeast half very warm vs average. Northwest half very cold vs average(which is why we had the severe weather outbreaks!). More people live where it was warm.
https://www.cpc.ncep.noaa.gov/products/tanal/temp_analyses.php
We should note that storage in the Mountain region is on the low side right now and in the Pacific Regions, its precariously/dangerously low. The cold Winter in those regions has created massive draw downs.
https://www.marketforum.com/forum/topic/94295/#94381
We should note that storage in the Mountain region is on the low side right now and in the Pacific Regions, its precariously/dangerously low. The cold Winter in those regions has created massive draw downs.
Green energy policies are causing them to be unable to keep up.
https://www.marketforum.com/forum/topic/94295/#94381
++++++++++++++++++++
The graph below was thru January. We were never below 100,000 on this graph. The last EIA report showed the Pacific Region with just 73,000 Mcf in storage!
%20(Million%20Cubic%20Feet).png)
+++++++++++++
OK, here's the weekly data for the Pacific Region that shows where we are now. Lowest in the last 13 years. Looks like we got down to 102 Mcf in March of 2014, then 96 Mcf in March of 2019 for the previous lows.
https://www.eia.gov/dnav/ng/hist/nw2_epg0_swo_r35_bcfw.htm.png)
+++++++++++++++++++++++++++++
DEC-JAN-FEB temps below.
MARCH TEMPS BELOW
![]()
https://ir.eia.gov/ngs/ngs.html
for week ending April 7, 2023 | Released: April 13, 2023 at 10:30 a.m. | Next Release: April 20, 2023
+25 Bcf First injection of the year
| Working gas in underground storage, Lower 48 states Summary text CSV JSN | |||||||||||||||||||||||||
|---|---|---|---|---|---|---|---|---|---|---|---|---|---|---|---|---|---|---|---|---|---|---|---|---|---|
| Historical Comparisons | |||||||||||||||||||||||||
| Stocks billion cubic feet (Bcf) | Year ago (04/07/22) | 5-year average (2018-22) | |||||||||||||||||||||||
| Region | 04/07/23 | 03/31/23 | net change | implied flow | Bcf | % change | Bcf | % change | |||||||||||||||||
| East | 345 | 335 | 10 | 10 | 231 | 49.4 | 272 | 26.8 | |||||||||||||||||
| Midwest | 427 | 421 | 6 | 6 | 293 | 45.7 | 334 | 27.8 | |||||||||||||||||
| Mountain | 80 | 80 | 0 | 0 | 90 | -11.1 | 90 | -11.1 | |||||||||||||||||
| Pacific | 74 | 73 | 1 | 1 | 168 | -56.0 | 174 | -57.5 | |||||||||||||||||
| South Central | 929 | 921 | 8 | 8 | 613 | 51.5 | 690 | 34.6 | |||||||||||||||||
| Salt | 261 | 263 | -2 | -2 | 184 | 41.8 | 215 | 21.4 | |||||||||||||||||
| Nonsalt | 667 | 658 | 9 | 9 | 429 | 55.5 | 475 | 40.4 | |||||||||||||||||
| Total | 1,855 | 1,830 | 25 | 25 | 1,395 | 33.0 | 1,560 | 18.9 | |||||||||||||||||
Totals may not equal sum of components because of independent rounding. | |||||||||||||||||||||||||
Working gas in storage was 1,855 Bcf as of Friday, April 7, 2023, according to EIA estimates. This represents a net increase of 25 Bcf from the previous week. Stocks were 460 Bcf higher than last year at this time and 295 Bcf above the five-year average of 1,560 Bcf. At 1,855 Bcf, total working gas is within the five-year historical range.
For information on sampling error in this report, see Estimated Measures of Sampling Variability table below.
+++++++++++++++++++++++
+++++++++++++++
We're back down close to $2 here, just after 11am. Weather is not a factor. Seasonals are very strong in this time frame but have not been able to overcome the amount of supplies gushing in. Maybe the market is anticipating a recession that will reduce the amount of industrial demand? That's a wild guess because we shouldn't be this weak with prices staying down here. Maybe more supplies for longer?
Natural gas made a spike new contract low very early this morning and has had a powerful reversal higher.
NG had follow thru from the huge reversal higher from contract lows on Friday.
We gapped a bit higher on the open and have held.
One can speculate that this is from the very chilly late April weather but realistically, it's not going to make much difference to the ng in storage because the heating season is pretty much over.
In fact, CDDs will be passing up HDDs seasonally in a month.
NG is incredibly cheap. We tested and held $2 on Friday. Seasonals are still very strong in April.
NG supplies continue to gush in but exports should be picking up too.
1. 35+ years
2. 5 years
3. 6 months
4. 1 month
5. 1 week


Temps for this Thursdays EIA at 9:30 am. Should be another injection. Bearish? But known and dialed in when prices dropped BEFORE(during) that weather happened.
https://www.cpc.ncep.noaa.gov/products/tanal/temp_analyses.php
This is what they ended last week with:
Apr 14, 2023
This is what they started with this week:
Apr 17, 2023
++++++++++++
It's late April(cold isn't going to make much difference) and the forecast didn't change that much.
However, this WAS a HUGE deal below:
Story of the day
April 17, 2023
From the Tue close, after 2 days of sharply higher prices:
Apr 18, 2023
++++++++++++
From Wed am, with sharply lower prices:
Natural gas futures pared their recent gains in early trading Wednesday as the market continued to mull the impact on balances of a chilly late April weather pattern. After rallying the past three sessions, including a 9.1-cent gain on Tuesday, the April Nymex contract was down 9.0 cents to $2.276/MMBtu at around 8:40 a.m. ET.…
+++++++++++++++
Bottom line: WEATHER IS NOT the driving force for price determination right now. The weather has NOT changed even though they want to attribute sharp daily moves to it.
Last Friday, the market spiked below the psychological $2, contract low, hit tons of stops and reversed much higher..........a key reversal at a time of year that normally features price strength. This inspired a great deal of buying that caused prices to go up sharply on Mon and Tue and the chilly late April weather was just an excuse. The weather has not changed.
1. 1 month chart
2. 35 year chart
https://tradingeconomics.com/commodity/natural-gas

12z GEFS was +7 HDDS and EE +8 HDDs compared to 0z runs......with market continuing to drop. Confirming that weather is not in control.
HUGE injection! +75 Bcf
https://ir.eia.gov/ngs/ngs.html
![]()
for week ending April 14, 2023 | Released: April 20, 2023 at 10:30 a.m. | Next Release: April 27, 2023
| Working gas in underground storage, Lower 48 states Summary text CSV JSN | |||||||||||||||||||||||||
|---|---|---|---|---|---|---|---|---|---|---|---|---|---|---|---|---|---|---|---|---|---|---|---|---|---|
| Historical Comparisons | |||||||||||||||||||||||||
| Stocks billion cubic feet (Bcf) | Year ago (04/14/22) | 5-year average (2018-22) | |||||||||||||||||||||||
| Region | 04/14/23 | 04/07/23 | net change | implied flow | Bcf | % change | Bcf | % change | |||||||||||||||||
| East | 363 | 345 | 18 | 18 | 237 | 53.2 | 280 | 29.6 | |||||||||||||||||
| Midwest | 450 | 427 | 23 | 23 | 302 | 49.0 | 339 | 32.7 | |||||||||||||||||
| Mountain | 84 | 80 | 4 | 4 | 89 | -5.6 | 91 | -7.7 | |||||||||||||||||
| Pacific | 83 | 74 | 9 | 9 | 169 | -50.9 | 178 | -53.4 | |||||||||||||||||
| South Central | 949 | 929 | 20 | 20 | 645 | 47.1 | 714 | 32.9 | |||||||||||||||||
| Salt | 266 | 261 | 5 | 5 | 199 | 33.7 | 225 | 18.2 | |||||||||||||||||
| Nonsalt | 684 | 667 | 17 | 17 | 446 | 53.4 | 489 | 39.9 | |||||||||||||||||
| Total | 1,930 | 1,855 | 75 | 75 | 1,442 | 33.8 | 1,601 | 20.5 | |||||||||||||||||
Totals may not equal sum of components because of independent rounding. | |||||||||||||||||||||||||
Working gas in storage was 1,930 Bcf as of Friday, April 14, 2023, according to EIA estimates. This represents a net increase of 75 Bcf from the previous week. Stocks were 488 Bcf higher than last year at this time and 329 Bcf above the five-year average of 1,601 Bcf. At 1,930 Bcf, total working gas is within the five-year historical range.
For information on sampling error in this report, see Estimated Measures of Sampling Variability table below.
Natural gas futures edged up on Thursday as weather models aligned better in showing cooler weather returning every few days or so through early May across the Lower 48. With EIA data indicating that balances remain too loose, however, the May Nymex gas futures contract only managed a 2.7-cent gain to $2.249/MMBtu. Spot gas traded…
++++++++++
EE was +6 HDDs bullish in the afternoon and NG responding by DROPPING $600/contract. No, cold weather is NOT the main driving force at the end of April/early May. In fact, seasonally, CDDs pass up HDDs around May 10th!
This is especially so with NG in storage now and incredible +488 Bcf compared to a year ago. That got to be close to the record and supplies still gushing in.
NG, historically almost always goes higher in March/April but those bearish fundamentals have been crushing the price. The economy could be slowing down too which would kill industrial demand for NG.
Nothing new today. Certainly not with weather.
Cooler weather ushered in by a strong spring storm over the weekend set the table for strong heating demand most of this week across the northern United States. That was enough to drive a modest increase for natural gas futures on Monday, with the May Nymex contract settling at $2.273/MMBtu, up 4.0 cents from Friday’s…
7 day temps for this Thursdays EIA report
Another bearish, robust injection likely
https://www.cpc.ncep.noaa.gov/products/tanal/temp_analyses.php
Texas is looking to natural gas to cover the failures of wind and solar that led to the famous Texas winter blackouts.
Thanks Jean!
https://www.marketforum.com/forum/topic/94557/#94576
https://www.masterresource.org/droz-john-awed/25-industrial-wind-energy-deceptions/
CapitalCronyism in leading wind producer Texas.
https://www.marketforum.com/forum/topic/88534/#88536
https://www.marketforum.com/forum/topic/88432/#88472
Green Energy Scores a 76X ROI for Their Lobbying Efforts
https://www.transparencyusa.org/article/green-energy-lobby-roi
https://www.marketforum.com/forum/topic/78233/#78455
Texas vulnerable for another winter blackout
Started by metmike - Dec. 2, 2021, 11:36 a.m.
https://www.marketforum.com/forum/topic/78601/
How we generate electricity
Started by madmechanic - Aug. 7, 2021, 2:17 p.m.
https://www.marketforum.com/forum/topic/73293/
KillingCoal
11 responses |
Started by metmike - Nov. 21, 2021, 10:57 p.m.
https://www.marketforum.com/forum/topic/78168/
Global warming causes everything/TEXAS
https://www.marketforum.com/forum/topic/65704/
Texas energy messed up again
https://www.marketforum.com/forum/topic/71143/
+++++++++++++
Back to the markets:
Oil market today:
Story of the day
Natural gas futures continued to trade mostly sideways Tuesday, with little deviation from the cooler-than-normal weather pattern through early May and robust supplies showing no signs of pulling back. With the Nymex contract’s expiration looming, May futures settled at $2.307/MMBtu, up 3.4 cents on the day. June futures slipped by the same amount to $2.437.…
++++++++++++
Front month May will be expiring tomorrow:
News from earlier today:
Natural gas could see “choppy trading” going into the final expiration of the May contract tomorrow, EBW Analytics Group analyst Eli Rubin said.
“While the May natural gas contract showed relative weakness yesterday, medium-to-longer term strength (July-December 2023 contracts added an average 7.2 cents) eventually pulled the Nymex front-month higher,” Rubin said. “Weather forecasts continue to crawl in a supportive direction and stave off fears of extreme natural gas price weakness this spring.”
Still, the latest LNG and production estimates early Tuesday were pointing to potentially concerning trends for bulls, according to the analyst.
EBW estimates were showing declines in demand readings at the Freeport and Corpus Christi terminals. On the supply side, production was back up at a three-week high, the firm’s estimates showed.
“We retain a mild immediate-term bearish bias into May contract options expiry today and final settlement tomorrow, with key resistance at the 20-day moving average of $2.161,” Rubin said.
Looking at the June contract, natural gas is “seeing some encouraging signs of life” following Monday’s gains, according to ICAP Technical Analysis.
“In fact, thanks to Monday’s advance, the June contract is trading above the high from April 18 and above the 50-day moving average in spot terms” with the May contract rollover imminent, ICAP analyst Brian LaRose said.
However, bulls have more work to do, according to the analyst.
“To suggest this reversal could have staying power, $2.543, $2.599-2.613, $2.650 and $2.716-2.740-2.795 must be exceeded as well,” LaRose said.
Meanwhile, looking ahead to Thursday’s Energy Information Administration (EIA) storage report, NGI is modeling a 77 Bcf injection for the week ending April 21.
That would compare with a five-year-average injection of 43 Bcf and a year-earlier 42 Bcf build.
Total Lower 48 working gas in underground storage stood at 1,930 Bcf as of April 14, at a 329 Bcf (plus 20.5%) surplus to the five-year average, EIA data show.
![]()
+79 Bcf= BEARISH but expected. +525 Bcf compared to 1 year ago!!!!
for week ending April 21, 2023 | Released: April 27, 2023 at 10:30 a.m. | Next Release: May 4, 2023
https://ir.eia.gov/ngs/ngs.html
| Working gas in underground storage, Lower 48 states Summary text CSV JSN | |||||||||||||||||||||||||
|---|---|---|---|---|---|---|---|---|---|---|---|---|---|---|---|---|---|---|---|---|---|---|---|---|---|
| Historical Comparisons | |||||||||||||||||||||||||
| Stocks billion cubic feet (Bcf) | Year ago (04/21/22) | 5-year average (2018-22) | |||||||||||||||||||||||
| Region | 04/21/23 | 04/14/23 | net change | implied flow | Bcf | % change | Bcf | % change | |||||||||||||||||
| East | 390 | 363 | 27 | 27 | 238 | 63.9 | 286 | 36.4 | |||||||||||||||||
| Midwest | 468 | 450 | 18 | 18 | 308 | 51.9 | 344 | 36.0 | |||||||||||||||||
| Mountain | 90 | 84 | 6 | 6 | 90 | 0.0 | 93 | -3.2 | |||||||||||||||||
| Pacific | 90 | 83 | 7 | 7 | 171 | -47.4 | 184 | -51.1 | |||||||||||||||||
| South Central | 971 | 949 | 22 | 22 | 677 | 43.4 | 738 | 31.6 | |||||||||||||||||
| Salt | 275 | 266 | 9 | 9 | 213 | 29.1 | 234 | 17.5 | |||||||||||||||||
| Nonsalt | 695 | 684 | 11 | 11 | 464 | 49.8 | 504 | 37.9 | |||||||||||||||||
| Total | 2,009 | 1,930 | 79 | 79 | 1,484 | 35.4 | 1,644 | 22.2 | |||||||||||||||||
Totals may not equal sum of components because of independent rounding. | |||||||||||||||||||||||||
Working gas in storage was 2,009 Bcf as of Friday, April 21, 2023, according to EIA estimates. This represents a net increase of 79 Bcf from the previous week. Stocks were 525 Bcf higher than last year at this time and 365 Bcf above the five-year average of 1,644 Bcf. At 2,009 Bcf, total working gas is within the five-year historical range.
For information on sampling error in this report, see Estimated Measures of Sampling Variability table below.
Note: The shaded area indicates the range between the historical minimum and maximum values for the weekly series from 2018 through 2022. The dashed vertical lines indicate current and year-ago weekly periods.
++++++++++
Note the blue line on the post above: +525 Bcf compared to 1 year ago! As we've expressed it "supplies continue to gush in"
https://www.marketforum.com/forum/topic/94295/#94801
This has been the time of year when NG prices almost always go up, something like 95% of the time, historically in March/April. Supplies gushing in have offset that and kept selling pressure on the market anytime it tries to go up.
2023 is in the 5% of years when the price did NOT go up.
The U.S. Energy Information Administration (EIA) reported an injection of 54 Bcf natural gas into storage for the week ended April 28. The result was essentially on par with expectations and failed to provide support for floundering Nymex natural gas futures. Ahead of the EIA print, the June Nymex gas futures contract was down 5.8…
![]()
https://ir.eia.gov/ngs/ngs.html
for week ending April 28, 2023 | Released: May 4, 2023 at 10:30 a.m. | Next Release: May 11, 2023
| Working gas in underground storage, Lower 48 states Summary text CSV JSN | |||||||||||||||||||||||||
|---|---|---|---|---|---|---|---|---|---|---|---|---|---|---|---|---|---|---|---|---|---|---|---|---|---|
| Historical Comparisons | |||||||||||||||||||||||||
| Stocks billion cubic feet (Bcf) | Year ago (04/28/22) | 5-year average (2018-22) | |||||||||||||||||||||||
| Region | 04/28/23 | 04/21/23 | net change | implied flow | Bcf | % change | Bcf | % change | |||||||||||||||||
| East | 410 | 390 | 20 | 20 | 251 | 63.3 | 301 | 36.2 | |||||||||||||||||
| Midwest | 481 | 468 | 13 | 13 | 322 | 49.4 | 360 | 33.6 | |||||||||||||||||
| Mountain | 95 | 90 | 5 | 5 | 92 | 3.3 | 97 | -2.1 | |||||||||||||||||
| Pacific | 100 | 90 | 10 | 10 | 175 | -42.9 | 193 | -48.2 | |||||||||||||||||
| South Central | 977 | 971 | 6 | 6 | 715 | 36.6 | 772 | 26.6 | |||||||||||||||||
| Salt | 278 | 275 | 3 | 3 | 230 | 20.9 | 247 | 12.6 | |||||||||||||||||
| Nonsalt | 699 | 695 | 4 | 4 | 486 | 43.8 | 525 | 33.1 | |||||||||||||||||
| Total | 2,063 | 2,009 | 54 | 54 | 1,556 | 32.6 | 1,722 | 19.8 | |||||||||||||||||
Totals may not equal sum of components because of independent rounding. | |||||||||||||||||||||||||
Working gas in storage was 2,063 Bcf as of Friday, April 28, 2023, according to EIA estimates. This represents a net increase of 54 Bcf from the previous week. Stocks were 507 Bcf higher than last year at this time and 341 Bcf above the five-year average of 1,722 Bcf. At 2,063 Bcf, total working gas is within the five-year historical range.
For information on sampling error in this report, see Estimated Measures of Sampling Variability table below.
+++++++++
7 day temps last week for this report. Unseasonably cold in much of the country, especially the center/Midwest!
https://www.cpc.ncep.noaa.gov/products/tanal/temp_analyses.php