Energy Transition Will Take Decades/fake climate crisis
https://www.marketforum.com/forum/topic/93687/
++++++++++++++++++++
There Is No Energy Transition, Just Energy Addition
https://wattsupwiththat.com/2023/03/12/there-is-no-energy-transition-just-energy-addition/
While wind and solar power are taking a larger piece out of a growing world primary energy pie, fossil fuels are expected to have more absolute growth through 2050.
As Liberty Energy CEO Chris Wright explained in his viral video a few weeks ago, dishonest terminology surrounds the climate debate. One of these terms is “Energy Transition”. The term’s use gives the impression that there exists a quick, easy and scalable alternative to eliminate fossil fuel use without serious impact on people.
Current primary energy distribution by source, and forecasts by organizations like the EIA in their International Energy Outlook 2021, show that this “energy transition” is non-existent. As you can see in the title graph above, and also in Liberty’s ESG report on Bettering Human Lives, no present quantity of primary energy generated by oil or gas is currently replaced by renewables. A couple of headlines from the report that you don’t hear a lot:
The reason for this growth is simple: fossil fuels are abundant, cheap and efficient to provide reliable and dense energy at scale. They have helped to generate a quality-of-life revolution for a portion of humanity, and people in poverty who have missed out on this blessing rightfully want what you and I already have.
Sadly, few report on this blessing we take for granted. Good news about renewables breaking records, however, is widespread and often inflated. There are a few marketing strategies renewable advocates have used that make it appear as if renewables have a larger market share than they really have:
First, using the word “energy” or “power” when they mean “electricity”. Take this Reuters report as an example: “Renewable energy is expected to account for around 46% of German power consumption this year….” This sounds like Germans are running on renewables for almost half of their energy needs. But this is JUST for electricity. According to the BP Statistical Review and graphed below by OurWorldInData.org for world electricity vs primary power, worldwide electricity represents only 17% of all primary power. That’s also where is currently stands in Germany. In 2021, Germany’s top three primary energy sources were oil, natural gas and coal.
Second, reporting renewable records without mentioning they only last a short time. As an example, this article boasts renewables powering 85% of Germany’s electricity needs. But like the electricity primary power sources reported in the plot below reported by Timera Energy, records in wind and solar don’t last very long, and there are times when they don’t provide anything at all. Fossil fuels are there to back them up – you are welcome. Energy reliability is a marathon, not a sprint.
Third, reporting power capacity, not energy output. Renewables really shine using this metric because they don’t work most of the time. If you have ever spent time in western Europe, you will know that the sun there, like most Europeans, only has a 32-hour work week, while it gives little heads up when it will show up. What to do during the remaining 136 hours that week? You need to build a lot of power capacity to harvest a little energy. As per BP Statistical Review, the world capacity factor is only 14% for solar and 26% for wind. Therefore, if you see a historical power capacity growth curve, divide the solar curve’s slope by 7 and the wind curve’s slope by 4 to get energy output. Consumers pay for MWh, not MW.
Lastly, lumping in “traditional biofuels” to boost the share of renewables as part of total energy needs. These traditional biofuels kill millions of people yearly through PM2.5 particle release during indoor cooking. If there is a “transition” humanity needs ASAP, it is the transition from the traditional renewable cooking fuels to clean-burning fossil cooking fuels.
These unfair reporting methodologies have led to confusion and a belief that an “Energy Transition” is currently in the making. It is not
Lastly, lumping in “traditional biofuels” to boost the share of renewables as part of total energy needs. These traditional biofuels kill millions of people yearly through PM2.5 particle release during indoor cooking. If there is a “transition” humanity needs ASAP, it is the transition from the traditional renewable cooking fuels to clean-burning fossil cooking fuels.
These unfair reporting methodologies have led to confusion and a belief that an “Energy Transition” is currently in the making. It is not.
The EIA primary energy forecast for the next 30 years shows that ALL sources of energy are growing. While renewables claim a larger fraction of a growing pie, fossil fuels are expected to grow faster in absolute terms.
Recently, a spark of sanity has returned to the debate about nuclear power. For a reliable, cost-effective, low-carbon and scalable energy transition, we need to take the path proposed by Robert Bryce in his book Power Hungry. In the near-term, we need more natural gas, which reduces our CO2 footprint and is cheap, reliable and abundant. For the long-term, we need to build nuclear energy, hopefully eventually nuclear fusion. Before that, let’s hope a spark of sanity returns to the discussion about the “Energy Transition”.
https://wattsupwiththat.com/2023/04/17/addressing-wind-solar-instability-hardwiring-the-grid/
By Ed Ireland — April 17, 2023
The near failure of the Texas power grid, coming just 4 minutes and 37 secondsfrom a complete collapse on February 14, 2021, was the first alarm bell that something was dreadfully wrong with US power grids. Meredith Angwin, a physical chemist and power grid specialist, described the February 2021 failure of the Texas power grid failure as a seminal event that was not a surprise:
Those of us who were watching the grid had noticed for years that Texas ran with a very low reserve margin…and there were predictions that Texas was going to be in trouble, [1],”
Since then, more power-grid operators have been speaking out about the increasing instability of their grids due to an over-weighting of non-dispatchable wind and solar power. A report on February 24, 2023, from the largest power grid in the US, PJM, warned of “increasing reliability risks” affecting 13 states and the District of Columbia and 65 million people who get their power from PJM. This report is a wake-up call for all US power grids because most face the same grid instability problems highlighted in the report:
More grids have been warning that the addition of new wind and solar needs to be restrained and that retirements of dispatchable thermal generation—such as coal, nuclear and natural gas—need to slow.
On the contrary, the Texas Senate plan is designed to address the anticompetitive policies embodied in the comically-misnamed Inflation Reduction Act and other policies coming out of the Biden Administration. As PJM CEO Asthana (cited above) noted, such measures are needed because “the U.S. no longer has competitive energy markets now that the heavy hand of government has superseded markets with massive taxes and subsidies for wind and solar.”
https://wattsupwiththat.com/2023/06/14/limits-to-wind-and-solar-on-the-grid-a-discussion/
“While solar and wind receive huge subsidies, the end user pays for the party.”
“The dream of a solar and wind grid is collapsing very quickly as they are only profitable in a low penetration context.”
US House Committee on Energy and Commerce
Oversight of FERC: Adhering to a Mission of Affordable & Reliable Energy for America
June 13, 2023
FERC Commissioner Christie: “I think we’re heading for potentially very dire consequences, potentially catastrophic consequences in the United States in terms of the reliability of our grid, and I think that the basic reason is that we’re facing a shortfall of power supply. You know the term we use is resource adequacy, but what we’re really talking about is potentially a shortfall in power supply. You have to remember about the grid. The grid has to have power being fed into it every second of every minute of every hour of every day to keep the lights on. You can’t store it up and bring it out the next day. Because of that you have to have a power supply that is feeding into the grid on a continuous basis. We can’t tolerate shortages because shortages mean the lights go out. So what’s going on now and what’s the threat to reliability? In summary, what the threat is is this. We are facing cascading retirements of dispatchable resources, specifically coal and to a lesser extent gas. And, the problem with losing that many dispatchable resources is you’re losing the supply that is going to keep the lights on. The problem is not the addition of wind and solar. The problem is the subtraction of coal and gas and other dispatchable resources which are the ones we need during this transition to keep the lights on. That’s the fundamental problem.”
Related:
FERC Commissioner Christie: “The one issue I want to focus on today, I think is reliability, and I’m really afraid to say that I think the United States is heading for a very catastrophic situation in terms of reliability — hope it doesn’t happen, but I think were heading for potentially catastrophic consequences. And, the core of the problem is actually very simple. We are retiring dispatchable generating resources at a pace and in an amount that is far too fast and far too great and it is threatening our ability to keep the lights on.”
++++++++++
++++++++++
“CCS has been slow to take off due to the cost of capture and the limited salability of carbon dioxide as a product. Thirty-nine CCS facilities capture CO2 around the world today, totaling 45 million tons per year, or about one-tenth of one percent (0.1%) of industrial emissions produced globally.”
The Environmental Protection Agency is working on a new rule that would set stringent limits on carbon dioxide (CO2) emissions from US power plants. Utilities would be required to retrofit existing plants with carbon capture and storage (CCS) technology or to switch to hydrogen fuel. Others call for the use of CCS to decarbonize heavy industry. But the cost of capture and the amount of CO2 that proponents say needs to be captured crush any ideas about feasibility
++++++++++++++++
https://wattsupwiththat.com/2022/04/19/upper-midwest-counties-attempt-to-block-ccs-pipeline/
Report: U.S. power grid not ready for growing EV market
https://www.carolinajournal.com/report-u-s-power-grid-not-ready-for-growing-ev-market/
"U.S. power grid not ready for growing EV market"
IT NEVER WILL BE ~ EVER!!!!!
THE SOUNDING OF THAT TRUMPET, WILL END ALL THIS STUPIDITY! BRING IT ON!
Top British climate official says moving too quickly to green energy will 'simply impoverish people'
I'm doing my best to write this as sarcastically as possible on purpose. Ahem
"Grid not ready for EV transition"
Now who could have seen this coming?
Certainly not the grid engineers, power transmission engineers, power generation engineers or anyone who knows anything about power distribution.
I've been saying this for years at this point. There isn't enough power generation or copper in this country to support a full country EV transition. And there sure as hell won't be enough power generation if they want to do this with only "green" or "renewable" power generation methods (IE wind or solar). To come anywhere close, we need nuclear.
Extremely well stated madmechanical engineer. Great to read you!
You keep making a regular habit of seeing authentic science/energy and the truth based on the physical laws which define those realms and NOT the DISinformation which the uniformed gobble up because they want to believe in it or because they go to sources which push convincing mainstream fake green energy schemes for political agenda, crony capitalism, media ratings and misguided environmentalism.
Nuclear power is the cleanest energy of all.
https://www.energy.gov/ne/articles/3-reasons-why-nuclear-clean-and-sustainable
+++++++++++++++
Here's the opposing view:
https://www.oneearth.org/the-7-reasons-why-nuclear-energy-is-not-the-answer-to-solve-climate-change/
++++++++++++++++
For people that realize we're having a climate optimum for life on this greening planet, the push for nuclear is NOT to solve a non problem. It just makes sense in the long run. Fossil fuels will continue to be our main energy source for decades (net zero is a hoax). However fossil fuels will run out eventually.
Nuclear runs 24 hours a day, not just when the wind blows or sun shines.
https://www.westernjournal.com/op-ed-one-simple-energy-question-devastates-net-zero-pipe-dreams/
Estimating power density is complex. Smil included plant area, storage yards, mining sites, agricultural fields, pipelines and transportation, and other associated land and sea areas in his analysis.
Smil’s work allows us to compare the energy density of electricity sources. If we set a nuclear plant to one unit of land required for one unit of electricity output, then a natural gas-powered plant requires about 0.8 units of land to produce one unit of output. A coal-fired plant uses about 1.4 units of land to deliver one unit of power.
But renewable sources require vastly more land. A standalone solar facility requires about 100 units of land to deliver the same average electricity output as a nuclear plant that uses one unit of land.
A wind facility uses about 35 units of land if only the concrete wind tower pads and service roads are counted, but over 800 units of land for the entire area spanned by a typical wind installation.
Production of electricity from biomass has the poorest energy density, requiring over 1,500 units of land to output one unit of electricity.
https://www.masterresource.org/smil-vaclav/smil-density-comparisons-v/
Power Source | Power Density (W/m2) | |
Low | High | |
Natural Gas | 200 | 2000 |
Coal | 100 | 1000 |
Solar (PV) | 4 | 9 |
Solar (CSP) | 4 | 10 |
Wind | 0.5 | 1.5 |
Biomass | 0.5 | 0.6 |
Mike Maguire
August 1, 2023 9:09 am
Wonderful article!
In addition, CO2 from fossil fuels and the increase in atmospheric levels by 130parts per million is increasing plants growth and world food production by around 26% via the key role this beneficial gas plays in photosynthesis.
All animals eat plants or something that ate plants.
Wind turbines, on the other hand are killing birds, bats and whales as well as insects…..in addition to destructive use of land. They last 2 decades then go into landfills.
The raw materials needed to make them, solar panels and batteries rips up another large area of the earth.
The authentic green energy sources are the ones that have been massively greening up the planet.
The Net-Zero plan is to replace that with diffuse, intermittent energy sources that help destroy the planet…..to save it!
The things that you can get people to believe ….when they want to believe in it are mind boggling. When they want to believe in something, they give it a free pass and don’t scrutinize or fact check.
DeathbyGreening:
https://www.marketforum.com/forum/topic/69258/
Regarding nuclear power generation. Agreed, it is the cleanest of them all. But in my life thus far, I can't tell you how many people I've encountered who are ignorant of just how safe it is. They can only think of the few 9and it is relatively few) reactor accidents that are regularly brought up during any discussion on the topic.
So let's address those in chronological order starting with the oldest. There are 3 reactor accidents/disasters people love to bring up: Chernobyl, Three mile Island, and Fukushima Daiichi (usually just referred to as "Fukushima").
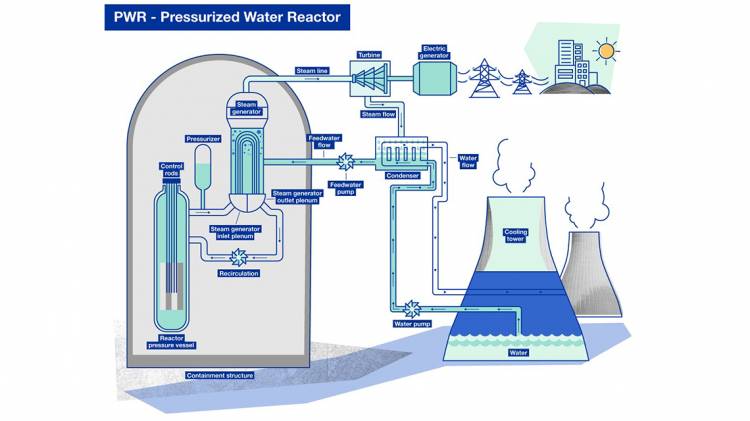
Three Mile Island - March 28, 1979 - Occurring before Chernobyl, this was the world's introduction to a reactor meltdown type event. But it was only a partial meltdown and it was contained (however, not before some amount of radioactive gas was released to the atmosphere). The event affected Unit 2 at the plant (the plant having 2 power generation units) and Unit 1 remained in operation all the way until it was decommissioned in 2019!
The reactors at Three Mile Island are of a Pressurized Water Reactor design (PWR), which is the most common reactor design in use across the world at this time.
Chernobyl - April 26, 1986 - Prior to the Fukushima reactor meltdown, this has meltdown has, without dispute, been considered the worst nuclear reactor accident in human history. This was the result of several mistakes, some of them of a political nature, but also partially because of the reactor design itself. This was a "graphite moderated" reactor which showed it's design weaknesses during the ensuing disaster.
According to this website: https://www.nei.org/resources/statistics/world-nuclear-power-plants-in-operation
There isn't a single "RBMK" graphite moderated reactor still in operation.
Fukushima Daiichi - March 11, 2011 - This meltdown is considered to be the worst nuclear disaster in human history (at this time, and hopefully it remains that way). Fukushima Daiichi was a plant consisting of 4 power generation units. The plant was compromised in the tsunami that occurred as a result of the Tohoku earthquake. Units 1, 3 and 4 suffered structural damage caused by a hydrogen-air explosion in the wake of the initial reactor damage. Unit 2 avoided such an explosion due to steam venting. All 4 units are inactive and there are cleanup efforts continuing to this day (it will likely take decades to complete the clean-up process provided another major natural disaster doesn't hit the facility site).
And there lies one of the major issues with this accident. The location of the plant itself. They built this plant right on the coast line, literally.
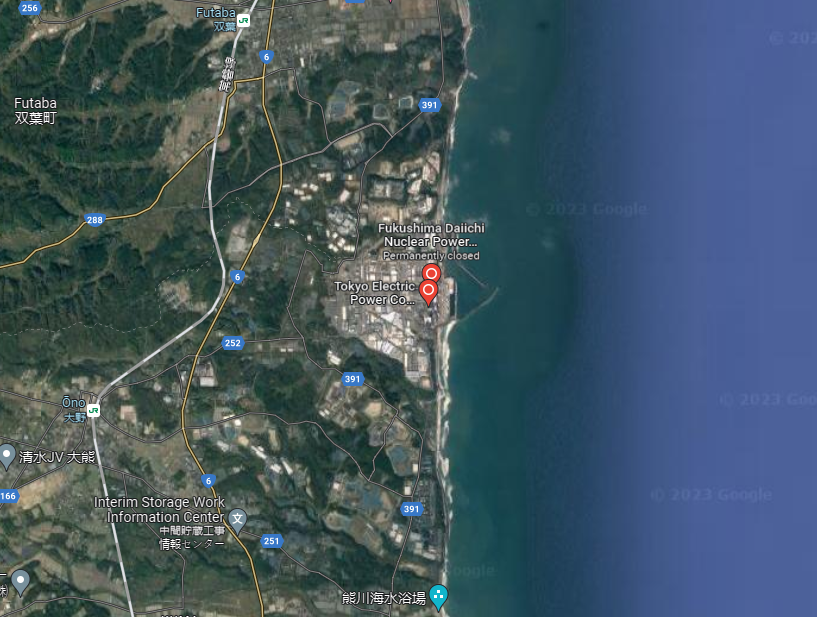
Now, building a nuclear plant near a coastline is not necessarily unheard of. As risky as it seems, as long as the area the plant is built in is not prone to major natural disasters (or is built to survive them), building next to a coastline has an advantage of ready access to cooling water.
But Japan is a country that sits ON the "ring of fire" and is highly prone to tectonic activity. Earthquakes are common there. My wife and I spent a week there back in 2016 when we were just dating and during that 1 week we experienced an earthquake. Not a very powerful one, but we happened to be up on one of the top levels of the Osaka Natural History Museum building when the earthquake hit and you could feel the building sway.
When the Tsunami hit the facility, it damaged everything, including the emergency backup systems.
In my opinion, this accident was at least partially the result of bad planning on the part of the plant designers and of the administration that approved it's construction at it's location. I'm not saying that Japan shouldn't have nuclear power plants, they have several others that are still in operation, but as a country, they need to be incredibly careful about WHERE they build a plant and HOW they build it. Take into consideration that the entire country experiences earthquakes and tsunamis.
Fun fact about the Tohoku earthquake. I was attending my local community college at the time and had a physics class during the semester this earthquake event occurred. The building that my physics class was in had a working seismometer in a plexiglass case on display in one of the public areas. You could just walk up and watch the paper drum rotate and the various needles move, if they moved at all. Most days they didn't, where this college is in California, there isn't much earthquake activity. However, the morning the Tohoku event occurred, the seismometer in the building registered it and not with small needle movements. It's amazing the shear power behind a major tectonic event, to send a shockwave across the ocean. It's approximately a 4,900 mile distance from the Tohoku region to Sacramento, California.
As a final note, look at this website specifically about US nuclear power plants and realize how useful they are in this country.
https://www.nei.org/resources/fact-sheets/u-s-nuclear-plants
Great post, MM!
Post of the week, in fact! (The competition isn't that great because we're an ANTI echo chamber).
You've actually convinced me with your recent posts to be a very strong advocate of nuclear energy going forward!
I didn't realize that we had so many nuclear power plants in our country. From you link:
https://www.nei.org/resources/fact-sheets/u-s-nuclear-plants
Another interesting note in the realm of nuclear energy. For decades there has existed a type of reactor known as a "breeder" reactor. These have been somewhat...controversial because they can be used to create weapons grade nuclear material at the same time they produce electrical energy. Partly because of their controversial nature, but also because of how much more complex they are than a typical PWR reactor, they've never really been built on a commercial scale.
That is, until recently.
So in a nutshell, a breeder reactor can take a mix of nuclear material, including material that is considered "spent" for a traditional PWR reactor, and keep using it to generate electricity. They are much more efficient than a PWR reactor. This is about the extent of my understanding of how they work. I once tried to look into the science, physics and mechanics behind their operation but I couldn't wrap my head around it.
From the limited history on breeder reactors that I know, they were seriously considered and researched in the "early" days of nuclear power plants because at the time, natural uranium was scarce. However, once new deposits of uranium were discovered and it was deemed more plentiful than originally assumed, research into breeder reactors was largely dropped as PWR reactors were simpler and cheaper to build.
Now, the interesting thing here is that there are (to the best of my current knowledge) 3 countries that are leading the way on trying to build commercially viable breeder reactors: Russia, China, and India.
And guess what countries currently don't subscribe to the "climate change" and "green energy/renewable revolution" narrative? Well China and Russia for sure, I'm not entirely clear on where India stands. But regardless, India has a population level 2nd only to China, but even that is projected to change within the next couple decades as China's population growth is expected to stagnate while India's population is expected to continue to grow. So India is going to need all the electrical power generation they can get, and they've realized they need to be investing in that starting now.
Russia is in the process of bringing an 800MW output rated breeder reactor online, and with the knowledge they learn from that project, they are planning to start construction of a 1300MW breeder reactor.
Wonderful discussion, MM!
I had to take all sort of classes to understand the driving forces and physical laws for fluids(atmosphere/oceans) that included thermodynamics and physical chemistry that had a prerequisite of 3 terms of calculus, 2 terms of engineering physics and 2 terms of engineering chemistry at the University of Michigan. I wasn't the greatest student but at one point, I had to understand how breeder reactors worked well enough to pass a test.
In reviewing it just now, it makes my head hurt. I'll pass on some basic info for others that want to make their head hurt too (-:
https://energyeducation.ca/encyclopedia/Breeder_reactor
Figure 1. The breeding of 239Pu in a breeder reactor. The neutrons are supplied by the decay of 235U, which transmute 238U to plutonium.[3]
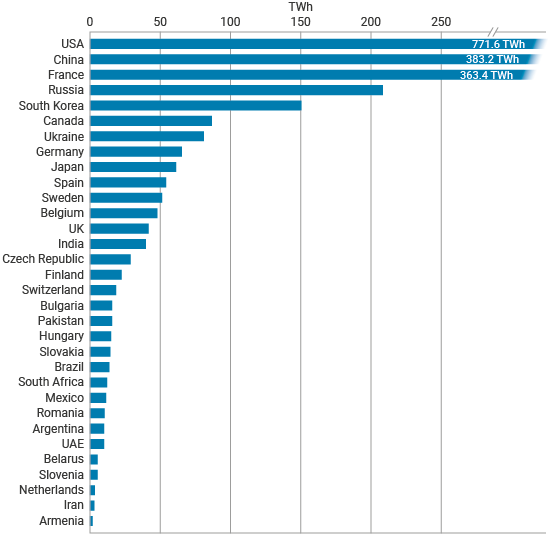
Figure 2. below. Liquid metal fast breeder reactor
+++++++++++++++++++
It really is incredible to think that we can release and harvest such incredible amounts of energy by splitting atoms. This is one of the most brilliant displays of how human intelligence can understand complex physical laws and exploit them to create something unimaginable, that almost seems like science fiction.
This might not make heads hurt as much (-:
https://www.iaea.org/newscenter/news/what-is-nuclear-energy-the-science-of-nuclear-power
While you were sleeping, MM, India passed up China to be the most populated country on the planet (-:
https://www.worldometers.info/world-population/population-by-country/
# | Country (or dependency) | Population (2023) | Yearly Change | Net Change | Density (P/Km²) | Land Area (Km²) | Migrants (net) | Fert. Rate | Med. Age | Urban Pop % | World Share |
---|---|---|---|---|---|---|---|---|---|---|---|
1 | India | 1,428,627,663 | 0.81 % | 11,454,490 | 481 | 2,973,190 | -486,136 | 2.0 | 28 | 36 % | 17.76 % |
2 | China | 1,425,671,352 | -0.02 % | -215,985 | 152 | 9,388,211 | -310,220 | 1.2 | 39 | 65 % | 17.72 % |
3 | United States | 339,996,563 | 0.50 % | 1,706,706 | 37 | 9,147,420 | 999,700 | 1.7 | 38 | 83 % | 4.23 % |
4 | Indonesia | 277,534,122 | 0.74 % | 2,032,783 | 153 | 1,811,570 | -49,997 | 2.1 | 30 | 59 % | 3.45 % |
5 | Pakistan | 240,485,658 | 1.98 % | 4,660,796 | 312 | 770,880 | -165,988 | 3.3 | 21 | 35 % | 2.99 % |
6 | Nigeria | 223,804,632 | 2.41 % | 5,263,420 | 246 | 910,770 | -59,996 | 5.1 | 17 | 54 % | 2.78 % |
7 | Brazil | 216,422,446 | 0.52 % | 1,108,948 | 26 | 8,358,140 | 6,000 | 1.6 | 34 | 88 % | 2.69 % |
8 | Bangladesh | 172,954,319 | 1.03 % | 1,767,947 | 1,329 | 130,170 | -309,977 | 1.9 | 27 | 41 % | 2.15 % |
9 | Russia | 144,444,359 | -0.19 % | -268,955 | 9 | 16,376,870 | -136,414 | 1.5 | 39 | 75 % | 1.80 % |
10 | Mexico | 128,455,567 | 0.75 % | 951,442 | 66 | 1,943,950 | -50,239 | 1.8 | 30 | 88 % | 1.60 % |
11 | Ethiopia | 126,527,060 | 2.55 % | 3,147,136 | 127 | 1,000,000 | -11,999 | 4.0 | 19 | 22 % | 1.57 % |
12 | Japan | 123,294,513 | -0.53 % | -657,179 | 338 | 364,555 | 99,994 | 1.3 | 49 | 94 % | 1.53 % |
13 | Philippines | 117,337,368 | 1.54 % | 1,778,359 | 394 | 298,170 | -69,996 | 2.7 | 25 | 47 % | 1.46 % |
14 | Egypt | 112,716,598 | 1.56 % | 1,726,495 | 113 | 995,450 | -29,998 | 2.8 | 24 | 41 % | 1.40 % |
15 | DR Congo | 102,262,808 | 3.29 % | 3,252,596 | 45 | 2,267,050 | -14,999 | 6.1 | 16 | 46 % | 1.27 % |
16 | Vietnam | 98,858,950 | 0.68 % | 672,094 | 319 | 310,070 | -82,700 | 1.9 | 33 | 40 % | 1.23 % |
17 | Iran | 89,172,767 | 0.70 % | 622,197 | 55 | 1,628,550 | -39,998 | 1.7 | 33 | 74 % | 1.11 % |
18 | Turkey | 85,816,199 | 0.56 % | 474,958 | 112 | 769,630 | -318,067 | 1.9 | 32 | 77 % | 1.07 % |
19 | Germany | 83,294,633 | -0.09 % | -75,210 | 239 | 348,560 | 155,751 | 1.5 | 45 | 77 % | 1.04 % |
20 | Thailand | 71,801,279 | 0.15 % | 104,249 | 141 | 510,890 | 18,999 | 1.3 | 40 | 52 % | 0.89 % |
21 | United Kingdom | 67,736,802 | 0.34 % | 227,866 | 280 | 241,930 | 165,790 | 1.6 | 40 | 85 % | 0.84 % |
22 | Tanzania | 67,438,106 | 2.96 % | 1,940,358 | 76 | 885,800 | -39,997 | 4.6 | 17 | 38 % | 0.84 % |
23 | France | 64,756,584 | 0.20 % | 129,956 | 118 | 547,557 | 67,761 | 1.8 | 42 | 84 % | 0.80 % |
24 | South Africa | 60,414,495 | 0.87 % | 520,610 | 50 | 1,213,090 | 58,496 | 2.3 | 28 | 69 % | 0.75 % |
25 | Italy | 58,870,762 | -0.28 % | -166,712 | 200 | 294,140 | 58,496 | 1.3 | 48 | 72 % | 0.73 % |
26 | Kenya | 55,100,586 | 1.99 % | 1,073,099 | 97 | 569,140 | -10,000 | 3.2 | 20 | 31 % | 0.68 % |
27 | Myanmar | 54,577,997 | 0.74 % | 398,691 | 84 | 653,290 | -34,998 | 2.1 | 30 | 33 % | 0.68 % |
28 | Colombia | 52,085,168 | 0.41 % | 211,144 | 47 | 1,109,500 | -175,051 | 1.7 | 32 | 81 % | 0.65 % |
29 | South Korea | 51,784,059 | -0.06 % | -31,751 | 533 | 97,230 | 29,998 | 0.9 | 44 | 82 % | 0.64 % |
30 | Uganda | 48,582,334 | 2.82 % | 1,332,749 | 243 | 199,810 | -126,181 | 4.4 | 16 | 29 % | 0.60 % |
31 | Sudan | 48,109,006 | 2.63 % | 1,234,802 | 27 | 1,765,048 | -9,999 | 4.3 | 19 | 35 % | 0.60 % |
32 | Spain | 47,519,628 | -0.08 % | -39,002 | 95 | 498,800 | 39,998 | 1.3 | 45 | 80 % | 0.59 % |
33 | Argentina | 45,773,884 | 0.58 % | 263,566 | 17 | 2,736,690 | 3,718 | 1.9 | 32 | 94 % | 0.57 % |
34 | Algeria | 45,606,480 | 1.57 % | 703,255 | 19 | 2,381,740 | -9,999 | 2.8 | 28 | 75 % | 0.57 % |
35 | Iraq | 45,504,560 | 2.27 % | 1,008,438 | 105 | 434,320 | -6,000 | 3.4 | 20 | 71 % | 0.57 % |
36 | Afghanistan | 42,239,854 | 2.70 % | 1,111,083 | 65 | 652,860 | -65,846 | 4.4 | 17 | 26 % | 0.53 % |
37 | Poland | 41,026,067 | 2.93 % | 1,168,922 | 134 | 306,230 | -910,475 | 1.5 | 40 | 55 % | 0.51 % |
38 | Canada | 38,781,291 | 0.85 % | 326,964 | 4 | 9,093,510 | 249,746 | 1.5 | 41 | 81 % | 0.48 % |
39 | Morocco | 37,840,044 | 1.02 % | 382,073 | 85 | 446,300 | -39,998 | 2.3 | 29 | 66 % | 0.47 % |
40 | Saudi Arabia | 36,947,025 | 1.48 % | 538,205 | 17 | 2,149,690 | 28,998 | 2.4 | 31 | 83 % | 0.46 % |
41 | Ukraine | 36,744,634 | -7.45 % | -2,957,105 | 63 | 579,320 | 1,784,718 | 1.3 | 45 | 82 % | 0.46 % |
42 | Angola | 36,684,202 | 3.08 % | 1,095,215 | 29 | 1,246,700 | -1,000 | 5.1 | 16 | 68 % | 0.46 % |
43 | Uzbekistan | 35,163,944 | 1.55 % | 536,292 | 83 | 425,400 | -19,999 | 2.8 | 27 | 49 % | 0.44 % |
44 | Yemen | 34,449,825 | 2.24 % | 753,211 | 65 | 527,970 | -29,914 | 3.6 | 19 | 37 % | 0.43 % |
45 | Peru | 34,352,719 | 0.89 % | 303,131 | 27 | 1,280,000 | -61,442 | 2.1 | 29 | 79 % | 0.43 % |
46 | Malaysia | 34,308,525 | 1.09 % | 370,304 | 104 | 328,550 | 48,997 | 1.8 | 31 | 78 % | 0.43 % |
47 | Ghana | 34,121,985 | 1.93 % | 646,115 | 150 | 227,540 | -9,999 | 3.5 | 21 | 57 % | 0.42 % |
48 | Mozambique | 33,897,354 | 2.81 % | 927,836 | 43 | 786,380 | -5,000 | 4.5 | 17 | 40 % | 0.42 % |
49 | Nepal | 30,896,590 | 1.14 % | 349,010 | 216 | 143,350 | -62,012 | 2.0 | 24 | 22 % | 0.38 % |
50 | Madagascar | 30,325,732 | 2.41 % | 714,018 | 52 | 581,795 | -1,500 | 3.7 | 19 | 40 % | 0.38 % |
51 | Côte d'Ivoire | 28,873,034 | 2.53 % | 712,492 | 91 | 318,000 | 6,000 | 4.3 | 18 | 52 % | 0.36 % |
52 | Venezuela | 28,838,499 | 1.90 % | 536,803 | 33 | 882,050 | 321,106 | 2.2 | 28 | N.A. | 0.36 % |
53 | Cameroon | 28,647,293 | 2.63 % | 732,757 | 61 | 472,710 | -4,800 | 4.3 | 18 | 58 % | 0.36 % |
54 | Niger | 27,202,843 | 3.80 % | 994,866 | 21 | 1,266,700 | 1,000 | 6.7 | 15 | 17 % | 0.34 % |
55 | Australia | 26,439,111 | 1.00 % | 261,698 | 3 | 7,682,300 | 139,991 | 1.6 | 38 | 86 % | 0.33 % |
56 | North Korea | 26,160,821 | 0.35 % | 91,405 | 217 | 120,410 | -2,000 | 1.8 | 36 | 63 % | 0.33 % |
57 | Taiwan | 23,923,276 | 0.13 % | 29,882 | 676 | 35,410 | 23,999 | 1.2 | 42 | 80 % | 0.30 % |
58 | Mali | 23,293,698 | 3.10 % | 700,108 | 19 | 1,220,190 | -39,998 | 5.8 | 15 | 44 % | 0.29 % |
59 | Burkina Faso | 23,251,485 | 2.55 % | 577,723 | 85 | 273,600 | -24,998 | 4.6 | 17 | 32 % | 0.29 % |
60 | Syria | 23,227,014 | 4.98 % | 1,101,765 | 126 | 183,630 | 757,103 | 2.7 | 22 | 53 % | 0.29 % |
61 | Sri Lanka | 21,893,579 | 0.28 % | 61,436 | 349 | 62,710 | -77,495 | 2.0 | 33 | 19 % | 0.27 % |
62 | Malawi | 20,931,751 | 2.58 % | 526,434 | 222 | 94,280 | -6,000 | 3.8 | 17 | 19 % | 0.26 % |
63 | Zambia | 20,569,737 | 2.76 % | 552,062 | 28 | 743,390 | -5,000 | 4.2 | 17 | 46 % | 0.26 % |
64 | Romania | 19,892,812 | 1.19 % | 233,545 | 86 | 230,170 | -254,616 | 1.7 | 41 | 53 % | 0.25 % |
65 | Chile | 19,629,590 | 0.13 % | 25,857 | 26 | 743,532 | -71,205 | 1.5 | 36 | 85 % | 0.24 % |
66 | Kazakhstan | 19,606,633 | 1.08 % | 208,635 | 7 | 2,699,700 | 0 | 3.0 | 30 | 57 % | 0.24 % |
67 | Chad | 18,278,568 | 3.13 % | 555,253 | 15 | 1,259,200 | -2,000 | 6.1 | 15 | 24 % | 0.23 % |
68 | Ecuador | 18,190,484 | 1.05 % | 189,484 | 73 | 248,360 | -21,525 | 2.0 | 28 | 64 % | 0.23 % |
69 | Somalia | 18,143,378 | 3.10 % | 545,867 | 29 | 627,340 | -30,000 | 6.1 | 15 | 46 % | 0.23 % |
70 | Guatemala | 18,092,026 | 1.39 % | 248,118 | 169 | 107,160 | -9,110 | 2.3 | 23 | 55 % | 0.22 % |
71 | Senegal | 17,763,163 | 2.58 % | 446,714 | 92 | 192,530 | -19,999 | 4.3 | 18 | 52 % | 0.22 % |
72 | Netherlands | 17,618,299 | 0.31 % | 54,285 | 522 | 33,720 | 29,998 | 1.6 | 42 | 92 % | 0.22 % |
73 | Cambodia | 16,944,826 | 1.06 % | 176,984 | 96 | 176,520 | -29,998 | 2.3 | 27 | 26 % | 0.21 % |
74 | Zimbabwe | 16,665,409 | 2.11 % | 344,872 | 43 | 386,850 | -9,999 | 3.4 | 18 | 37 % | 0.21 % |
75 | Guinea | 14,190,612 | 2.39 % | 331,271 | 58 | 245,720 | -4,000 | 4.2 | 18 | 40 % | 0.18 % |
76 | Rwanda | 14,094,683 | 2.31 % | 317,985 | 571 | 24,670 | -8,999 | 3.7 | 19 | 18 % | 0.18 % |
77 | Benin | 13,712,828 | 2.70 % | 359,964 | 122 | 112,760 | -200 | 4.8 | 18 | 48 % | 0.17 % |
78 | Burundi | 13,238,559 | 2.71 % | 348,983 | 516 | 25,680 | 2,000 | 4.9 | 16 | 15 % | 0.16 % |
79 | Tunisia | 12,458,223 | 0.83 % | 102,106 | 80 | 155,360 | -4,000 | 2.0 | 32 | 69 % | 0.15 % |
80 | Bolivia | 12,388,571 | 1.35 % | 164,461 | 11 | 1,083,300 | -3,000 | 2.5 | 24 | 69 % | 0.15 % |
81 | Haiti | 11,724,763 | 1.21 % | 139,767 | 425 | 27,560 | -31,811 | 2.7 | 23 | 60 % | 0.15 % |
82 | Belgium | 11,686,140 | 0.26 % | 30,210 | 386 | 30,280 | 23,999 | 1.6 | 41 | 99 % | 0.15 % |
83 | Jordan | 11,337,052 | 0.45 % | 51,183 | 128 | 88,780 | -157,392 | 2.7 | 24 | 85 % | 0.14 % |
84 | Dominican Republic | 11,332,972 | 0.93 % | 104,151 | 235 | 48,320 | -29,099 | 2.2 | 28 | 85 % | 0.14 % |
85 | Cuba | 11,194,449 | -0.16 % | -17,742 | 105 | 106,440 | -6,000 | 1.5 | 41 | 80 % | 0.14 % |
86 | South Sudan | 11,088,796 | 1.61 % | 175,632 | 18 | 610,952 | -23,291 | 4.3 | 17 | 28 % | 0.14 % |
87 | Sweden | 10,612,086 | 0.59 % | 62,739 | 26 | 410,340 | 39,998 | 1.7 | 40 | 86 % | 0.13 % |
88 | Honduras | 10,593,798 | 1.54 % | 160,938 | 95 | 111,890 | -5,034 | 2.3 | 24 | 58 % | 0.13 % |
89 | Czech Republic (Czechia) | 10,495,295 | 0.01 % | 1,309 | 136 | 77,240 | 22,011 | 1.7 | 43 | 75 % | 0.13 % |
90 | Azerbaijan | 10,412,651 | 0.53 % | 54,577 | 126 | 82,658 | 0 | 1.7 | 32 | 57 % | 0.13 % |
91 | Greece | 10,341,277 | -0.42 % | -43,694 | 80 | 128,900 | 5,000 | 1.4 | 45 | 86 % | 0.13 % |
92 | Papua New Guinea | 10,329,931 | 1.85 % | 187,312 | 23 | 452,860 | -800 | 3.1 | 22 | 12 % | 0.13 % |
93 | Portugal | 10,247,605 | -0.23 % | -23,260 | 112 | 91,590 | 9,999 | 1.4 | 46 | 67 % | 0.13 % |
94 | Hungary | 10,156,239 | 1.90 % | 188,931 | 112 | 90,530 | -156,677 | 1.6 | 42 | 68 % | 0.13 % |
95 | Tajikistan | 10,143,543 | 1.92 % | 190,756 | 72 | 139,960 | -19,999 | 3.1 | 22 | 28 % | 0.13 % |
96 | United Arab Emirates | 9,516,871 | 0.80 % | 75,742 | 114 | 83,600 | 0 | 1.4 | 34 | 94 % | 0.12 % |
97 | Belarus | 9,498,238 | -0.39 % | -36,716 | 47 | 202,910 | -4,282 | 1.5 | 41 | 80 % | 0.12 % |
98 | Israel | 9,174,520 | 1.51 % | 136,211 | 424 | 21,640 | 9,999 | 2.9 | 29 | 92 % | 0.11 % |
99 | Togo | 9,053,799 | 2.32 % | 205,100 | 166 | 54,390 | -2,000 | 4.1 | 19 | 44 % | 0.11 % |
100 | Austria | 8,958,960 | 0.22 % | 19,343 | 109 | 82,409 | 19,999 | 1.5 | 43 | 59 % | 0.11 % |
101 | Switzerland | 8,796,669 | 0.64 % | 56,197 | 223 | 39,516 | 39,998 | 1.5 | 42 | 75 % | 0.11 % |
https://www.statista.com/statistics/513671/number-of-under-construction-nuclear-reactors-worldwide/
Well, I did not know that India had officially passed up China for total population. Thanks for that nugget of information.
Now, think about how many billions of dollars have been spent on chasing nuclear fusion power and so far none of those projects have come close to bearing fruit, despite decades of predictions and promises.
Now spend those same billions on researching and further developing breeder reactors and think where we could be as a country or even the globe in terms of cheap, reliable, plentiful energy?
Nuclear weapon designs are physical, chemical, and engineering arrangements that cause the physics package[1] of a nuclear weapon to detonate. There are three existing basic design types:
https://nypost.com/2023/08/02/americans-will-go-broke-if-zero-carbon-pols-get-their-way/
There are hundreds of awesome articles here, many with solid facts supporting nuclear energy: