KEY EVENTS TO WATCH FOR:
Tuesday, May 9, 2023
6:00 AM ET. April NFIB Index of Small Business Optimism
Small Business Idx (previous 90.1)
8:55 AM ET. Johnson Redbook Retail Sales Index
Ret Sales Mo-to-Date, Y/Y% (previous +1.4%)
Latest Wk, Y/Y% (previous +1.3%)
10:00 AM ET. May IBD/TIPP Economic Optimism Index
Economic Optimism Idx (previous 47.4)
6-Mo Economic Outlook (previous 41.6)
4:30 PM ET. API Weekly Statistical Bulletin
Crude Stocks, Net Chg (Bbls) (previous -3.9M)
Gasoline Stocks, Net Chg (Bbls) (previous +0.4M)
Distillate Stocks, Net Chg (Bbls) (previous -1.0M)
Wednesday, May 10, 2023
7:00 AM ET. MBA Weekly Mortgage Applications Survey
Composite Idx (previous 214.4)
Composite Idx, W/W% (previous -1.2%)
Purchase Idx-SA (previous 165.8)
Purchase Idx-SA, W/W% (previous -2.0%)
Refinance Idx (previous 461.2)
Refinance Idx, W/W% (previous +0.8%)
8:30 AM ET. April Real Earnings
8:30 AM ET. April CPI
CPI, M/M% (previous +0.1%)
Core CPI, M/M% (previous +0.4%)
Energy Idx, M/M% (previous -3.5%)
Food Idx, M/M% (previous +0.0%)
Real Avg Wkly Pay-Inflation Adj, M/M% (previous -0.1%)
CPI, Y/Y% (previous +5.0%)
Core Annual, Y/Y% (previous +5.6%)
10:00 AM ET. April Online Help Wanted Index
10:30 AM ET. EIA Weekly Petroleum Status Report
Crude Oil Stocks (Bbl) (previous 459.633M)
Crude Oil Stocks, Net Chg (Bbl) (previous -1.281M)
Gasoline Stocks (Bbl) (previous 222.878M)
Gasoline Stocks, Net Chg (Bbl) (previous +1.742M)
Distillate Stocks (Bbl) (previous 110.323M)
Distillate Stocks, Net Chg (Bbl) (previous -1.19M)
Refinery Usage (previous 90.7%)
Total Prod Supplied (Bbl/day) (previous 19.805M)
Total Prod Supplied, Net Chg (Bbl/day) (previous -0.403M)
Thursday, May 11, 2023
8:30 AM ET. Unemployment Insurance Weekly Claims Report - Initial Claims
Jobless Claims (previous 242K)
Jobless Claims, Net Chg (previous +13K)
Continuing Claims (previous 1805000)
Continuing Claims, Net Chg (previous -38K)
8:30 AM ET. April PPI
PPI, M/M% (previous -0.5%)
Ex-Food & Energy PPI, M/M% (previous -0.1%)
Personal Consumption (previous -0.4%)
8:30 AM ET. U.S. Weekly Export Sales
10:30 AM ET. EIA Weekly Natural Gas Storage Report
Working Gas In Storage (Cbf) (previous 2063B)
Working Gas In Storage, Net Chg (Cbf) (previous +54B)
4:30 PM ET. Foreign Central Bank Holdings
4:30 PM ET. Federal Discount Window Borrowings
Friday, May 12, 2023
8:30 AM ET. April Import & Export Price Indexes
Import Prices (previous -0.6%)
Non-Petroleum Prices (previous -0.6%)
Petroleum Prices (previous -1.2%)
10:00 AM ET. May University of Michigan Survey of Consumers - preliminary
Mid-Mo Sentiment (previous 63.5)
Mid-Mo Expectations (previous 60.3)
Mid-Mo Current Idx (previous 68.6)
12:00 PM ET. World Agricultural Supply & Demand Estimates (WASDE)
Corn, End Stocks (Bushels)
Soybeans, End Stocks (Bushels)
Wheat, End Stocks (Bushels)
Cotton, End Stocks (Bales)
The STOCK INDEXES? http://quotes.ino.com/ex?changes/?c=indexes
The Dow closed lower on Monday as it consolidated some of last-Friday's rally.Today's mid-range close sets the stage for a steady to lower opening when Tuesday's day session begins trading. Stochastics and the RSI are turning neutral to bullish signaling that sideways to higher prices are possible near-term. Closes above the 20-day moving average crossing at 33,746.18 would signal that a short-term low has been posted. If the Dow extends the rally off last-Thursday's low, May's high crossing at 34,257.83 is the next upside target. First resistance is May's high crossing at 34,257.83. second resistance is February's high crossing at 33,572.22. First support is the 50-day moving average crossing at 33,102.82. Second support is last-Thursday's low crossing at 32,937.50.
The June NASDAQ 100 closed slightly higher on Monday. The high-range close sets the stage for a steady to higher opening when Tuesday's day session begins trading. Stochastics and the RSI have turned neutral to bullish signaling sideways to higher prices are possible. If June renews this year's rally, the 62% retracement level of the 2022-decline crossing at 13,634.24 is the next upside target. Closes below the April 13th low crossing at 12,925.50 would open the door for a possible test of the 50-day moving average crossing at 12,841.50. First resistance is the April 4th high crossing at 13,370.25. Second resistance is the 62% retracement level of the 2022-decline crossing at 13,634.24. First support is the April 13th low crossing at 12,925.50. Second support is the 50-day moving average crossing at 12,841.48.
The June S&P 500 closed slightly higher on Monday. The high-range close sets the stage for a steady to slightly higher opening when Tuesday's day session begins trading. Stochastics and the RSI are turning neutral to bullish signaling that sideways to higher prices are possible near-term. If June extends the rally off March's low, the February 14th high crossing at 4223.00 is the next upside target. Closes below the 50-day moving average crossing at 4073.80 would confirm that a short-term top has been posted. First resistance is last-Monday's high crossing at 4206.25. Second resistance is the February 14th high crossing at 4223.00. First support is the 50-day moving average crossing at 4073.80. Second support is the 38% retracement level of the 2022-2023 rally crossing at 3904.06.
INTEREST RATES? http://quotes.ino.com/ex?changes/?c=interest ""
June T-bonds closed down 1-00/32's at 129-31.
June T-bonds closed lower on Monday. The low-range close sets the stage for a steady to lower opening when Tuesday's day session begins trading. Stochastics and the RSI are turning neutral to bearish signaling that sideways to lower prices are possible near-term. Closes below the May 1st low crossing at 129-02 would mark a downside breakout of the March-April trading range while opening the door for additional weakness near-term. Closes above last-Thursday's high crossing at 133-00 would signal that a short-term low has been posted. First resistance is last-Thursday's high crossing at 133-00. Second resistance is April's high crossing at 134-14. First support is May's low crossing at 129-02. Second support is the 38% retracement level of the October-January rally crossing at 128-08.
June T-notes closed down 175-pts. at 115.055.
June T-notes closed lower on Monday. The low-range close sets the stage for a steady to lower opening when Tuesday's day session begins trading. Stochastics and the RSI are turning neutral to bearish signaling that sideways to lower prices are possible near-term. If June extends the decline off April's high, the 50-day moving average crossing at 114.158 is the next downside target. Closes above March's high crossing at 117.015 would mark a potential upside breakout of the March-May trading range. First resistance is March's high crossing at 117.015. Second resistance is weekly resistance crossing at 120.310. First support is the 20-day moving average crossing at 115.050. Second support is the 50-day moving average crossing at 114.158.
ENERGY MARKETS? http://quotes.ino.com/ex?changes/?c=energy ""
June crude oil closed higher on Monday as it consolidated some of the decline off April's high. The high-range close sets the stage for a steady to higher opening when Tuesday's day session begins. Stochastics and the RSI are bullish signaling that sideways to higher prices are possible near-term. Closes above the 10-day moving average crossing at $73.18 would temper the near-term bearish outlook is possible near-term. Closes below last-Thursday's low crossing at $63.64 would renew the decline off April's high. First resistance is the 10-day moving average crossing at $73.18. Second resistance is the 50-day moving average crossing at $75.65.First support is last-Thursday's low crossing at $63.64. Second support is the 62% retracement level of the 2020-2022 rally crossing at $61.25.
June heating oil closed higher on Monday as it extended the rally off last-Thursday's low. The high-range close sets the stage for a steady to higher opening when Tuesday's day trading session begins. Stochastics and the RSI are bullish signaling that sideways to higher prices are possible near-term. Closes above the 20-day moving average crossing at $2.4553 would confirm that a short-term low has been posted. If June renews the decline off January's high, the 62% retracement level of the 2020-2022 rally crossing at 2.1217 is the next downside target. First resistance is the 20-day moving average crossing at $2.4553. Second resistance is the 50-day moving average crossing at $2.5463. First support is last-Thursday's low crossing at $2.1500. Second support is the 62% retracement level of the 2020-2022 rally crossing at 2.1217.
June unleaded gas closed sharply higher on Monday as it extends the rally off last-Thursday's low. The high-range close sets the stage for a steady to higher opening when Tuesday's day session begins trading. Stochastics and the RSI are oversold but are turning neutral to bullish signaling that sideways to higher prices are possible near-term. Closes above the 10-day moving average crossing at 2.4563 would signal that a short-term low has been posted. If June renews the decline off April's high, the 50% retracement level of the 2020-2022 rally crossing at 2.0663 is the next downside target. First resistance is the 10-day moving average crossing at 2.4563. Second resistance is the 50-day moving average crossing at 2.5844. First support is last-December's low crossing at 2.2483. Second support is the 50% retracement level of the March-April rally crossing at 2.0663.
June Henry natural gas closed higher on Monday. The high-range close sets the stage for a steady to higher opening when Tuesday's day session begins trading. Stochastics and the RSI are oversold but are turning neutral to bullish signaling that sideways to higher prices are possible near-term. Closes above the 20-day moving average crossing at 2.323 would signal that a short-term low has been posted. If June renews the decline off March's high, monthly support crossing at 1.795 is the next downside target.First resistance is the 20-day moving average crossing at 2.323. Second resistance is the 50-day moving average crossing at 2.552. First support is last-Friday's low crossing at 2.031. Second support is the September-2020 low on the monthly continuation chart crossing at 1.795.
CURRENCIES? http://quotes.ino.com/ex?changes/?c=currencies ""
The June Dollar closed higher on Monday as it the April-May trading range. The high-range close sets the stage for a steady to higher opening when Tuesday's session begins trading. Stochastics and the RSI are neutral to bearish signaling that sideways to lower prices are possible near-term. If June renews the decline off March's high, February's low crossing at $100.345 is the next downside target. Closes above the 50-day moving average crossing at 102.449 would confirm that a short-term low has been posted. First resistance is the 50-day moving average crossing at 102.449. Second resistance is the 25% retracement level of the September-February decline crossing at $103.586. First support is the April 14th low crossing at 100.420. Second support is February's low crossing at 100.345.
The June Euro closed lower on Monday. The low-range close sets the stage for a steady to lower opening when Tuesday's day session begins trading. Stochastics and the RSI are turning neutral to bearish signaling that sideways to lower prices is possible near-term. Closes below last-Tuesday's low crossing at $1.09720 would signal that a short-term top has been posted. If June renews the rally off March's low, the 38% retracement level of the 2018-2022 decline crossing at $1.12051 is the next upside target. First resistance is the April 14th high crossing at 1.11145. Second resistance is the 38% retracement level of the 2018-2022 decline crossing at $1.12051. First support is last-Tuesday's low crossing at 1.09720. Second support is the 50-day moving average crossing at $1.08961.
The June British Pound closed slightly lower on Monday. The low-range close sets the stage for a steady to slightly higher opening when Tuesday's day session begins trading. Stochastics and the RSI are overbought but remain neutral to bullish signaling sideways to higher prices are possible near-term. If June renews the rally off March's low, the 62% retracement level of the 2021-2022 decline crossing at 1.2784 is the next upside target. Closes below the 20-day moving average crossing at 1.2501 would signal that a short-term top has been posted. First resistance is today's high crossing at 1.2682. Second resistance is the 62% retracement level of the 2021-2022 decline crossing at 1.2784. First support is the 20-day moving average crossing at 1.2501. Second support is the 50-day moving average crossing at 1.2336.
The June Swiss Franc closed slightly higher on Monday. The low-range close sets the stage for a steady to slightly higher opening when Tuesday's day session begins trading. However, stochastics and the RSI have turned neutral to bearish signaling that sideways to lower prices are possible near-term. Closes below last-Tuesday's low crossing at 1.11770 would signal that a short-term top has been posted. If June renews the rally off March's low, the 87% retracement level of the 2021-2022 decline crossing at 1.15040 is the next upside target. First resistance is last-Thursday's high crossing at 1.13940. Second resistance is the 87% retracement level of the 2021-2022 decline crossing at 1.15040. First support is last-Tuesday's low crossing at 1.11770. Second support is the 50-day moving average crossing at 1.10779.
The June Canadian Dollar closed slightly lower on Monday. The low-range close sets the stage for a steady to slightly lower opening when Tuesday's day session begins trading. Stochastics and the RSI are neutral to bullish signaling that sideways to higher prices are possible near-term. If June extends the rally off April's low, April's high crossing at 75.27 is the next upside target. Today's close below the 50-day moving average crossing at 73.74 would signal that a short-term top has been posted. First resistance is April's high crossing at 75.27. Second resistance is February's high crossing at 75.49. First support is the 20-day moving average crossing at 74.19. Second support is the 50-day moving average crossing at 73.74.
The June Japanese Yen closed slightly lower on Monday. The low-range close sets the stage for a steady to lower opening when Tuesday’s day session begins trading. Stochastics and the RSI remain neutral to bullish signaling that sideways to higher prices are possible near-term. Closes above the 50-day moving average crossing at 0.075570 would signal that a short-term low has been posted. If June extends the decline off March's high, the 62% retracement level of the October-January rally crossing at 0.072908 is the next downside target. First resistance is the 50-day moving average crossing at 0.075570. Second resistance is the April 13th high crossing at 0.076475. First support is last-Tuesday's low crossing at 0.073055. Second support is the 62% retracement level of the October-January rally crossing at 0.072908.
PRECIOUS METALS? http://quotes.ino.com/ex?changes/?c=metals ""
June gold posted an inside day with a higher close on Monday. The mid-range close sets the stage for a steady to higher opening when Tuesday's day session begins trading. Stochastics and the RSI are neutral to bearish signaling that sideways to lower prices are possible near-term. Closes below the April 19th low crossing at $1980.90 would confirm that a short-term top has been posted while opening the door for a possible test of the 50-day moving average crossing at $1971.90. If April renews the rally off February's low, the March-2022 high crossing at $2097.20 is the next upside target. First resistance is last-Thursday's high crossing at $2085.40. Second resistance is the March-2022 high crossing at $2097.20. First support is the April 19th low crossing at $1980.90. Second support is the 50-day moving average crossing at 1971.90.
July silver closed slightly lower on Monday. The low-range close sets the stage for a steady to lower opening when Tuesday's day session begins trading. Stochastics and the RSI are overbought but remain neutral to bullish signaling that sideways to higher prices are possible near-term. If July extends the rally off March's low, the April-2022 high crossing at 26.880 is the next upside target. Closes below the 10-day moving average crossing at 25.510 would signal that a short-term top has been posted. First resistance is the March-2022's high crossing at 26.880. Second resistance is the 75% retracement level of 2022's decline crossing at 27.525. First support is the 10-day moving average crossing at 25.510. Second support is the April 25th low crossing at 24.735.
July copper closed higher on Monday. The mid-range close sets the stage for a steady to higher opening when Tuesday's day session begins trading. Stochastics and the RSI are turning neutral to bullish signaling that sideways to lower prices are possible near-term. Closes below April's low crossing at 3.8165 would renew the decline off April's high. If July renews the rally off April's low, the 50-day moving average crossing at 4.0069 is the next upside target. First resistance is the 50-day moving average crossing at 4.0069. Second resistance is April's high crossing at 4.1865. First support is April's low crossing at 3.8165. Second support is the 50% retracement level of the 2022-2023 rally crossing at 3.7645.
GRAINS? http://quotes.ino.com/ex?changes/?c=grains "
July Corn closed unchanged at $5.96 1/2.
July corn closed unchanged on Monday. The low-range close sets the stage for a steady to lower opening when Tuesday's night session begins trading. Stochastics and the RSI are neutral to bullish signaling that sideways to higher prices are possible near-term. If July extends this month's decline, the November-2021 low crossing at $5.41 1/2 is the next downside target. Closes above the 50-day moving average crossing at $6.16 1/2 would signal that a short-term low has been posted. First resistance is the 20-day moving average crossing at $6.09 3/4. Second resistance is the 50-day moving average crossing at $6.16 1/2. First support is last-Wednesday's low crossing at $5.69 1/4. Second support is the November-2021 low crossing at $5.41 1/2.
July wheat closed down $0.06 1/4-cents at $6.54.
July wheat closed lower on Monday as it consolidated some of last-week's rally. The low-range close sets the stage for a steady to lower opening when Tuesday's day session begins trading. Stochastics and the RSI remain neutral to bullish signaling that sideways to higher prices are possible near-term. Closes above the 50-day moving average crossing at $6.86 1/2 would signal that a short-term low has been posted while opening the door for additional short-covering gains. If July renews the decline off February's high, the March-2021 low crossing at $5.71 is the next downside target. First resistance is the 20-day moving average crossing at $6.62. Second resistance is the 50-day moving average crossing at $6.86 1/2. First support is last-Wednesday's low crossing at $6.03 3/4. Second support is the March-2021 low crossing at $5.71.
July Kansas City Wheat closed up $0.11 1/4-cents at $8.44 1/4.
July Kansas City wheat closed higher for the fourth-day in a row on Monday. The mid-range close sets the stage for a steady to higher opening when Tuesday's day session begins trading. Stochastics and the RSI remain neutral to bullish signaling that sideways to higher prices are possible near-term. If July extends last-week's rally, April's high crossing at $8.86 is the next upside target. Closes below the 10-day moving average crossing at $7.88 1/2 would signal that a short-term top has been posted. First resistance is April's high crossing at $8.86. Second resistance is February's high crossing at $8.94 1/4. First support is the 50-day moving average crossing at $8.19 1/2. Second support is the 10-day moving average crossing at $7.88 1/2.
July Minneapolis wheat closed up $0.07 3/4-cents crossing at $8.43 3/4.
July Minneapolis wheat closed higher on Monday as it extended the rally off last-Wednesday's low. The mid-range close sets the stage for a steady to higher opening when Tuesday's day session begins trading. Stochastics and the RSI remain bullish signaling that sideways to higher prices are possible near-term. Closes above the 50-day moving average crossing at $8.50 1/2 would open the door for additional gains near-term. Closes below the 10-day moving average crossing at $8.09 3/4 would signal that a short-term top has been posted. First resistance is the April 18th high crossing at $8.95 1/4. Second resistance is April's high crossing at $9.13 1/2. First support is the 10-day moving average crossing at $8.09 3/4. Second support is May's low crossing at $8.69.
SOYBEAN COMPLEX? http://quotes.ino.com/ex?changes/?c=grains "
July soybeans closed down $0.02 3/4-cents at $14.33 3/4.
July soybeans closed lower on Monday. The low-range close sets the stage for a steady to lower opening when Tuesday's day trade begins. Stochastics and the RSI are neutral to bullish signaling that sideways to higher prices are possible near-term. If July extends the ally off last-Wednesday's low, the 50-day moving average crossing at $14.60 it the next upside target. Closes below the 10-day moving average crossing at $14.19 3/4 would temper the near-term friendly outlook.First resistance is the 50-day moving average crossing at $14.60. Second resistance is April's high crossing at $15.01. First support is the 87% retracement level of the March-April rally crossing at $13.98 3/4. Second support is March's low crossing at $13.83 3/4.
July soybean meal closed up $0.80 at $426.90.
July soybean meal closed slightly higher on Monday. The mid-range close sets the stage for a steady to higher opening when Tuesday's day session begins trading. Stochastics and the RSI are oversold but remain bearish signaling that sideways to lower prices are possible near-term. If July extends this month's decline, the 38% retracement level of the 2020-2023 rally crossing at $411.90 is the next downside target. Closes above the 20-day moving average crossing at $441.00 would signal that a short-term low has been posted. First resistance is the 20-day moving average crossing at $4.41. Second resistance is the 50-day moving average crossing at $452.70. First support is last-Thursday's low crossing at $418.00. Second support is the 38% retracement level of the 2020-2023 rally crossing at $411.90.
July soybean oil closed down 68-pts. at 53.65.
July soybean oil closed lower on Monday. The low-range close sets the stage for a steady to lower opening when Tuesday's day session begins trading. Stochastics and the RSI are neutral to bullish signaling that sideways to higher prices are possible near-term. If July extends the rally off April's low, the 50-day moving average crossing at 55.47 is the next upside target. Closes below the 10-day moving average crossing at 52.38 would temper the friendly outlook. First resistance is the 50-day moving average crossing at 55.47. Second resistance is the April 18th high crossing at 56.21. First support is April's low crossing at 50.57. Second support is the 62% retracement level of the 2020-2022 rally crossing at 46.42.
LIVESTOCKhttp://quotes.ino.com/exchanges/?c=livestock
June hogs closed down $0.50 at $83.28.
June hogs closed lower on Monday. The low-range close sets the stage for a steady to lower opening when Tuesday's day session begins trading. Stochastics and the RSI are oversold but remain neutral to bearish signaling that sideways to lower prices are possible near-term. If June extends this year's decline, weekly support on the continuation chart crossing at $80.99 is the next downside target. Closes above the 10-day moving average crossing at $88.10 would signal that a short-term low has been posted. First resistance is the 10-day moving average crossing at $88.10. Second resistance is the April 28th high crossing at $92.00. First support is today's low crossing at $83.03. Second support is weekly support on the continuation chart crossing at $80.99.
June cattle closed up $0.65 at $162.58.
June cattle closed higher on Monday. The high-range close sets the stage for a steady to higher opening on Tuesday. Stochastics and the RSI are oversold but remain neutral to bearish signaling that sideways to lower prices are possible near-term. Closes below the 50-day moving average crossing at $161.15 would open the door for additional weakness near-term. Closes above the 20-day moving average crossing at $163.95 would signal that a low has been posted. First resistance is the 20-day moving average crossing at $163.95. Second resistance is April's high crossing at $166.28. First support is the 50-day moving average crossing at $161.15. Second support is the 50% retracement level of the March-April rally crossing at $160.33.
August Feeder cattle closed up $1.93 at $223.35.
August Feeder cattle closed higher on Monday. The high-range close sets the stage for a steady to higher opening when Tuesday's day session begins trading. Stochastics and the RSI are oversold but remain neutral to bearish signaling that sideways to lower prices are possible near-term. If August extends the decline off April's high, the 50-day moving average crossing at $220.81 is the next downside target. Closes above the 10-day moving average crossing at $227.05 would signal that a short-term low has been posted First resistance is the 10-day moving average crossing at $227.05. Second resistance is the April high crossing at $232.23. First support is the 50-day moving average crossing at $220.81. Second support is the 38% retracement level of the 2022-2023 rally crossing at $217.59.
FOOD & FIBERhttp://quotes.ino.com/ex changes/?c=food
July coffee closed lower on Monday as it extends last-week's trading range. The low-range close sets the stage for a steady to lower opening on Tuesday. Stochastics and the RSI are oversold but remain neutral to bearish signaling sideways to lower prices are possible near-term. Closes below the 50-day moving average crossing at $18.25 would open the door for additional weakness near-term. Closes above the 20-day moving average crossing at $19.05 would signal that a short-term low has been posted. First resistance is the 20-day moving average crossing at $19.05. Second resistance is April's high crossing at $20.49. First support is the 50-day moving average crossing at $18.25. Second support is the January-April uptrend line crossing near $17.57.
July cocoa closed higher on Monday. The mid-range close sets the stage for a steady to higher opening on Tuesday. Stochastics and the RSI remain neutral to bullish signaling that sideways to higher prices are possible near-term. If July extends the rally off March's high, monthly resistance crossing at 32.15 is the next upside target. Closes below the 50-day moving average crossing at 28.45 would confirm that a short-term top has been posted.
July sugar closed lower on Monday. The low-range close sets the stage for a steady to lower opening on Tuesday. Stochastics and the RSI are neutral to bullish signaling that sideways to higher prices are possible near-term. If July extends the rally off October's low, weekly resistance on the continuation chart crossing at 25.82 is the next upside target. Closes below the 20-day moving average crossing at 24.90 would signal that a short-term top has been posted while opening the door for additional weakness near-term.
July cotton closed slightly lower on Monday as it consolidates some of last-week's rally. The low-range close sets the stage for a steady to lower opening on Tuesday. Stochastics and the RSI are oversold but remain neutral to bearish signaling that sideways to lower prices are possible near-term. If July extends last-week's rally, April's high crossing at 85.23 is the next upside target. Closes below the 10-day moving average crossing at 80.76 would temper the near-term friendly outlook.
Thanks tallpine!
Turning much drier after this week:
The latest 7 day precip forecasts are below.
Day 1 below:
http://www.wpc.ncep.noaa.gov/qpf/fill_94qwbg.gif?1526306199054

Day 2 below:
http://www.wpc.ncep.noaa.gov/qpf/fill_98qwbg.gif?1528293750112

Day 3 below:
http://www.wpc.ncep.noaa.gov/qpf/fill_99qwbg.gif?1528293842764

Days 4-5 below:
http://www.wpc.ncep.noaa.gov/qpf/95ep48iwbg_fill.gif?1526306162

Days 6-7 below:
http://www.wpc.ncep.noaa.gov/qpf/97ep48iwbg_fill.gif?1526306162

7 Day Total precipitation below:
http://www.wpc.ncep.noaa.govcdx /qpf/p168i.gif?1530796126

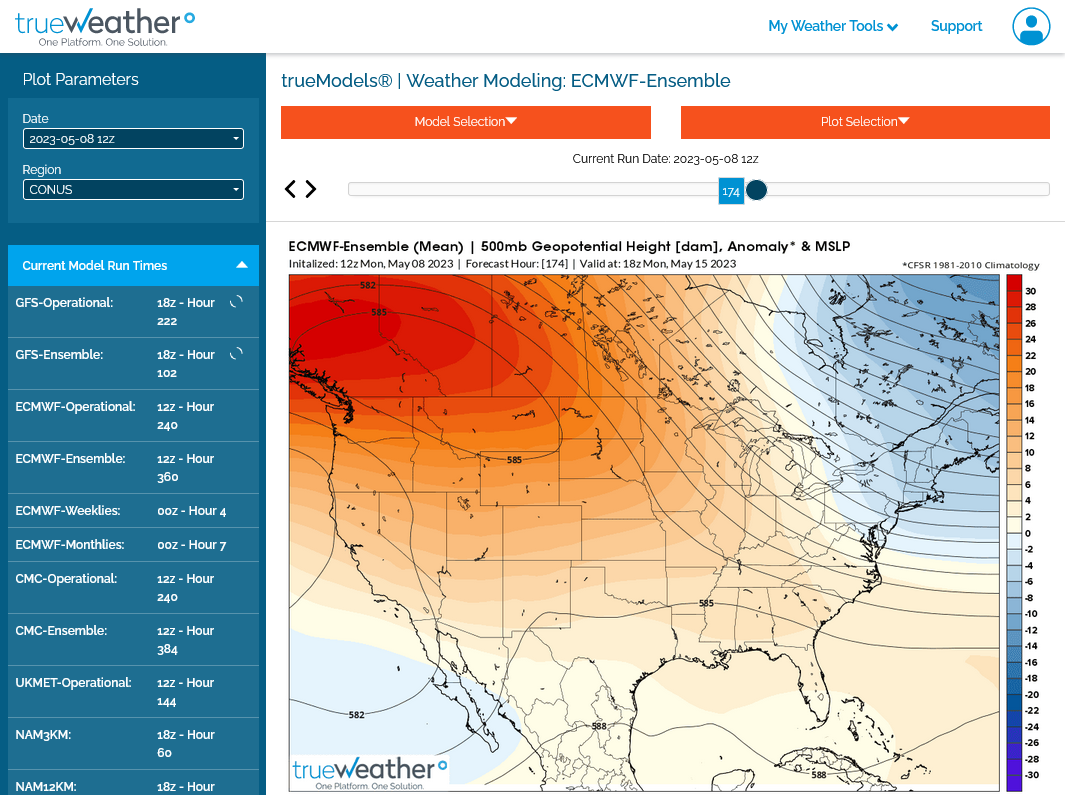
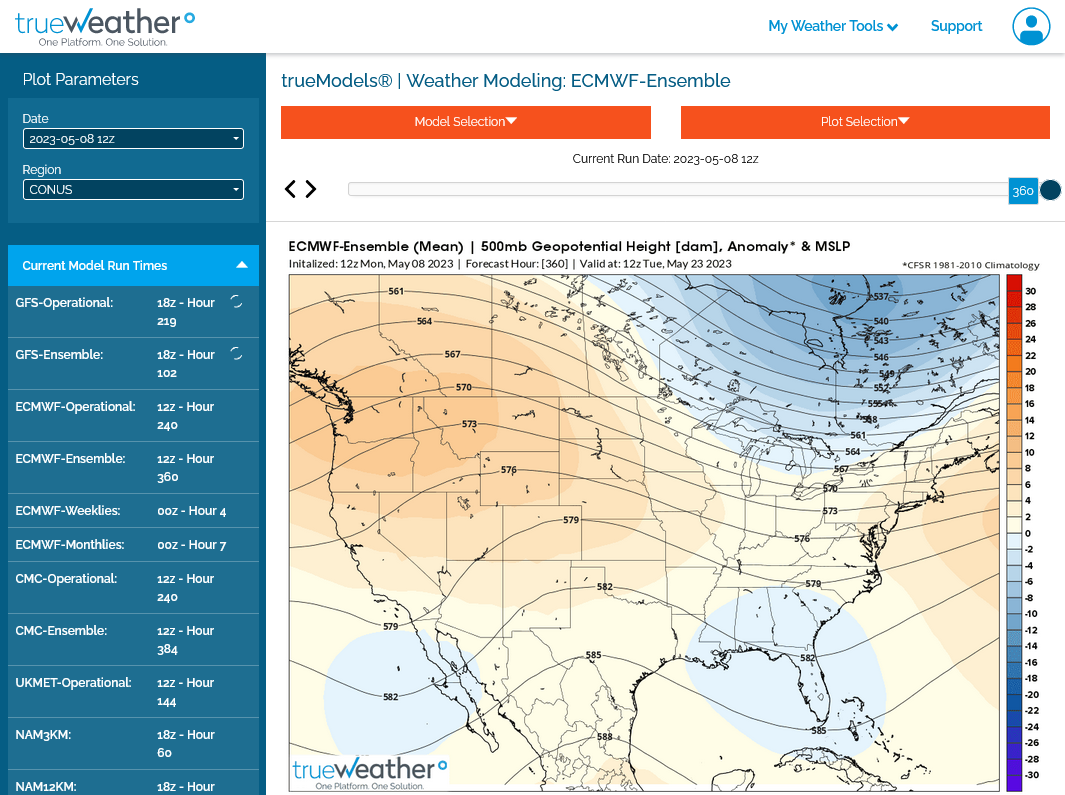
Extended models looking dry-ish
Ridge West, trough East pattern may be setting up.
1. 1 week from now upper level pattern
2. 2 weeks from now upper level pattern