KEY EVENTS TO WATCH FOR:
Thursday, May 18, 2023
8:30 AM ET. May Philadelphia Fed Business Outlook Survey
Business Activity (previous -31.3)
Prices Paid (previous 8.2)
Employment (previous -0.2)
New Orders (previous -22.7)
Prices Received (previous -3.3)
Delivery Times (previous -25.0)
Inventories (previous -17.9)
Shipments (previous -7.3)
8:30 AM ET. Unemployment Insurance Weekly Claims Report - Initial Claims
Jobless Claims (previous 264K)
Jobless Claims, Net Chg (previous +22K)
Continuing Claims (previous 1813000)
Continuing Claims, Net Chg (previous +12K)
8:30 AM ET. U.S. Weekly Export Sales
10:00 AM ET. April Existing Home Sales
Existing Sales (previous 4.44M)
Existing Sales, M/M% (previous -2.4%)
Unsold Homes Month's Supply (previous 2.6)
Median Price (USD) (previous 375700)
Median Home Price, Y/Y% (previous -0.9%)
10:00 AM ET. April Leading Indicators
Leading Index, M/M% (previous -1.2%)
Leading Index
Coincident Index, M/M% (previous +0.2%)
Lagging Index, M/M% (previous -0.2%)
10:00 AM ET. 1st Quarter Quarterly Retail E-Commerce Sales
10:30 AM ET. EIA Weekly Natural Gas Storage Report
Working Gas In Storage (Cbf) (previous 2141B)
Working Gas In Storage, Net Chg (Cbf) (previous +78B)
4:30 PM ET. Federal Discount Window Borrowings
4:30 PM ET. Foreign Central Bank Holdings
Friday, May 19, 2023
10:00 AM ET. 1st Quarter Advance Quarterly Services
10:00 AM ET. April State Employment and Unemployment
The STOCK INDEXES? http://quotes.ino.com/ex?changes/?c=indexes
The Dow closed sharply higher on Wednesday as it erased all of Tuesday's loss.Today's high-range close sets the stage for a steady to higher opening when Thursday's day session begins trading. Stochastics and the RSI are neutral to bearish signaling that sideways to lower prices are possible near-term. Closes below the May 4th low crossing at 32,937.50 would renew the decline off May's high while opening the door for additional weakness near-term. Closes above the 20-day moving average crossing at 33,561.73 would signal that a short-term low has been posted. First resistance is the 20-day moving average crossing at 33,561.73. Second resistance is May's high crossing at 34,257.83. First support is the May 4th low crossing at 32,937.50. Second support is the 38% retracement level of the 2022 rally crossing at 32,399.25.
The June NASDAQ 100 closed sharply higher on Wednesday as it extended the rally off January's low. The high-range close sets the stage for a steady to higher opening when Thursday's day session begins trading. Stochastics and the RSI are overbought but remain neutral to bullish signaling sideways to higher prices are possible. If June extends this year's rally, the 75% retracement level of the 2022-decline crossing at 14,245.67 is the next upside target. Closes below the 20-day moving average crossing at 13,245.01 would signal that a short-term top has likely been posted while opening the door for a possible test of the 50-day moving average crossing at 13,005.30. First resistance is today's high crossing at 13,669.00. Second resistance is the 75% retracement level of the 2022-decline crossing at 14,245.01. First support is the 20-day moving average crossing at 13,245.01. Second support is the 50-day moving average crossing at 13,005.30.
The June S&P 500 closed sharply higher on Wednesday. The high-range close sets the stage for a steady to higher opening when Thursday's day session begins trading. Stochastics and the RSI are neutral to bullish signaling that sideways to higher prices are possible near-term. If June renews the rally off March's low, the February 14th high crossing at 4223.00 is the next upside target. Closes below the 50-day moving average crossing at 4088.94 would confirm that a short-term top has been posted. First resistance is the May 1st high crossing at 4206.25. Second resistance is the February 14th high crossing at 4223.00. First support is May's low crossing at 4062.25. Second support is the 38% retracement level of the 2022-2023 rally crossing at 3904.06.
INTEREST RATES? http://quotes.ino.com/ex?changes/?c=interest ""
June T-bonds closed down 10/32's at 128-26.
June T-bonds closed lower on Wednesday. The low-range close sets the stage for a steady to lower opening when Thursday's day session begins trading. Stochastics and the RSI are oversold but remain neutral to bearish signaling that sideways to lower prices are possible near-term. Today's close below the May 1st low crossing at 129-02 marks a downside breakout of the March-April trading range while opening the door for a test of the 38% retracement level of the October-January rally crossing at 128-08. Closes above the 50-day moving average crossing at 130-31 would confirm that a short-term low has been posted. First resistance is the May 4thhigh crossing at 133-00. Second resistance is April's high crossing at 134-14. First support is today's low crossing at 128-22. Second support is the 38% retracement level of the October-January rally crossing at 128-08.
June T-notes closed down 115-pts. At 114.180.
June T-notes closed lower on Wednesday as it extends this month's decline. The low-range close sets the stage for a steady to lower opening when Thursday's day session begins trading. Stochastics and the RSI are neutral to bearish signaling that sideways to lower prices are possible near-term. If June extends the decline off May's high, the 38% retracement level of the 2022-2023 rally crossing at 114.075 is the next downside target. Closes above the 10-day moving average crossing at 115.153 would signal that a short-term low has been posted. First resistance is the May 11th high crossing at 116.160. Second resistance is March's high crossing at 117.015. First support is the 38% retracement level of the 2022-2023 rally crossing at 114.075. Second support is April's low crossing at 113.305.
ENERGY MARKETS? http://quotes.ino.com/ex?changes/?c=energy ""
June crude oil closed higher on Wednesday.The high-range close sets the stage for a steady to higher opening when Thursday's day session begins. Stochastics and the RSI have turned neutral to bullish signaling that sideways to higher prices are possible near-term. Closes above the 50-day moving average crossing at $74.75 would confirm that a short-term low has been posted. If June resumes the decline off last-week's high, the March 24th low crossing at $67.02 is the next downside target. First resistance is the 50-day moving average crossing at $74.75. Second resistance is the April 23th high crossing at $79.18. First support is the March 24th low crossing at $67.02. Second support is the May 4thlow crossing at $63.64.
June heating oil closed higher on Wednesday. The high-range close sets the stage for a steady to higher opening when Thursday's day trading session begins. Stochastics and the RSI are neutral to bullish signaling that sideways to higher prices are possible near-term. If June extends this month's rally, the 50-day moving average crossing at $2.4936 is the next upside target. Closes below Monday's low crossing at $2.2812 would signal that a short-term top has been posted. First resistance is the 50-day moving average crossing at $2.4936. Second resistance is April's high crossing at $2.7095. First support is Monday's low crossing at $2.2812. Second support is the May 4th low crossing at $2.1500.
June unleaded gas closed sharply higher on Wednesday and closed above the 50-day moving average crossing at 2.5616 as it renewed this month's rally while signaling an important low has been posted. The high-range close sets the stage for a steady to higher opening when Thursday's day session begins trading. Stochastics and the RSI are neutral to bullish signaling that sideways to higher prices are possible near-term. If June extends the rally off May's low, the April 25th high crossing at 2.6295 is the next upside target. Closes below Monday's low crossing at 2.4017 would signal that a short-term top has been posted. First resistance is the April 25th high crossing at 2.6295. Second resistance is the 75% retracement level of the April-May decline crossing at 2.6834. First support is Monday's low crossing at 2.4017. Second support is May's low crossing at 2.2500.
June Henry natural gas closed slightly lower on Wednesday but remains above the 20-day moving average crossing at 2.301. The mid-range close sets the stage for a steady to lower opening when Wednesday's day session begins trading. Stochastics and the RSI are neutral to bullish signaling that sideways to higher prices are possible near-term. Closes above the 50-day moving average crossing at 2.441 would open the door for a larger-degree rally near-term. If June renews the decline off March's high, monthly support crossing at 1.795 is the next downside target.First resistance is the 50-day moving average crossing at 2.441. Second resistance is April's high crossing at 2.543. First support is the May 5th low crossing at 2.031. Second support is the September-2020 low on the monthly continuation chart crossing at 1.795.
CURRENCIES? http://quotes.ino.com/ex?changes/?c=currencies ""
The June Dollar closed higher on Wednesday as it extends the rally off May's low. The mid-range close sets the stage for a steady to higher opening when Thursday's session begins trading. Stochastics and the RSI are overbought but remain neutral to bullish signaling that sideways to higher prices are possible near-term. If June extends the rally off May's low, the 25% retracement level of the 2022-2023 decline crossing at 103.594 is the next upside target. Closes below the 20-day moving average crossing at 101.608 would signal that a short-term top has been posted. First resistance is April's high crossing at 102.745. Second resistance is the 25% retracement level of the September-February decline crossing at $103.586. First support is the 20-day moving average crossing at 101.608. Second support is May's low crossing at 100.520.
The June Euro closed lower on Wednesday as it extends this month's decline. The mid-range close sets the stage for a steady to lower opening when Thursday's day session begins trading. Stochastics and the RSI are oversold but remain neutral to bearish signaling that sideways to lower prices is possible near-term. If June extends this month's decline, the 25% retracement level of the 2022-2023 rally crossing at $1.7774 is the next downside target. Closes above the 20-day moving average crossing at $1.09994 would signal that a short-term low has been posted. First resistance is the 20-day moving average crossing at $1.09994. Second resistance is the April 14th high crossing at 1.11145. First support is today's low crossing at 1.08310. Second support is the 25% retracement level of the 2022-2023 rally crossing at $1.7774.
The June British Pound closed slightly higher on Wednesday. The high-range close sets the stage for a steady to higher opening when Thursday's day session begins trading. Stochastics and the RSI remain neutral to bearish signaling sideways to lower prices are possible near-term. If June extends the decline off May's high, the 50-day moving average crossing at 1.2413 is the next downside target. If June renews the rally off March's low, the 62% retracement level of the 2021-2022 decline crossing at 1.2784 is the next upside target. First resistance is May's high crossing at 1.2692. Second resistance is the 62% retracement level of the 2021-2022 decline crossing at 1.2784. First support is the 50-day moving average crossing at 1.2413. Second support is April's low crossing at 1.2293.
The June Swiss Franc closed lower on Wednesday and below the May 2nd low crossing at 1.11770 confirming that a short-term top has been posted. The mid-range close sets the stage for a steady to lower opening when Thursday's day session begins trading. Stochastics and the RSI are oversold but remain neutral to bearish signaling that sideways to lower prices are possible near-term. If June extends today's decline, the April 10th low crossing at 1.10495 is the next downside target. If June renews the rally off March's low, the 87% retracement level of the 2021-2022 decline crossing at 1.15040 is the next upside target. First resistance is the May 4th high crossing at 1.13940. Second resistance is the 87% retracement level of the 2021-2022 decline crossing at 1.15040. First support is the 50-day moving average crossing at 1.11418. Second support is the April 10th low crossing at 1.10495.
The June Canadian Dollar closed higher on Wednesday. The high-range close sets the stage for a steady to higher opening when Thursday's day session begins trading. Stochastics and the RSI are turning neutral to bullish signaling that sideways to lower prices are possible near-term. If June renews the rally off April's low, May's high crossing at 75.18 is the next upside target. Close below the 50-day moving average crossing at 73.89 would open the door for a possible test of April's low. First resistance is the 10-day moving average crossing at 74.43. Second resistance is May's high crossing at 75.18. First support is the 50-day moving average crossing at 73.89. Second support is April's low crossing at 73.23.
The June Japanese Yen closed lower on Wednesday. The low-range close sets the stage for a steady to lower opening when Thursday’s day session begins trading. Stochastics and the RSI are neutral to bearish signaling that sideways to lower prices are possible near-term. If June renews the decline off March's high, the 62% retracement level of the October-January rally crossing at 0.072908 is the next downside target. Closes above the 50-day moving average crossing at 0.075526 would signal that a short-term low has been posted. First resistance is the 50-day moving average crossing at 0.075526. Second resistance is the April 13th high crossing at 0.076475. First support is the 62% retracement level of the October-January rally crossing at 0.072908. Second support is the 75% retracement level of the October-January rally crossing at 0.071337.
PRECIOUS METALS? http://quotes.ino.com/ex?changes/?c=metals ""
June gold closed lower on Wednesday as it extends the decline off May's high. The mid-range close sets the stage for a steady to lower opening when Thursday's day session begins trading. Stochastics and the RSI are neutral to bearish signaling that sideways to lower prices are possible near-term. Today's close below the 50-day moving average crossing at $1994.60 opens the door for a larger-degree decline during the last-half of May. Closes above the 10-day moving average crossing at $2023.60 would signal that a short-term low has been posted. First resistance is May's high crossing at $2085.40. Second resistance is the March-2022 high crossing at $2097.20. First support is April's low crossing at $1965.90. Second support is the 25% retracement level of the 2022-2023 rally crossing at $1925.20.
July silver closed slightly higher on Wednesday as it consolidates some of the decline off May's high. The high-range close sets the stage for a steady to higher opening when Thursday's day session begins trading. Stochastics and the RSI are oversold but remain neutral to bearish signaling that sideways to lower prices are possible near-term. If July extends this month's decline, the 50% retracement level of the March-May rally crossing at 23.289 is the next downside target. Closes above the 20-day moving average crossing at 25.189 would signal that a short-term low has been posted. First resistance is the 20-day moving average crossing at 25.189. Second resistance is May's high crossing at 26.435. First support is today's low crossing at 23.715. Second support is the 50% retracement level of the March-May rally crossing at 23.289.
July copper closed higher on Wednesday as it consolidates some of the decline off January's high. The high-range close sets the stage for a steady to higher opening when Thursday's day session begins trading. Stochastics and the RSI are oversold but remain neutral to bearish signaling that sideways to lower prices are possible near-term. If July extends the aforementioned decline, the 62% retracement level of the 2022-2023 rally crossing at 3.6247 is the next downside target. Closes above the 20-day moving average crossing at 3.8574 would signal that a low has been posted. First resistance is the 20-day moving average crossing at 3.8574. Second resistance is the 50-day moving average crossing at 3.9644. First support is the 62% retracement level of the 2022-2023 rally crossing at 3.6247. Second support is the 75% retracement level of the 2022-2023 rally crossing at 3.4683.
GRAINS? http://quotes.ino.com/ex?changes/?c=grains "
July Corn closed down $0.19 3/4-cents at $5.61 1/2.
July corn closed sharply lower on Wednesday to post a downside breakout of this month's trading range and renew the decline off December's high. The low-range close sets the stage for a steady to lower opening when Thursday's night session begins trading. Stochastics and the RSI have turned bearish with today's sharp decline and are neutral to bearish signaling that sideways to lower prices are possible near-term. If July renew the decline off April's high, the November-2021 low crossing at $5.41 1/2 is the next downside target. Closes above the May 8th high crossing at $6.00 would signal that a short-term low has been posted. First resistance is the May 8th high crossing at $6.00. Second resistance is the 50-day moving average crossing at $6.10 1/2. First support is today's low crossing at $5.54 1/4. Second support is the November-2021 low crossing at $5.41 1/2.
July wheat closed down $0.22-cents at $6.25 1/2.
July wheat closed sharply lower on Wednesday. The low-range close sets the stage for a steady to lower opening when Thursday's day session begins trading. Stochastics and the RSI are turning bearish with today's sharp decline and are neutral to bearish signaling that sideways to lower prices are possible near-term. If July renews the decline off February's high, the March-2021 low crossing at $5.71 is the next downside target. Closes above the 50-day moving average crossing at $6.76 would signal that a short-term low has been posted while opening the door for additional short-covering gains. First resistance is the 50-day moving average crossing at $6.76. Second resistance is the April 18th high crossing at $7.17 1/4. First support is the May 3rd low crossing at $6.03 3/4. Second support is the March-2021 low crossing at $5.71.
July Kansas City Wheat closed down $0.09 3/4-cents at $8.85 1/2.
July Kansas City wheat closed lower on Wednesday after testing resistance marked by the 38% retracement level of the 2022-2023 decline crossing at $9.17 1/4. The low-range close sets the stage for a steady to lower opening when Thursday's day session begins trading. Stochastics and the RSI are overbought but remain neutral to bullish signaling that sideways to higher prices are possible near-term. If July extends the rally off May's low, the 50% retracement level of the 2022-2023 decline crossing at $9.73 1/4 is the next upside target. Closes below the 20-day moving average crossing at $8.23 would signal that a short-term top has been posted. First resistance is the 38% retracement level of the 2022-2023 decline crossing at $9.17 1/4. Second resistance is the 50% retracement level of the 2022-2023 decline crossing at $9.73 1/4. First support is the 10-day moving average crossing at $8.58. Second support is the 20-day moving average crossing at $8.23.
July Minneapolis wheat closed down $0.19-cents crossing at $8.59 3/4.
July Minneapolis wheat closed sharply lower on Wednesday as it consolidates some of the rally off May's low. The high-range close sets the stage for a steady to higher opening when Wednesday's day session begins trading. Stochastics and the RSI are overbought but remain neutral to bullish signaling that sideways to higher prices are possible near-term. If July extends the aforementioned rally, the April 18th high crossing at $8.95 1/4 is the next upside target. Closes below the 20-day moving average crossing at $8.31 1/2 would signal that a short-term top has been posted. First resistance is the April 18th high crossing at $8.95 1/4. Second resistance is April's high crossing at $9.13 1/2. First support is the 20-day moving average crossing at $8.31 1/2. Second support is May's low crossing at $8.69.
SOYBEAN COMPLEX? http://quotes.ino.com/ex?changes/?c=grains "
July soybeans closed down $0.27-cents at $13.37.
July soybeans closed sharply lower for the second day in a row on Wednesday as it posted a new low for the year. Today's decline fell just short of testing the 87% retracement level of the 2022-rally crossing at $13.31. The low-range close sets the stage for a steady to lower opening when Thursday's day trade begins. Stochastics and the RSI are oversold, diverging but remain neutral to bearish signaling that sideways to lower prices are possible near-term. If July extends the decline off April's high, the 87% retracement level of the 2022-rally crossing at $13.31 is the next downside target. Closes above the 20-day moving average crossing at $14.13 would signal that a low has been posted. First resistance is the 20-day moving average crossing at $14.13. Second resistance is the 50-day moving average crossing at $14.44 3/4. First support is the 87% retracement level of the 2022-2023 rally crossing at $13.31. Second support is the 87% retracement level of the July-2022 low crossing at $12.99.
July soybean meal closed down $1.60 at $425.30.
July soybean meal closed lower on Wednesday. The low-range close sets the stage for a steady to lower opening when Thursday's day session begins trading. Stochastics and the RSI have turned neutral to bearish signaling that sideways to lower prices are possible near-term. If July renews the decline off March's high, the 38% retracement level of the 2020-2023 rally crossing at $411.90 is the next downside target. Closes above Monday's high crossing at $442.30 would signal that a short-term low has been posted. First resistance is Monday's high crossing at $442.30. Second resistance is the 50-day moving average crossing at $446.60. First support is last-Wednesday's low crossing at $416.10. Second support is the 38% retracement level of the 2020-2023 rally crossing at $411.90.
July soybean oil closed down 104-pts. at 46.41.
July soybean oil closed sharply lower on Wednesday as it extended this month's decline. The low-range close sets the stage for a steady to lower opening when Thursday's day session begins trading. Stochastics and the RSI are oversold but remain neutral to bearish signaling that sideways to lower prices are possible near-term. If July extends this month's decline, the 75% retracement level of the 2020-2022 rally crossing at 40.19 is the next downside target. Closes above the 20-day moving average crossing at 51.70 would signal that a low has been posted. First resistance is the 20-day moving average crossing at 51.70. second support is the 50-day moving average crossing at 54.02. First support is today's low crossing at 45.75. Second support is the 75% retracement level of the 2020-2022 rally crossing at 40.19.
LIVESTOCKhttp://quotes.ino.com/exchanges/?c=livestock
June hogs closed down $2.33 at $84.88.
June hogs closed sharply lower on Wednesday signal a likely end to the recent rebound off May's low. The low-range close sets the stage for a steady to lower opening when Thursday's day session begins trading. Stochastics and the RSI are neutral to bullish signaling that sideways to higher prices are possible near-term. If June extends the rally off May's low, the 50-day moving average crossing at $89.90 is the next upside target. If June resumes this year's decline, weekly support on the continuation chart crossing at $80.99 is the next downside target. First resistance is the 50-day moving average crossing at $89.90. Second resistance is the April 28th high crossing at $92.00. First support is May's low crossing at $82.73. Second support is weekly support on the continuation chart crossing at $80.99.
June cattle closed up $1.00 at $164.88.
June cattle closed higher on Wednesday. The high-range close sets the stage for a steady to higher opening on Thursday. Stochastics and the RSI are neutral to bullish signaling that sideways to higher prices are possible near-term. If June extends the rally off May's low, the May 1st high crossing at $165.78 is the next upside target. Closes below the 50-day moving average crossing at $161.60 would open the door for additional weakness near-term. First resistance is the May 1st high crossing at $165.78. Second resistance is April's high crossing at $166.28. First support is the 50-day moving average crossing at $161.60. Second support is the 50% retracement level of the March-April rally crossing at $160.33.
August Feeder cattle closed down $0.20 at $231.28.
August Feeder cattle closed lower on Wednesday as it consolidates some of the rally off the May 8th low. The mid-range close sets the stage for a steady to lower opening when Thursday's day session begins trading. Stochastics and the RSI are overbought but remain neutral to bullish signaling that sideways to higher prices are possible near-term. If August extends the rally off May's low, the October-2014 high on the monthly continuation chart crossing at $245.20 is the next upside target. Closes below the 10-day moving average crossing at $226.78 would temper the near-term friendly outlook. First resistance is April's high crossing at $232.23. Second resistance is the October-2014 high on the monthly continuation chart crossing at $245.20. First support is the 20-day moving average crossing at $227.95. Second support is the 10-day moving average crossing at $226.78.
FOOD & FIBERhttp://quotes.ino.com/ex changes/?c=food
July coffee closed lower on Wednesday as it extends the trading range of the past three-weeks. The mid-range close sets the stage for a steady to lower opening on Thursday. Stochastics and the RSI have turned neutral to bullish signaling sideways to higher prices are possible near-term. Closes above the May 8th high crossing at $19.00 would mark a possible upside breakout of the aforementioned trading range while opening the door for additional short covering gains. Closes below last-Friday's low crossing at $18.06 would renew the decline off April's high thereby opening the door for additional weakness near-term. First resistance is the May 8th high crossing at $19.00. Second resistance is April's high crossing at $20.49. First support is last-Friday's low crossing at $18.06. Second support is the January-April uptrend line crossing near $17.84.
July cocoa closed slightly higher on Wednesday. The high-range close sets the stage for a steady to slightly higher opening on Thursday. Stochastics and the RSI are neutral to bullish signaling that sideways to higher prices are possible near-term. If July renews the rally off March's low, monthly resistance crossing at 32.15 is the next upside target. Closes below the 50-day moving average crossing at 28.75 would confirm that a short-term top has been posted.
July sugar closed lower on Wednesday as it extends the trading range of the past four-weeks. The low-range close sets the stage for a steady to lower opening on Thursday. Stochastics and the RSI are neutral to bearish signaling that sideways to lower prices are possible near-term. Closes below the May 3rd low crossing at 24.88 would mark a downside breakout of the aforementioned trading range while opening the door for additional weakness near-term. If July renews the rally off October's low, weekly resistance on the continuation chart crossing at 29.36 is the next upside target.
July cotton closed sharply higher on Wednesday as it posted an upside breakout of the February-May trading range. The high-range close sets the stage for a steady to higher opening on Wednesday. Stochastics and the RSI are neutral to bullish signaling that sideways to higher prices are possible near-term. If July extends the rally off April's low, the January 26th high crossing at 89.59 is the next upside target. Closes below the 20-day moving average crossing at 81.15 would signal that a short-term top has been posted.
Thanks tallpine!
big increase in rains in dry areas in week 2 the last 2 days.
moved up to the 6-10 day outlook.
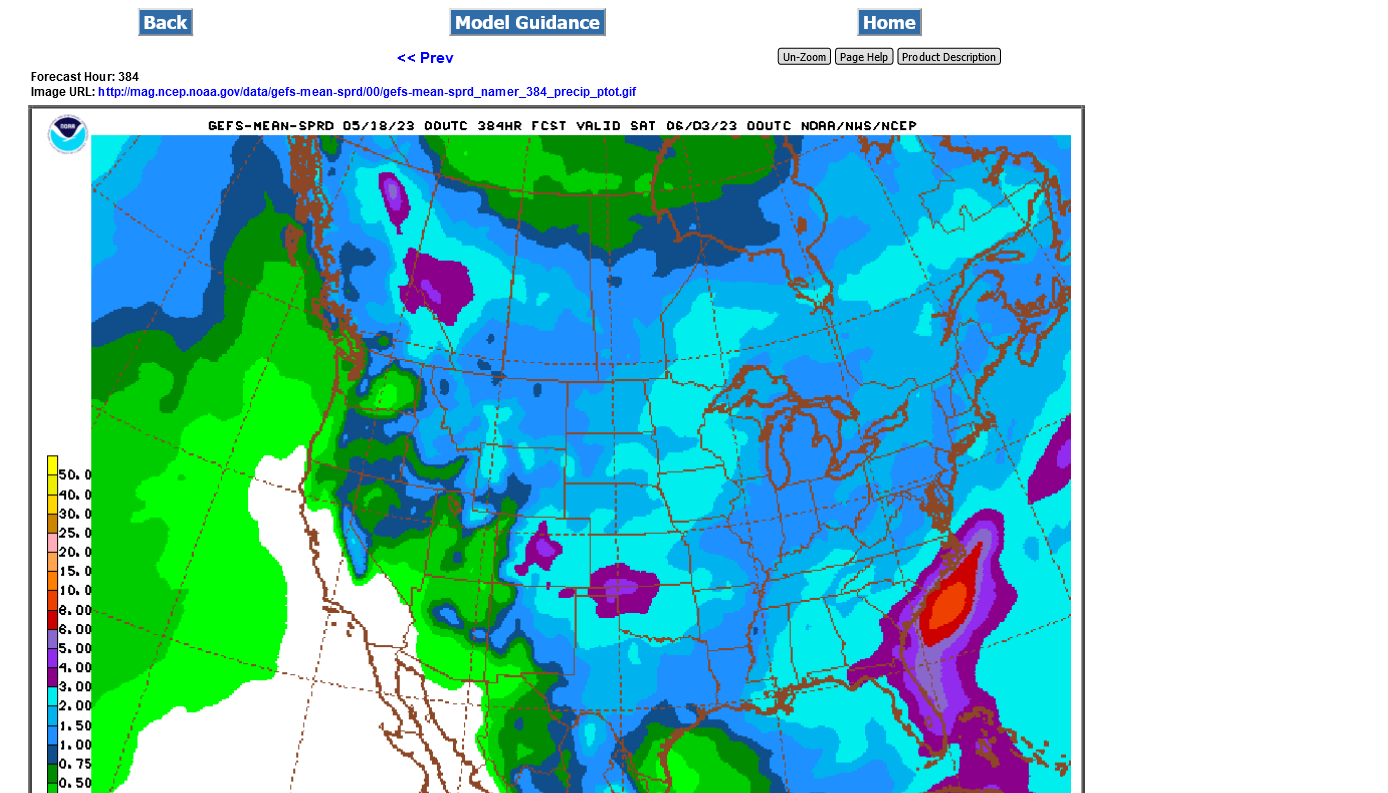
Last 0z GEFS 2 week rains:
Light blue is 2+ inches!