KEY EVENTS TO WATCH FOR:
Friday, May 19, 2023
10:00 AM ET. 1st Quarter Advance Quarterly Services
10:00 AM ET. April State Employment and Unemployment
Tuesday, May 23, 2023
8:55 AM ET. Johnson Redbook Retail Sales Index
Ret Sales Mo-to-Date, Y/Y% (previous +1.5%)
Latest Wk, Y/Y% (previous +1.6%)
9:45 AM ET. May US Flash Manufacturing PMI
PMI, Mfg (previous 50.4)
9:45 AM ET. May US Flash Services PMI
PMI, Services (previous 53.7)
10:00 AM ET. May Richmond Fed Business Activity Survey
Mfg Idx (previous -10)
Shipments Idx (previous -7)
10:00 AM ET. April New Residential Sales
New Home Sales (previous 683K)
New Home Sales, M/M% (previous +9.6%)
New Home Sales Months Supply (previous 7.6)
1:00 PM ET. April Money Stock Measures
4:30 PM ET. API Weekly Statistical Bulletin
Crude Stocks, Net Chg (Bbls) (previous +3.7M)
Gasoline Stocks, Net Chg (Bbls) (previous -2.5M)
Distillate Stocks, Net Chg (Bbls) (previous -0.9M)
The STOCK INDEXES? http://quotes.ino.com/ex?changes/?c=indexes
The STOCK INDEXES: The June NASDAQ 100 was steady to slightly higher overnight as it extends this year's rally. Overnight trading set the stage for a steady to slightly higher opening when the day session begins trading. Stochastics and the RSI are overbought but remain neutral to bullish signaling that sideways to higher prices are possible near-term. If June extends this year's rally, the August-2022 high crossing at 13,983.00 is the next upside target. Closes below the 20-day moving average crossing at 13,325.81 would signal that a short-term top has been posted. First resistance is the overnight high crossing at 13,960.25. Second resistance is the August-2022 high crossing at 13,983.00. First support is the 10-day moving average crossing at 13,526.08. Second support is the 20-day moving average crossing at 13,325.81.
The June S&P 500 was slightly higher overnight as it extends Thursday's upside breakout of the April-May trading range. Overnight strength sets the stage for a steady to higher opening when the day session begins trading. Stochastics and the RSI are overbought but remain neutral to bullish signaling that sideways to higher prices are possible near-term. Multiple closes above the May 1st high crossing at 4206.25 would confirm an upside breakout of the April-May trading range and open the door for a test of February's high crossing at 4244.00. Closes below the 20-day moving average crossing at 4146.02 would signal that a short-term top has been posted. First resistance is the May 1st high crossing at 4206.25. Second resistance February's high crossing at 4244.00. First support is the 20-day moving average crossing at 4146.02. Second support is the 50-day moving average crossing at 4097.68.
INTEREST RATES http://quotes.ino.com/ex changes/?c=interest"
INTEREST RATES: June T-bonds were slightly lower overnight as it extends this week's breakout to the downside of the March-May trading range. Overnight weakness sets the stage for a steady to slightly lower opening when the day session begins trading. Stochastics and the RSI are oversold but remain neutral to bearish signaling that sideways to lower prices are possible near-term. If June extends the decline off April's high, the 50% retracement level of the October-January rally crossing at 126-10 is the next downside target. Closes above the 20-day moving average crossing at 130-14 would signal that a short-term low has been posted. First resistance is the 10-day moving average crossing at 129-18. Second resistance is the 20-day moving average crossing at 130-14. First support is the overnight low crossing at 127-23. Second support is the 50% retracement level of the October-January rally crossing at 126-10.
June T-notes were slightly higher overnight as it consolidates some of this month's decline. Overnight trading sets the stage for a slightly higher opening when the day session begins trading. Stochastics and the RSI are oversold but remain neutral to bearish signaling that sideways to lower prices are possible near-term. If June extends this month's decline, the 50% retracement level of the 2022-2023 rally crossing at 113.116 is the next downside target. Closes above the 20-day moving average crossing at 115.076 would temper the near-term bearish outlook. First resistance is the 20-day moving average crossing at 115.076. Second resistance is the May 11th high crossing at 116.160. First support is Thursday's low crossing at 113.275. Second support is the 50% retracement level of the 2022-2023 rally crossing at 113.116.
ENERGY MARKETS? http://quotes.ino.com/ex?changes/?c=energy ""
ENERGIES: June crude oil was higher overnight. Overnight trading sets the stage for a higher opening when the day session begins trading. Stochastics and the RSI are neutral to bullish signaling that sideways to higher prices are possible near-term. Closes above the 50-day moving average crossing at $74.59 would signal that a short-term low has been posted. If June renews last-week's decline, the March 24th low crossing at $67.02 is the next downside target. First resistance is the 50-day moving average crossing at $74.59. Second resistance is the April 24th high crossing at $79.18. First support is the March 24th low crossing at $67.02. Second support is the May 4th low crossing at $63.64.
June heating oil was slightly higher overnight and sets the stage for a slightly higher opening when the day session begins trading. Stochastics and the RSI are overbought but remain neutral to bullish signaling that sideways to higher prices are possible near-term. If June extends the rally off May's low, the 50-day moving average crossing at 2.4846 is the next upside target. Closes below Monday's low crossing at 2.2812 would signal that a short-term top has been posted. First resistance is the 50-day moving average crossing at 2.4846. Second resistance is the April 25th high crossing at $2.5377. First support is Monday's low crossing at 2.2812. Second support is May's low crossing at 2.1500.
June unleaded gas was higher overnight and sets the stage for a higher opening when the day session begins trading. Stochastics and the RSI are overbought but remain neutral to bullish signaling that sideways to higher prices are possible near-term. If June extends the rally off May's low, the April 25th high crossing at $2.6295 is the next upside target. Closes below the 20-day moving average crossing at $2.4859 would signal that a short-term top has been posted. First resistance is the April 25th high crossing at $2.6295. Second resistance is the 75% retracement level of the April-May decline crossing at $2.6834. First support is the 20-day moving average crossing at $2.4859. Second support is Monday's low crossing at $2.4017.
June natural gas was steady to slightly lower overnight and sets the stage for a slightly lower opening when the day session begins trading. Stochastics and the RSI are neutral to bullish signaling that sideways to higher prices are possible near-term. If June extends the rally off May's low, the 25% retracement level of the December-May decline crossing at 2.877 is the next upside target. Closes below the 20-day moving average crossing at 2.318 would signal that a short-term top has been posted. If June renews the decline off March's high, the September-2020 low on the monthly continuation chart crossing at 1.795 is the next downside target. First resistance is Thursday's high crossing at 2.634. Second resistance is the 25% retracement level of the December-May decline crossing at 2.877. First support is the 20-day moving average crossing at 2.318. Second support is the May 5th low crossing at 2.031.
CURRENCIEShttp://quotes.ino.com/ex changes/?c=currencies"
CURRENCIES: The June Dollar was lower overnight as it consolidates some of the rally off May's low. Overnight trading and sets the stage for a steady to lower opening when the day session begins trading later this morning. Stochastics and the RSI are overbought but remain neutral to bullish signaling that sideways to higher prices are possible near-term. If June extends the rally off May's low, the 25% retracement level of the 2022-2023 decline crossing at $103.594 is the next upside target. Closes below the 20-day moving average crossing at $101.786 would signal that a short-term top has been posted. First resistance is the25% retracement level of the 2022-2023 decline crossing at $103.594. Second resistance is the March 15th high crossing at $104.720. First support is the 10-day moving average crossing at $102.225. Second support is the 20-day moving average crossing at $101.786.
The June Euro was steady to slightly higher overnight as it consolidates some of this month's decline. Overnight trading sets the stage for a steady to slightly higher opening when the day session begins trading. Stochastics and the RSI are oversold but remain neutral to bearish signaling that sideways to lower prices are possible near-term. If June extends this month's decline, the 38% retracement level of the 2022-2023 rally crossing at 1.05914 is the next downside target. Closes above the 20-day moving average crossing at $1.09786 would signal that a short-term low has been posted. First resistance is the 10-day moving average crossing at $1.0984. Second resistance is the 20-day moving average crossing at $1.09786. First support is the 25% retracement level of the 2022-2023 rally crossing at 1.07774. Second support is the 38% retracement level of the 2022-2023 rally crossing at 1.05914.
The June British Pound was steady to slightly higher overnight and sets the stage for a slightly higher opening when the day session begins trading. Stochastics and the RSI are oversold but remain neutral to bearish signaling that sideways to lower prices near-term. Multiple closes below the 50-day moving average crossing at 1.2430 would open the door for additional weakness near-term. If June renews the rally off the March 8th low, the 62% retracement level of the 2021-2022 decline crossing at 1.2784 is the next upside target. First resistance is the May 10th high crossing at 1.2692. Second resistance is the 62% retracement level of the 2021-2022 decline crossing at 1.2784. First support is the 50-day moving average crossing at 1.2430. Second support is April's low crossing at 1.2293.
The June Swiss Franc was higher overnight as it consolidates some of this month's decline. Overnight strength sets the stage for a higher opening when the day session begins trading. Stochastics and the RSI are oversold but remain neutral to bearish signaling that sideways to lower prices are possible near-term. If June extends the decline off May's high, April's low crossing at 1.09640 is the next downside target. Closes above the 20-day moving average crossing at 1.12467 would signal that a short-term low has been posted. First resistance is the 20-day moving average crossing at 1.12467. Second resistance is May's high crossing at 1.13940. First support is the 25% retracement level of the 2022-2023 rally crossing at 1.10794. Second support is April's low crossing at 1.09640.
The June Canadian Dollar was steady to slightly higher overnight. Overnight trading sets the stage for a higher opening when the day session begins trading. Stochastics and the RSI are neutral to bearish signaling that sideways to lower prices are possible near-term. Closes below the 50-day moving average crossing at $73.95 would signal that a short-term top has been posted while opening the door for additional weakness near-term. Closes above the 10-day moving average crossing at $74.37 would temper the near-term bearish outlook. First resistance is the 10-day moving average crossing at $74.37. Second resistance is May's high crossing at $75.18. First support is the 50-day moving average crossing at $73.95. Second support is April's low crossing at $73.23.
The June Japanese Yen was steady to slightly higher overnight as it consolidates some of the decline off the May 4th high. Overnight trading sets the stage for a slightly higher opening when the day session begins trading. Stochastics and the RSI are oversold but remain neutral to bearish signaling that sideways to lower prices are possible near-term. If June extends the decline off the March's high, the 75% retracement level of the 2022-2023 rally crossing at 0.071337 is the next downside target. Closes above the 20-day moving average crossing at 0.074222 would signal that a short-term low has been posted. First resistance is the 20-day moving average crossing at 0.074222. Second resistance is the 50-day moving average crossing at 0.075430. First support is the November-21st-2022 low crossing at 0.072425. Second support is the 75% retracement level of the 2022-2023 rally crossing at 0.071337.
PRECIOUS METALS http://quotes.ino.com/ex changes/?c=metals"
June gold was steady to slightly higher overnight and sets the stage for a higher opening when the day session begins trading later this morning. Stochastics and the RSI are oversold but remain neutral to bearish signaling that sideways to lower prices are possible near-term. If June the decline off May's high, the 38% retracement level of the September-May rally crossing at $1923.90 is the next downside target. Closes above the 20-day moving average crossing at $2010.60 would signal that a short-term low has been posted. First resistance is the 20-day moving average crossing at $2010.60. Second resistance is the May 4th high crossing at $2085.40. First support is the March 22nd low crossing at $1953.70. Second support is the 38% retracement level of the September-May rally crossing at $1923.90.
July silver was higher overnight as it consolidates some of this month's decline and sets the stage for a higher opening when the day session begins trading later this morning. Stochastics and the RSI are oversold but remain neutral to bearish signaling that sideways to lower prices are possible near-term. If July extends this month's decline, the 50% retracement level of the March-April rally crossing at $23.289 is the next downside target. Closes above the 20-day moving average crossing at $25.012 would temper the near-term bearish outlook. First resistance is the 20-day moving average crossing at $25.012. Second resistance is the May 5th high crossing at $26.435. First support is the 50% retracement level of the March-April rally crossing at $23.289. Second support is the 62% retracement level of the March-April rally crossing at $22.541.
July copper was higher overnight as it extends this week's trading range. Overnight trading sets the stage for a higher opening when the day session begins trading. Stochastics and the RSI are oversold but remain bearish signaling that sideways to lower prices are possible near-term. If July extends the decline off April's high, the 62% retracement level of the 2022-2023 rally crossing at 3.6247 is the next downside target. Closes above the 20-day moving average crossing at 3.8282 would signal that a short-term low has been posted. First resistance is the 20-day moving average crossing at 3.8282. Second resistance is the 50-day moving average crossing at 3.9517. First support is Wednesday's low crossing at 3.6525. Second support is the 62% retracement level of the 2022-2023 rally crossing at 3.6247.
GRAINS http://quotes.ino.com/ex changes/?c=grains
July corn was higher overnight as it consolidates some of this week's sharp decline. Overnight trading sets the stage for a steady to higher opening when the day sessions begins trading. Stochastics and the RSI are neutral to bearish signaling that sideways to lower prices are possible near-term. If July extends the decline off April's high, the 62% retracement level of the 2020-2022 rally crossing at $5.27 1/2 is the next downside target. Closes above the May 8th high crossing at $6.00 would signal that a short-term low has been posted. First resistance is the May 8th high crossing at $6.00. Second resistance is the 50-day moving average crossing at $6.08 1/2. First support is the December-2021 low crossing at $5.48 3/4. Second support is the 62% retracement level of the 2020-2022 rally crossing at $5.27 1/2.
July wheat was higher overnight as it consolidates some of the decline off Tuesday's high. Overnight trading sets the stage for a higher opening when the day session begins trading. Stochastics and the RSI are neutral to bearish signaling that sideways to lower prices are possible near-term. If July resumes the decline off March's high the March-2021 low crossing at $5.71 is the next downside target. Closes above the 50-day moving average crossing at $6.73 1/4 would confirm that a low has been posted. First resistance is last-Monday's high crossing at $6.69. Second resistance is the 50-day moving average crossing at $6.73 1/4. First support is May's low crossing at $6.03 3/4. Second support is the March-2021 low crossing at $5.71.
July Kansas City wheat was higher overnight as it consolidates some of this week's decline. Overnight trading sets the stage for a higher opening when the day session begins trading later this morning. However, stochastics and the RSI have turned neutral to bearish signaling that sideways to lower prices are possible near-term. Closes below the 20-day moving average crossing at $8.26 1/4 would signal that a short-term top has been posted. If July extends the rally off May's low, the November 15th high crossing at $9.48 1/2 is the next upside target. First resistance is the 38% retracement level of the 2022-2023 decline crossing at $9.17 1/4. Second resistance is the November 15th high crossing at $9.48 1/2. First support is the 50-day moving average crossing at $8.32. Second support is the 20-day moving average crossing at $8.26 1/4.
July Minneapolis wheat was higher overnight as it consolidates some of this week's sharp decline. Overnight trading sets the stage for a modestly higher opening when the day session begins trading. Stochastics and the RSI have turned neutral to bearish signaling that sideways to lower prices are possible near-term. Thursday's close below the 20-day moving average crossing at $8.29 1/2 signals that a short-term top has been posted while opening the door for additional weakness near-term. If July resumes this month's rally, the April 18th high crossing at $8.95 1/4 is the next upside target. First resistance is the April 18th high crossing at $8.95 1/4. Second resistance is April's high crossing at $9.13 1/2. First support is Thursday's low crossing at $8.21 3/4. Second support is the May 3rd low crossing at $7.69.
SOYBEAN COMPLEX? http://quotes.ino.com/ex?changes/?c=grains "
July soybeans were higher overnight as they consolidate some of this week's sharp decline. Overnight trading sets the stage for a steady to higher opening when the day session begins trading later this morning. Stochastics and the RSI are oversold but remain neutral to bearish signaling that sideways to lower prices are possible near-term. If July extends the decline off April's high, the July 25th 2022 low crossing at $13.23 3/4 is the next downside target. Closes above the 20-day moving average crossing at $14.01 1/4 would signal that a short-term low has been posted while opening the door for additional short-covering gains. First resistance is the 20-day moving average crossing at $14.01 1/4. Second resistance is the 50-day moving average crossing at $14.38 1/4. First support is the 87% retracement level of the 2022-2023 rally crossing at $13.31. Second support is the July 25th 2022 low crossing at $13.23 3/4.
July soybean meal was higher overnight as it consolidates some of the decline off Monday's high. Overnight trading sets the stage for a higher opening when the day session begins trading. Stochastics and the RSI are oversold but remain neutral to bearish signaling that sideways to lower prices are possible near-term. If July extends the decline off March's high, the 38% retracement level of the 2020-2023 rally crossing at $411.90 is the next downside target. Closes above Monday's high crossing at $442.30 would confirm that a low has been posted. First resistance is Monday's high crossing at $442.30. Second resistance is the 50-day moving average crossing at $444.20. First support is the overnight low crossing at $412.80. Second support is the 38% retracement level of the 2020-2023 rally crossing at $411.90.
July soybean oil was steady to slightly higher overnight as it consolidates some of this month's decline. Overnight trading sets the stage for a steady to slightly higher opening when the day session begins trading. Stochastics and the RSI are oversold but remain neutral to bearish signaling that sideways to lower prices are possible near-term. If July extends this month's decline, the 75% retracement level of the 2020-2022 rally crossing at 40.19 is the next downside target. Closes above the 20-day moving average crossing at 51.05 would signal that a low has been posted while opening the door for a possible test of the 50-day moving average crossing at 53.60. First resistance is the 20-day moving average crossing at 51.05. Second resistance is the 50-day moving average crossing at 53.60. First support is the 62% retracement level of the 2020-2022 rally crossing at 46.42. Second support is the 75% retracement level of the 2020-2022 rally crossing at 40.19.
Thanks tallpine!
HRW continues lower from rains hitting dry places.
Not sure why C is up and beans down a bit. It's not an obvious weather reason.
https://www.marketforum.com/forum/topic/95216/#95301
There is a strong correlation between El Nino growing seasons and favorable weather. It's likely CAUSATION related with La Nina's, like the last couple of growing seasons often featuring bad/dry weather.
For sure the market knows this and is already dialing that into prices and is LESS threatened with current drought areas expanding. Week 2 weather maps were increasing rains this week(especially for the driest areas), which confirmed less need for drought scare weather premium and prices crashed.
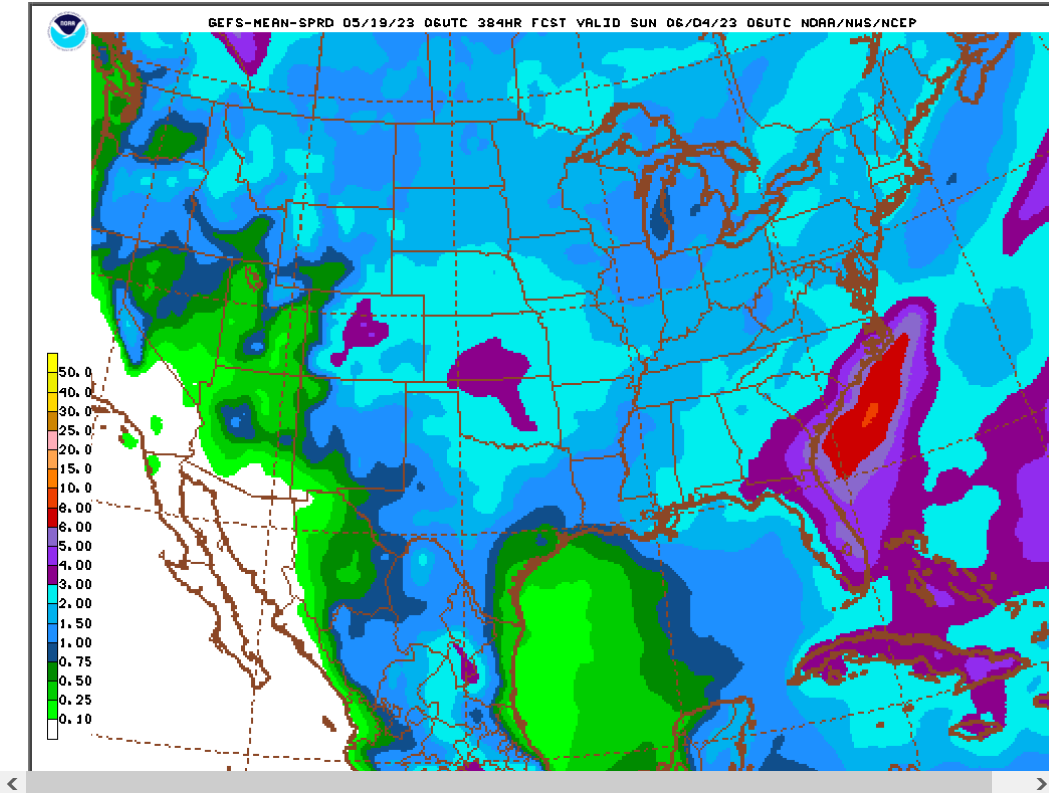
This was the last 6z GEFS rain total map for 2+ weeks.
Light blue is 2+ inches and good rains for the some of the driest areas. 3+ inches will make a dent in the drought and just what the doctor ordered for the worst rated HRW in the S.Plains since accurate records started on this metric.
This will help some P/VP wheat to make Fair but not give up much G/Ex wheat in KS, though there will be a single digit amount of that.
Planting being well ahead of average means there will be no planting delay concerns for most of the crop this year (other than ND).
ND/MN are not as wet but they need warm/dry to plant so its actually bearish for them too.
Upon a more extensive analysis, I'm adjusting my forecast DRIER for much of the Midwest.
The Plains will still get great rains but I think much of the Cornbelt will be getting drier then next 2 weeks, the farther east, the less rain.
In fact, I think IA/IL,IN and OH will not have a decent rain the next 2 weeks.
This may in fact be why corn is strong today.
Beans might still be looking at this as a planting time and it having a bearish spin but corn is farther along and this very dry weather, with increasing heat could be viewed as GROWING conditions.
The European model is especially dry in those locations and actually lines up with the upper level ridge in place at that time:
2 week rains
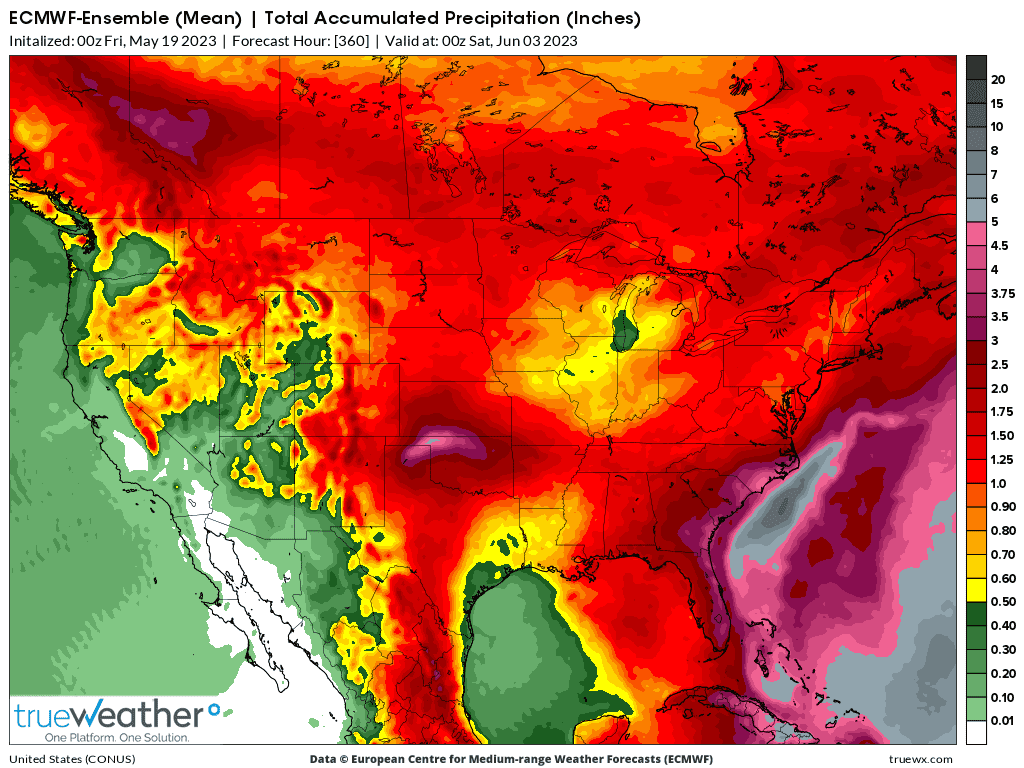
Upper levels in 2 weeks. Rain suppressing ridge across the middle part of the country.

The GEFS is WETTER than this, so it's a low confidence forecast!