KEY EVENTS TO WATCH FOR:
Tuesday, May 23, 2023
8:55 AM ET. Johnson Redbook Retail Sales Index
Ret Sales Mo-to-Date, Y/Y% (previous +1.5%)
Latest Wk, Y/Y% (previous +1.6%)
9:45 AM ET. May US Flash Manufacturing PMI
PMI, Mfg (previous 50.4)
9:45 AM ET. May US Flash Services PMI
PMI, Services (previous 53.7)
10:00 AM ET. May Richmond Fed Business Activity Survey
Mfg Idx (previous -10)
Shipments Idx (previous -7)
10:00 AM ET. April New Residential Sales
New Home Sales (previous 683K)
New Home Sales, M/M% (previous +9.6%)
New Home Sales Months Supply (previous 7.6)
1:00 PM ET. April Money Stock Measures
4:30 PM ET. API Weekly Statistical Bulletin
Crude Stocks, Net Chg (Bbls) (previous +3.7M)
Gasoline Stocks, Net Chg (Bbls) (previous -2.5M)
Distillate Stocks, Net Chg (Bbls) (previous -0.9M)
The STOCK INDEXES? http://quotes.ino.com/ex?changes/?c=indexes
The Dow closed lower on Friday as it extends the April-May trading range.Today's low-range close sets the stage for a steady to lower opening when Monday's day session begins trading. Stochastics and the RSI are neutral to bullish signaling that sideways to higher prices are possible near-term. Closes above the 20-day moving average crossing at 33,530.60 would signal that a short-term low has been posted. Closes below the May 4th low crossing at 32,937.50 would renew the decline off May's high while opening the door for additional weakness near-term. First resistance is the 20-day moving average crossing at 33,530.60. Second resistance is May's high crossing at 34,257.83. First support is the May 4th low crossing at 32,937.50. Second support is the 38% retracement level of the 2022 rally crossing at 32,399.25.
The June NASDAQ 100 closed lower on Friday as it consolidated the rally off January's low. The low-range close sets the stage for a steady to lower opening when Monday's day session begins trading. Stochastics and the RSI are overbought but remain neutral to bullish signaling sideways to higher prices are possible. If June extends this year's rally, the 75% retracement level of the 2022-decline crossing at 14,245.67 is the next upside target. Closes below the 20-day moving average crossing at 13,322.27 would signal that a short-term top has been posted. First resistance is today's high crossing at 13,960.25. Second resistance is the 75% retracement level of the 2022-decline crossing at 14,245.01. First support is the 20-day moving average crossing at 13,322.27. Second support is the 50-day moving average crossing at 13,069.19.
The June S&P 500 closed lower on Friday. The low-range close sets the stage for a steady to lower opening when Monday's day session begins trading. Stochastics and the RSI are neutral to bullish signaling that sideways to higher prices are possible near-term. If June extends the rally off March's low, the February 14th high crossing at 4223.00 is the next upside target. Closes below the 50-day moving average crossing at 4097.31 would confirm that a short-term top has been posted. First resistance is today's high crossing at 4227.25. Second resistance is the February 14th high crossing at 4223.00. First support is the 20-day moving average crossing at 4145.14. Second support is the 50-day moving average crossing at 4097.35.
INTEREST RATES? http://quotes.ino.com/ex?changes/?c=interest ""
June T-bonds closed down 20/32's at 127-09.
June T-bonds closed lower on Friday as it extends the decline off April's high. The low-range close sets the stage for a steady to lower opening when Monday's day session begins trading. Stochastics and the RSI are oversold but remain neutral to bearish signaling that sideways to lower prices are possible near-term. If June extends the decline off April's high, the 50% retracement level of the October-January rally crossing at 126-10 is the next upside target. Closes above the 50-day moving average crossing at 130-30 would confirm that a short-term low has been posted. First resistance is the May 11th high crossing at 132-08. Second resistance is the May 4thhigh crossing at 133-00. First support is today's low crossing at 126-26. Second support is the 50% retracement level of the October-January rally crossing at 126-10.
June T-notes closed down 95-pts. At 113.200.
June T-notes closed lower on Friday as it extends this month's decline. The low-range close sets the stage for a steady to lower opening when Monday's day session begins trading. Stochastics and the RSI are oversold but remain neutral to bearish signaling that sideways to lower prices are possible near-term. If June extends the decline off May's high, the 62% retracement level of the 2022-2023 rally crossing at 112.157 is the next downside target. Closes above the 20-day moving average crossing at 115.071 would signal that a short-term low has been posted. First resistance is the May 11th high crossing at 116.160. Second resistance is May's high crossing at 117.000. First support is the 50% retracement level of the 2022-2023 rally crossing at 113.116. Second support is the 62% retracement level of the 2022-2023 rally crossing at 112.157.
ENERGY MARKETS? http://quotes.ino.com/ex?changes/?c=energy ""
June crude oil posted a key reversal down and closed lower on Friday. The low-range close sets the stage for a steady to lower opening when Monday's day session begins. Stochastics and the RSI are neutral to bullish signaling that sideways to higher prices are possible near-term. Closes above the 50-day moving average crossing at $74.57 would confirm that a short-term low has been posted. If June resumes the decline off last-week's high, the March 24th low crossing at $67.02 is the next downside target. First resistance is the 50-day moving average crossing at $74.57. Second resistance is the April 23th high crossing at $79.18. First support is the March 24th low crossing at $67.02. Second support is the May 4thlow crossing at $63.64.
June heating oil posted a key reversal down and closed lower on Friday. The low-range close sets the stage for a steady to lower opening when Tuesday's day trading session begins. Stochastics and the RSI are overbought but remain neutral to bullish signaling that sideways to higher prices are possible near-term. If June extends this month's rally, the 50-day moving average crossing at $2.4834 is the next upside target. Closes below Monday's low crossing at $2.2812 would signal that a short-term top has been posted. First resistance is the 50-day moving average crossing at $2.4834. Second resistance is April's high crossing at $2.7095. First support is Monday's low crossing at $2.2812. Second support is the May 4th low crossing at $2.1500.
June unleaded gas closed slightly higher on Friday and above the 50-day moving average crossing at 2.5603 as it extends this month's rally. The low-range close sets the stage for a steady to slightly higher opening when Monday's day session begins trading. Stochastics and the RSI are overbought but remain neutral to bullish signaling that sideways to higher prices are possible near-term. If June extends the rally off May's low, the 75% retracement level of the April-May decline crossing at 2.6834 is the next upside target. Closes below Monday's low crossing at 2.4017 would signal that a short-term top has been posted. First resistance is the April 25th high crossing at 2.6295. Second resistance is the 75% retracement level of the April-May decline crossing at 2.6834. First support is Monday's low crossing at 2.4017. Second support is May's low crossing at 2.2500.
June Henry natural gas closed slightly higher on Friday as it extends this week's rally. The low-range close sets the stage for a steady to lower opening when Monday's day session begins trading. Stochastics and the RSI are becoming overbought but remain neutral to bullish signaling that sideways to higher prices are possible near-term. If June extends this week's rally, the 25% retracement level of the 2022-2023 decline crossing at 2.877 is the next upside target. If June renews the decline off March's high, monthly support crossing at 1.795 is the next downside target.First resistance is today's high crossing at 2.685. Second resistance is the 25% retracement level of the 2022-2023 decline crossing at 2.877. First support is the May 12th low crossing at 2.147. Second support is the May 5th low crossing at 2.031.
CURRENCIES? http://quotes.ino.com/ex?changes/?c=currencies ""
The June Dollar closed lower on Friday as it consolidates some of the rally off May's low. The low-range close sets the stage for a steady to lower opening when Monday's session begins trading. Stochastics and the RSI are overbought but remain neutral to bullish signaling that sideways to higher prices are possible near-term. If June extends the rally off May's low, the March 15th high crossing at 104.720 is the next upside target. Closes below the 20-day moving average crossing at 101.780 would signal that a short-term top has been posted. First resistance is the 25% retracement level of the September-February decline crossing at $103.586. Second resistance is the March 15th high crossing at 104.720. First support is the 20-day moving average crossing at 101.780. Second support is May's low crossing at 100.520.
The June Euro closed higher on Friday as it consolidated some of this month's decline. The high-range close sets the stage for a steady to higher opening when Monday's day session begins trading. Stochastics and the RSI are oversold but remain neutral to bearish signaling that sideways to lower prices is possible near-term. If June extends this month's decline, the 38% retracement level of the 2022-2023 rally crossing at $1.05914 is the next downside target. Closes above the 20-day moving average crossing at $1.09792 would signal that a short-term low has been posted. First resistance is the 20-day moving average crossing at $1.09792. Second resistance is the April 14th high crossing at 1.11145. First support is the 25% retracement level of the 2022-2023 rally crossing at $1.07774. Second support is the 38% retracement level of the 2022-2023 rally crossing at $1.05914.
The June British Pound closed higher on Friday as it consolidates above the 50-day moving average crossing at 1.2430. The mid-range close sets the stage for a steady to higher opening when Monday's day session begins trading. Stochastics and the RSI are oversold but remain neutral to bearish signaling sideways to lower prices are possible near-term. If June extends the decline off May's high, April's low crossing at 1.2293 is the next downside target. Closes above the 20-day moving average crossing at 1.2528 would signal that a short-term low has been posted. First resistance is the 20-day moving average crossing at 1.2528. Second resistance is May's high crossing at 1.2692. First support is the April 10th low crossing at 1.2364. Second support is April's low crossing at 1.2293.
The June Swiss Franc closed higher on Friday as it consolidated some of the decline off May's high. The high-range close sets the stage for a steady to higher opening when Monday's day session begins trading. Stochastics and the RSI are oversold but remain neutral to bearish signaling that sideways to lower prices are possible near-term. If June extends this week's decline, the April 3rd low crossing at 1.09640 is the next downside target. Closes above the 20-day moving average crossing at 1.12483 would signal that a short-term low has been posted. First resistance is the 20-day moving average crossing at 1.12483. Second resistance is the May 4th high crossing at 1.13940. First support is the April 10th low crossing at 1.10495. Second support is the April 3rd low crossing at 1.09640.
The June Canadian Dollar closed slightly higher on Friday. The low-range close sets the stage for a steady to slightly higher opening when Monday's day session begins trading. Stochastics and the RSI have turning neutral to bearish signaling that sideways to lower prices are possible near-term. Close below the 50-day moving average crossing at 73.95 would open the door for a possible test of April's low. If June renews the rally off April's low, May's high crossing at 75.18 is the next upside target. First resistance is the 10-day moving average crossing at 74.36. Second resistance is May's high crossing at 75.18. First support is the 50-day moving average crossing at 73.95. Second support is April's low crossing at 73.23.
The June Japanese Yen closed higher on Friday as it consolidated some of the decline off January's high. The mid-range close sets the stage for a steady to higher opening when Monday’s day session begins trading. Stochastics and the RSI are oversold but remain neutral to bearish signaling that sideways to lower prices are possible near-term. If June extends the decline off March's high, the 75% retracement level of the October-January rally crossing at 0.071337 is the next downside target. Closes above the 20-day moving average crossing at 0.074230 would signal that a short-term low has been posted. First resistance is the 20-day moving average crossing at 0.074230. Second resistance is the 50-day moving average crossing at 0.075433. First support is the 75% retracement level of the October-January rally crossing at 0.071337. Second support is the 87% retracement level of the October-January rally crossing at 0.069908.
PRECIOUS METALS? http://quotes.ino.com/ex?changes/?c=metals ""
June gold posted an inside day with a higher close on Friday as it consolidates some of the decline off May's high. The high-range close sets the stage for a steady to higher opening when Monday's day session begins trading. Stochastics and the RSI are oversold but remain neutral to bearish signaling that sideways to lower prices are possible near-term. If June extends this month's decline, the 38% retracement level of the 2022-2023 rally crossing at $1925.20. Closes above the 20-day moving average crossing at $2011.20 would signal that a short-term low has been posted. First resistance is the 20-day moving average crossing at $2011.20. Second resistance is May's high crossing at $2085.40. First support is the March 22nd low crossing at $1953.70. Second support is the 38% retracement level of the 2022-2023 rally crossing at $1925.20.
July silver closed higher on Friday as it consolidates some of the decline off May's high. The high-range close sets the stage for a steady to higher opening when Monday's day session begins trading. Stochastics and the RSI are oversold but remain neutral to bearish signaling that sideways to lower prices are possible near-term. If July extends this month's decline, the 50% retracement level of the March-May rally crossing at 23.289 is the next downside target. Closes above the 20-day moving average crossing at 25.023 would signal that a short-term low has been posted. First resistance is the 20-day moving average crossing at 25.023. Second resistance is May's high crossing at 26.435. First support is Thursday's low crossing at 23.485. Second support is the 50% retracement level of the March-May rally crossing at 23.289.
July copper closed higher on Friday as it extends this week's trading range. The mid-range close sets the stage for a steady to higher opening when Monday's day session begins trading. Stochastics and the RSI are oversold but remain neutral to bearish signaling that sideways to lower prices are possible near-term. If July extends the decline off April's high, the 62% retracement level of the 2022-2023 rally crossing at 3.6247 is the next downside target. Closes above the 20-day moving average crossing at 3.8276 would signal that a low has been posted. First resistance is the 20-day moving average crossing at 3.8276. Second resistance is the 50-day moving average crossing at 3.95. First support is the 62% retracement level of the 2022-2023 rally crossing at 3.6247. Second support is the 75% retracement level of the 2022-2023 rally crossing at 3.4683.
GRAINS? http://quotes.ino.com/ex?changes/?c=grains "
July Corn closed down $0.00 3/4-cents at $5.54 1/2.
July corn closed lower on Friday and extends this month's decline. The low-range close sets the stage for a steady to lower opening when Monday's night session begins trading. Stochastics and the RSI are neutral to bearish signaling that sideways to lower prices are possible near-term. If July extends the decline off April's high, the November-2021 low crossing at $5.41 1/2 is the next downside target. Closes above the 20-day moving average crossing at $5.85 1/2 would signal that a short-term low has been posted. First resistance is the 20-day moving average crossing at $5.85 1/2. Second resistance is the May 8th high crossing at $6.00. First support is Thursday's low crossing at $5.47. Second support is the November-2021 low crossing at $5.41 1/2.
July wheat closed down $0.06 3/4-cents at $6.05.
July wheat closed lower on Friday as it extends this week's decline. The low-range close sets the stage for a steady to lower opening when Monday's day session begins trading. Stochastics and the RSI are neutral to bearish signaling signaling that sideways to lower prices are possible near-term. If July renews the decline off February's high, the March-2021 low crossing at $5.71 is the next downside target. Closes above the 50-day moving average crossing at $6.73 would signal that a short-term low has been posted while opening the door for additional short-covering gains. First resistance is the 50-day moving average crossing at $6.73. Second resistance is the April 18th high crossing at $7.17 1/4. First support is today's low crossing at $6.02. Second support is the March-2021 low crossing at $5.71.
July Kansas City Wheat closed down $0.32 3/4-cents at $8.24 1/4.
July Kansas City wheat closed sharply lower on Friday as it extends this week's decline. The low-range close sets the stage for a steady to lower opening when Monday's day session begins trading. Stochastics and the RSI have turned neutral to bearish signaling that sideways to lower prices are possible near-term. Closes below the 20-day moving average crossing at $8.24 3/4 would signal that a short-term top has been posted. If July renews the rally off May's low, the 50% retracement level of the 2022-2023 decline crossing at $9.73 1/4 is the next upside target. First resistance is the 38% retracement level of the 2022-2023 decline crossing at $9.17 1/4. Second resistance is the 50% retracement level of the 2022-2023 decline crossing at $9.73 1/4. First support is the 50-day moving average crossing at $8.31 1/4. Second support is the 20-day moving average crossing at $8.24 3/4.
July Minneapolis wheat closed down $0.24 1/2-cents crossing at $8.04.
July Minneapolis wheat closed sharply lower for the Third-day in a row on Friday as it extends this week's decline. The low-range close sets the stage for a steady to lower opening when Monday's day session begins trading. Stochastics and the RSI have turned bearish signaling that sideways to lower prices are possible near-term. If July extends this week's decline, May's low crossing at $8.69 is the next downside target. Closes above the 50-day moving average crossing at $8.49 would signal that a short-term low has been posted. First resistance is Wednesday's high crossing at $8.58 Second resistance is the April 18th high crossing at $8.95 1/4. First support is today's low crossing at $8.02 1/4. Second support is May's low crossing at $8.69.
SOYBEAN COMPLEX? http://quotes.ino.com/ex?changes/?c=grains "
July soybeans closed down $0.26-cents at $13.07 1/4.
July soybeans closed lower for the fourth-day in a row on Friday as it posted a new low for the year. If July extends this week's decline, . The low-range close sets the stage for a steady to lower opening when Friday's day session begins trading. Stochastics and the RSI are oversold but remain neutral to bearish signaling that sideways to lower prices are possible near-term. If July extends the decline off April's high, the July-22nd -2022 low crossing at $12.99 is the next downside target. Closes above the 20-day moving average crossing at $13.99 1/4 would signal that a low has been posted. First resistance is the 10-day moving average crossing at $13.78 3/4. Second resistance is the 20-day moving average crossing at $13.99 1/4. First support is today's low crossing at $13.04 3/4. Second support is the July-22nd -2022 low crossing at $12.99.
July soybean meal closed down $5.00 at $409.10.
July soybean meal closed lower on Friday and posted a new low for the year. The low-range close sets the stage for a steady to lower opening when Monday's day session begins trading. Stochastics and the RSI are neutral to bearish signaling that sideways to lower prices are possible near-term. If July extends the decline off March's high, the 50% retracement level of the 2020-2023 rally crossing at $388.80 is the next downside target. Closes above Monday's high crossing at $442.30 would signal that a short-term low has been posted. First resistance is Monday's high crossing at $442.30. Second resistance is the 50-day moving average crossing at $444.00. First support is today's low crossing at $408.60. Second support is the 50% retracement level of the 2020-2023 rally crossing at $388.80.
July soybean oil closed down 2-pts. at 47.27.
July soybean oil closed slightly lower on Friday. The low-range close sets the stage for a steady to slightly lower opening when Monday's day session begins trading. Stochastics and the RSI are oversold but remain neutral to bearish signaling that sideways to lower prices are possible near-term. If July extends this month's decline, the 75% retracement level of the 2020-2022 rally crossing at 40.19 is the next downside target. Closes above the 20-day moving average crossing at 51.02 would signal that a low has been posted. First resistance is the 20-day moving average crossing at 51.02. second support is the 50-day moving average crossing at 53.59. First support is Wednesday's low crossing at 45.75. Second support is the 75% retracement level of the 2020-2022 rally crossing at 40.19.
LIVESTOCKhttp://quotes.ino.com/exchanges/?c=livestock
June hogs closed down $2.15 at $83.15.
June hogs closed lower on Friday. The low-range close sets the stage for a steady to lower opening when Monday's day session begins trading. Stochastics and the RSI have turned neutral to bearish signaling that sideways to lower prices are possible near-term. If June resumes this year's decline, weekly support on the continuation chart crossing at $80.99 is the next downside target. If June renews the rally off May's low, the 50-day moving average crossing at $89.26 is the next upside target. First resistance is the 50-day moving average crossing at $89.20 Second resistance is the April 28th high crossing at $92.00. First support is May's low crossing at $82.73. Second support is weekly support on the continuation chart crossing at $80.99.
June cattle closed up $0.38 at $165.90.
June cattle closed higher on Friday as it extends the rally off May's low. The high-range close sets the stage for a steady to higher opening on Monday. Stochastics and the RSI are overbought but remain neutral to bullish signaling that sideways to higher prices are possible near-term. If June extends the rally off May's low, the January-2014 high on the monthly continuation chart crossing at $171.65 is the next upside target. Closes below Wednesday's low crossing at $162.93 would signal that a short-term top has been posted. First resistance is April's high crossing at $166.28. Second resistance is the January-2014 high on the monthly continuation chart crossing at $171.65. First support is the 20-day moving average crossing at $163.90. Second support is the 50-day moving average crossing at $161.82.
August Feeder cattle closed up $0.60 at $235.10.
August Feeder cattle closed higher on Friday as it extends the rally off the May 8th low. The high-range close sets the stage for a steady to higher opening when Monday's day session begins trading. Stochastics and the RSI are overbought but remain neutral to bullish signaling that sideways to higher prices are possible near-term. If August extends the rally off May's low, the October-2014 high on the monthly continuation chart crossing at $245.20 is the next upside target. Closes below the 20-day moving average crossing at $228.46 would temper the near-term friendly outlook. First resistance is today's high crossing at $235.73. Second resistance is the October-2014 high on the monthly continuation chart crossing at $245.20. First support is the 20-day moving average crossing at $228.46. Second support is the 50-day moving average crossing at $223.43.
FOOD & FIBERhttp://quotes.ino.com/ex changes/?c=food
July coffee closed sharply higher on Friday as it extends the trading range of the past three-weeks. The high-range close sets the stage for a steady to higher opening on Monday. Stochastics and the RSI have turned neutral to bullish signaling sideways to higher prices are possible near-term. Closes above Tuesday's high crossing at $19.30 would mark an upside breakout of the aforementioned trading range while opening the door for additional short covering gains. Closes below last-Friday's low crossing at $18.06 would renew the decline off April's high thereby opening the door for additional weakness near-term. First resistance is Tuesday's high crossing at $19.30. Second resistance is April's high crossing at $20.49. First support is last-Friday's low crossing at $18.06. Second support is the January-April uptrend line crossing near $17.89.
July cocoa closed sharply higher on Friday as it extends this year's rally. The high-range close sets the stage for a steady to higher opening on Monday. Stochastics and the RSI are neutral to bullish signaling that sideways to higher prices are possible near-term. If July renews the rally off March's low, monthly resistance crossing at 32.15 is the next upside target. Closes below the 50-day moving average crossing at 28.87 would confirm that a short-term top has been posted.
July sugar closed higher on Friday as it extends the trading range of the past four-weeks. The low-range close sets the stage for a steady to slightly higher opening on Monday. Stochastics and the RSI are neutral to bearish signaling that sideways to lower prices are possible near-term. Closes below the May 3rd low crossing at 24.88 would mark a downside breakout of the aforementioned trading range while opening the door for additional weakness near-term. If July renews the rally off October's low, weekly resistance on the continuation chart crossing at 29.36 is the next upside target.
July cotton closed slightly higher on Friday as it extends the rally off March's low. The low-range close sets the stage for a steady to slightly higher opening on Monday. Stochastics and the RSI are overbought but remain neutral to bullish signaling that sideways to higher prices are possible near-term. If July extends the rally off April's low, the January 26th high crossing at 89.59 is the next upside target. Closes below the 50-day moving average crossing at 81.50 would signal that a short-term top has been posted.
Thanks very much tallpine!
I think the next important market mover may be dry weather evolving in large parts of the Cornbelt.
The heavy rains in drought areas of the Plains this week were too bearish to overcome.
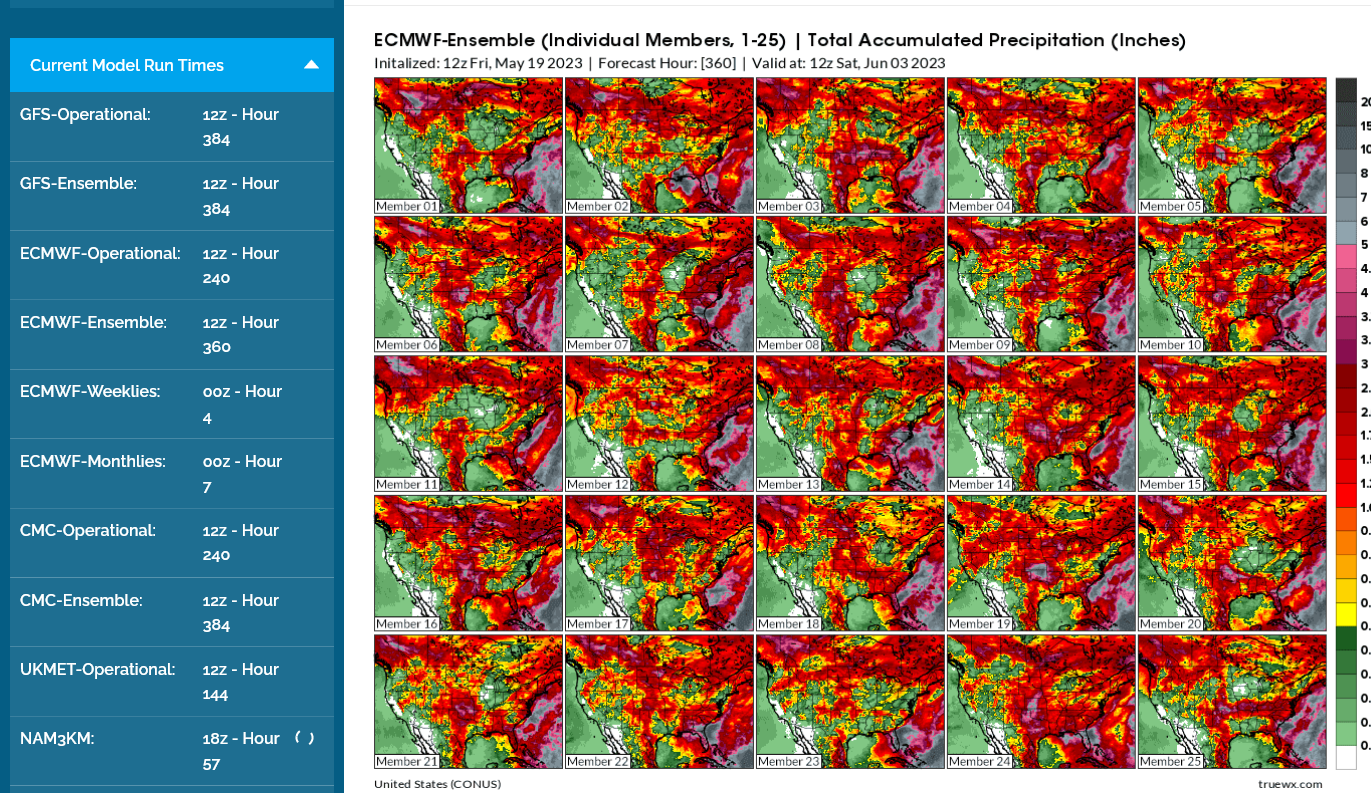
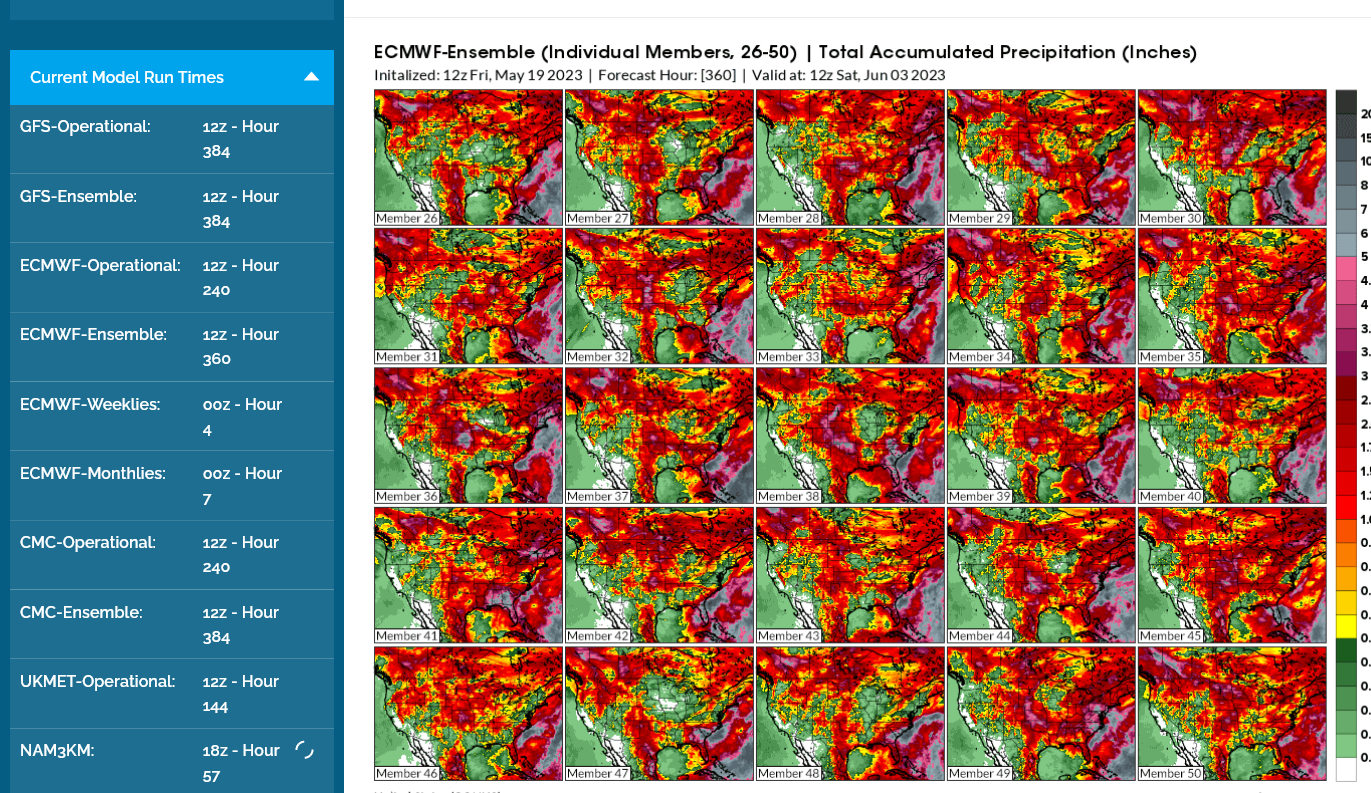
The European model is the driest right now.
This was the 12z run that just came out with each variation included, instead of just the average of all of them.
Numerous solutions have almost no rain in this area for the next 2 weeks =360 hours.
Maybe the dry weather pattern will break on forecast maps next week that can predict out to early June. This is what models were trying to do the last few days and it make the weather forecast bearish.
But they've adjusted and are drier here on Friday, especially the European model below.
It this continues, with still no rain in the forecast for the same areas next week, unless there's some powerful other bearish element, C and S should be higher next week!