KEY EVENTS TO WATCH FOR:
Thursday, June 1, 2023
7:30 AM ET. May Challenger Job-Cut Report
Job Cuts, M/M% (previous -25%)
8:15 AM ET. May ADP National Employment Report
Private Sector Jobs, Net Chg (previous +296000)
8:30 AM ET. Unemployment Insurance Weekly Claims Report - Initial Claims
Jobless Claims (previous 229K)
Jobless Claims, Net Chg (previous +4K)
Continuing Claims (previous 1794000)
Continuing Claims, Net Chg (previous -5K)
8:30 AM ET. 1st Quarter Revised Productivity and Costs
Non-Farm Productivity (previous +1.7%)
Unit Labor Costs (previous +3.2%)
9:45 AM ET. May US Manufacturing PMI
PMI, Mfg (previous 50.2)
10:00 AM ET. April Construction Spending - Construction Put in Place
New Construction (previous +0.3%)
Residential Construction
10:00 AM ET. May ISM Report On Business Manufacturing PMI
Manufacturing PMI (previous 47.1)
Prices Idx (previous 53.2)
Employment Idx (previous 50.2)
Inventories (previous 46.3)
New Orders Idx (previous 45.7)
Production Idx (previous 48.9)
10:30 AM ET. EIA Weekly Natural Gas Storage Report
Working Gas In Storage (Cbf) (previous 2336B)
Working Gas In Storage, Net Chg (Cbf) (previous +96B)
11:00 AM ET. EIA Weekly Petroleum Status Report
Crude Oil Stocks (Bbl) (previous 455.168M)
Gasoline Stocks (Bbl) (previous 216.277M)
Gasoline Stocks, Net Chg (Bbl) (previous -2.053M)
Distillate Stocks (Bbl) (previous 105.672M)
Distillate Stocks, Net Chg (Bbl) (previous -0.561M)
Refinery Usage (previous 91.7%)
Total Prod Supplied (Bbl/day) (previous 20.701M)
Total Prod Supplied, Net Chg (Bbl/day) (previous +1.143M)
11:00 AM ET. May Global Manufacturing PMI
PMI, Mfg (previous 49.6)
12:00 PM ET. May Monthly U.S. Retail Chain Store Sales Index
4:00 PM ET. May Domestic Auto Industry Sales
4:30 PM ET. Foreign Central Bank Holdings
4:30 PM ET. Federal Discount Window Borrowings
Friday, June 2, 2023
8:30 PM ET. U.S. Weekly Export Sales
8:30 PM ET. May U.S. Employment Report
Non-Farm Payrolls (previous +253K)
Unemployment Rate (previous 3.4%)
Avg Hourly Earnings (USD) (previous 33.36)
Avg Hourly Earnings-Net Chg (USD) (previous +0.16)
Avg Hourly Earnings, M/M% (previous +0.48%)
Avg Hourly Earnings, Y/Y% (previous +4.45%)
Overall Workweek (previous 34.4)
Overall Workweek Net Chg (previous +0)
Government Payrolls (previous +23K)
Private Payroll (previous +230K)
Participation Rate (previous 62.6%)
Non-Farm Payrolls Bench Net Chg
N/A ABA Economic Advisory Committee economic forecast
The STOCK INDEXES? http://quotes.ino.com/ex?changes/?c=indexes
The STOCK INDEXES: The June NASDAQ 100 was higher overnight as it consolidates some of Thursday's decline. Overnight trading set the stage for a higher opening when the day session begins trading. Stochastics and the RSI are overbought but are neutral to bullish signaling that sideways to higher prices are possible near-term. If June extends this year's rally, the 87% retracement level of the 2022-decline crossing at 14,801.49 is the next upside target. Closes below the 20-day moving average crossing at 13,709.05 would signal that a short-term top has been posted. First resistance is the 87% retracement level of the 2022-decline crossing at 14,801.49. Second resistance is the March-2022 high crossing at 15,407.50. First support is the 20-day moving average crossing at 13,709.05. Second support is the 50-day moving average crossing at 13,328.85.
The June S&P 500 was higher overnight as it consolidates some of Wednesday's losses. Overnight trading sets the stage for a higher opening when the day session begins trading. Stochastics and the RSI are turning neutral to bearish signaling that sideways to lower prices are possible near-term. Closes below the 20-day moving average crossing at 4163.76 would signal that a short-term top has been posted. Closes above February's high crossing at 4244.00 would open the door for a possible test of the August-2022 high crossing at 4382.75. First resistance is February's high crossing at 4244.00. Second resistance August's high crossing at 4382.75. First support is the 20-day moving average crossing at 4163.76. Second support is the 50-day moving average crossing at 4134.30.
INTEREST RATES http://quotes.ino.com/ex changes/?c=interest"
INTEREST RATES: September T-bonds were higher overnight as they consolidates some of the decline off April's high. Overnight trading sets the stage for a higher opening when the day session begins trading. Stochastics and the RSI are neutral to bullish signaling that sideways to higher prices are possible near-term. Closes above the 20-day moving average crossing at 128-28 would signal that a short-term low has been posted. If September extends the decline off April's high, the 87% retracement level of the March-April rally crossing at 124-19 is the next downside target. First resistance is the 20-day moving average crossing at 128-28. Second resistance is the 50-day moving average crossing at 130-14. First support is the 75% retracement level of the March-April rally crossing at 125-30. Second support is the 87% retracement level of the March-April rally crossing at 124-19.
September T-notes were lower overnight as it consolidates some of this week's rally. Overnight trading sets the stage for a lower opening when the day session begins trading. Stochastics and the RSI are turning neutral to bullish signaling that sideways to higher prices are possible near-term. Closes above last-Thursday's high crossing at 114.185 would signal that a short-term low has been posted. If September extends this month's decline, the 75% retracement level of the March-May rally crossing at 112.190 is the next downside target. First resistance is last-Thursday's high crossing at 114.185. Second resistance is the 20-day moving average crossing at 115.070. First support is the 75% retracement level of the March-May rally crossing at 112.190. Second support is the 87% retracement level of the 2022-2023 rally crossing at 111.243.
ENERGY MARKETS? http://quotes.ino.com/ex?changes/?c=energy ""
ENERGIES:Julycrude oil was lower overnight as it extends this week's decline. Overnight trading sets the stage for a lower opening when the day session begins trading. Stochastics and the RSI are oversold but remain neutral to bearish signaling that sideways to lower prices are possible near-term. If July extends this week's decline, May's low crossing at $63.90 is the next downside target. Closes above the 20-day moving average crossing at $71.37 would signal that a short-term low has likely been posted while opening the door for a possible test of the 50-day moving average crossing at $74.54. First resistance is the May 24th high crossing at $74.73. Second resistance is the April 28th high crossing at $76.74. First support is the March low crossing at $64.67. Second support is the May low crossing at $63.90.
July heating oil was slightly lower overnight as it extends the decline off May's high. Overnight trading sets the stage for a lower opening when the day session begins trading. Stochastics and the RSI are oversold but remain neutral to bearish signaling that sideways to lower prices are possible near-term. If July extends this week's decline, May's low crossing at 2.1550 is the next downside target. Closes above the 20-day moving average crossing at 2.3391 would signal that a short-term low has been posted. First resistance is the 20-day moving average crossing at 2.3391. Second resistance is the 50-day moving average crossing at 2.4420. First support is Wednesday's low crossing at 2.2268. Second support is May's low crossing at 2.1550.
July unleaded gas was lower overnight as it extends this week's decline. Overnight trading sets the stage for a lower opening when the day session begins trading. Stochastics and the RSI are bearish signaling that sideways to lower prices are possible near-term. If July extends this week's decline, the May 15th low crossing at 2.3565 is the next downside target. Closes above the 50-day moving average crossing at $2.5273 would signal that a short-term low has been posted. First resistance is the 50-day moving average crossing at $2.5273. Second resistance is the 75% retracement level of the April-May decline crossing at $2.6308. First support is the May 15th low crossing at $2.3565. Second support ms March's low crossing at $2.2872.
July natural gas was slightly lower overnight and sets the stage for a lower opening when the day session begins trading. Stochastics and the RSI are oversold but remain neutral to bearish signaling that sideways to lower prices are possible near-term. If July extends the decline off May's high, May's low crossing at 2.233 is the next downside target. Closes above the 50-day moving average crossing at 2.543 would signal that a short-term low has been posted. First resistance is the May 19th high crossing at 2.816. Second resistance is the 25% retracement level of the 2022-2023 decline crossing at 3.189. First support is the overnight low crossing at 2.240. Second support is the May 5th low crossing at 2.233.
CURRENCIEShttp://quotes.ino.com/ex changes/?c=currencies"
CURRENCIES:The June Dollar was lower overnight. Overnight trading and sets the stage for a lower opening when the day session begins trading later this morning. Stochastics and the RSI are overbought but remain neutral to bullish signaling that sideways to higher prices are possible near-term. If June extends the rally off May's low, the March 15th high crossing at $104.720 is the next upside target. Closes below the 20-day moving average crossing at $102.908 would signal that a short-term top has been posted. First resistance is the March 15th high crossing at $104.720. Second resistance is the 38% retracement level of the 2022-2023 decline crossing at $105.309.First support is the 10-day moving average crossing at $103.810. Second support is the 20-day moving average crossing at $102.908.
The June Euro was higher overnight as it consolidates some of this week's decline. Overnight trading sets the stage for a higher opening when the day session begins trading. Stochastics and the RSI are oversold but remain neutral to bearish signaling that sideways to lower prices are possible near-term. If June extends this month's decline, the 38% retracement level of the 2022-2023 rally crossing at 1.05914 is the next downside target. Closes above the 20-day moving average crossing at $1.08603 would signal that a short-term low has been posted. First resistance is the 10-day moving average crossing at $1.07622. Second resistance is the 20-day moving average crossing at $1.08603. First support is the 38% retracement level of the 2022-2023 rally crossing at 1.05914. Second support is the 50% retracement level of the 2022-2023 rally crossing at 1.04252.
The June British Pound was higher overnight and sets the stage for a higher opening when the day session begins trading. Stochastics and the RSI are neutral to bullish signaling that sideways to higher prices near-term. Closes above the 20-day moving average crossing at 1.2487 would signal that a short-term low has been posted. If June renews the decline off May's high, April's low crossing at 1.2293 is the next downside target. First resistance is the 20-day moving average crossing at 1.2487. Second resistance is the May 10th high crossing at 1.2692. First support is April's low crossing at 1.2293. Second support is the 25% retracement level of the 2022-2023 rally crossing at 1.2138.
The June Swiss Franc was higher overnight as it consolidates some of this week's decline. Overnight trading sets the stage for a higher opening when the day session begins trading. Stochastics and the RSI are oversold but remain neutral to bearish signaling that sideways to lower prices are possible near-term. If June extends the decline off May's high, the 38% retracement level of the 2022-2023 rally crossing at 1.09131 is the next downside target. Closes above the 50-day moving average crossing at 1.11696 would signal that a short-term low has been posted. First resistance is the 50-day moving average crossing at 1.11696. Second resistance is May's high crossing at 1.13940. First support is April's low crossing at 1.09640. Second support is the 38% retracement level of the 2022-2023 rally crossing at 1.09131.
The June Canadian Dollar was higher overnight as it consolidates some of the decline off May's high. Overnight trading sets the stage for a higher opening when the day session begins trading. Stochastics and the RSI are turning neutral to bullish signaling that sideways to higher prices are possible near-term. Closes above the 20-day moving average crossing at $74.10 would temper the near-term bearish outlook. If June extends the decline off April's high, the 75% retracement level of the March-April rally crossing at $73.02 is the next downside target. First resistance is the 20-day moving average crossing at $74.10. Second resistance is the May 16th high crossing at $74.66. First support is April's low crossing at $73.23. Second support is the 75% retracement level of the March-April rally crossing at $73.02.
The June Japanese Yen was slightly lower overnight and sets the stage for a slightly lower opening when the day session begins trading. Stochastics and the RSI are oversold but remain neutral to bearish signaling that sideways to lower prices are possible near-term. If June extends the decline off the March's high, the 87% retracement level of the 2022-2023 rally crossing at 0.069908 is the next downside target. Closes above the 20-day moving average crossing at 0.073195 would signal that a short-term low has been posted. First resistance is the 20-day moving average crossing at 0.073195. Second resistance is the 50-day moving average crossing at 0.074719. First support is the 75% retracement level of the 2022-2023 rally crossing at 0.071337. Second support is the 87% retracement level of the 2022-2023 rally crossing at 0.069908.
PRECIOUS METALS http://quotes.ino.com/ex changes/?c=metals"
Augustgold was steady to slightly higher overnight. Overnight trading sets the stage for a slightly higher opening when the day session begins trading later this morning. Stochastics and the RSI are turning neutral to bullish signaling that sideways to higher prices are possible near-term. Closes above the 50-day moving average crossing at $2020.40 would signal that a short-term low has been posted. If August extends the decline off May's high, the 38% retracement level of the September-May rally crossing at $1941.90 is the next downside target. First resistance is the 50-day moving average crossing at $2020.40. Second resistance is the May 4th high crossing at $2102.20. First support is the 38% retracement level of the September-May rally crossing at $1941.90. Second support is the 50% retracement level of the September-May rally crossing at $1892.30.
July silver was steady to slightly higher overnight and sets the stage for a slightly higher opening when the day session begins trading later this morning. Stochastics and the RSI are turning neutral to bullish signaling that sideways to higher prices are possible near-term. Closes above the 20-day moving average crossing at $24.266 would temper the near-term bearish outlook. If July renews the decline off May's high, the 62% retracement level of the March-April rally crossing at $22.541 is the next downside target. First resistance is the 20-day moving average crossing at $24.266. Second resistance is the 50-day moving average crossing at $26.648. First support is the 62% retracement level of the March-April rally crossing at $22.541. Second support is the 75% retracement level of the March-April rally crossing at $21.705.
July copper was higher overnight as it extends the rebound off May's low. Overnight trading sets the stage for a higher opening when the day session begins trading. Stochastics and the RSI are neutral to bullish signaling that sideways to higher prices are possible near-term. Closes above the 20-day moving average crossing at 3.7320 would signal that a short-term low has been posted while opening the door for additional short covering gains. If July renews the decline off April's high, the 75% retracement level of the 2022-2023 rally crossing at 3.4683 is the next downside target. First resistance is the 20-day moving average crossing at 3.7320. Second resistance is the 50-day moving average crossing at 3.9019. First support is the 75% retracement level of the 2022-2023 rally crossing at 3.4683. Second support is the 87% retracement level of the 2022-2023 rally crossing at 3.3261.
GRAINS http://quotes.ino.com/ex changes/?c=grains
July corn was higher overnight as weather forecast continue to flip-flop adding to market volatility. Overnight trading sets the stage for a higher opening when the day sessions begins trading. Stochastics and the RSI are overbought but remain neutral to bullish signaling that sideways to higher prices are possible near-term. Closes above the 50-day moving average crossing at $6.04 3/4 would open the door for additional short-term gains. Closes below Wednesday's low crossing at $5.77 1/2 would signal that a short-term top has been posted.First resistance is the 50-day moving average crossing at $6.04 3/4. Second resistance is May's highcrossing at $6.47 1/2. First support is Wednesday's low crossing at $5.77 1/2. Second support is May's low crossing at $5.47.
July wheat was higher overnight as it consolidates some of its recent losses. Overnight trading sets the stage for a higher opening when the day session begins trading. Stochastics and the RSI are oversold but remain neutral to bearish signaling that sideways to lower prices are possible near-term. If July extends the decline off March's high, the March-2021 low crossing at $5.71 is the next downside target. Closes above the 20-day moving average crossing at $6.25 would temper the near-term bearish outlook. First resistance is the 20-day moving average crossing at $6.25. Second resistance is the 50-day moving average crossing at $6.57 1/4. First support is Wednesday's low crossing at $5.73 1/4. Second support is the March-2021 low crossing at $5.71.
July Kansas City wheat was higher overnight as it consolidates some of the decline off May's high. Overnight trading sets the stage for a higher opening when the day session begins trading later this morning. Stochastics and the RSI are oversold but remain neutral to bearish signaling that sideways to lower prices are possible near-term. If July extends the decline off May's high, the 87% retracement level of this month's rally crossing at $7.59 3/4 is the next downside target. Closes above the 20-day moving average crossing at $8.37 3/4 would signal that a short-term low has been posted. First resistance is the 10-day moving average crossing at $8.17 1/2. Second resistance is the 20-day moving average crossing at $8.37 3/4. First support is the 87% retracement level of this month's rally crossing at $7.59 3/4. Second support is May's low crossing at $7.36 1/4.
July Minneapolis wheat was higher overnight as it consolidates some of the decline off May's high. Overnight trading sets the stage for a higher opening when the day session begins trading. Stochastics and the RSI oversold but remain neutral to bearish signaling that sideways to lower prices are possible near-term. If July extends this month's decline, May's low crossing at $7.69 is the next downside target. Closes above the 20-day moving average crossing at $8.26 1/4 would temper the near-term bearish outlook. First resistance is the 20-day moving average crossing at $8.26 1/4. Second resistance is the 50-day moving average crossing at $8.42 1/4. First support is Wednesday's low crossing at $7.75 1/2. Second support is the May 3rd low crossing at $7.69.
SOYBEAN COMPLEX? http://quotes.ino.com/ex?changes/?c=grains "
July soybeans were higher overnight as they consolidate some of their recent losses. Overnight trading sets the stage for a higher opening when the day session begins trading later this morning. Stochastics and the RSI are oversold but remain neutral to bearish signaling that sideways to lower prices are possible near-term. If July extends the decline off April's high, the 50% retracement level of the 2020-2022 rally crossing at $12.12 is the next downside target. Closes above the 20-day moving average crossing at $13.60 1/4 would signal that a short-term low has been posted. First resistance is last-Friday's high crossing at $13.43 1/2. Second resistance is the 20-day moving average crossing at $13.60 1/4. First support is Wednesday's low crossing at $12.70 3/4. Second support is the 50% retracement level of the 2020-2022 rally crossing at $12.12.
July soybean meal was higher overnight and sets the stage for a higher opening when the day session begins trading. Stochastics and the RSI are oversold but remain neutral to bearish signaling that sideways to lower prices are possible near-term. If July extends the decline off March's high, the 62% retracement level of the 2020-2023 rally crossing at $365.60 is the next downside target. Closes above the 20-day moving average crossing at $414.60 would signal that a short-term low has been posted. First resistance is the 10-day moving average crossing at $402.80. Second resistance is the 20-day moving average crossing at $414.60. First support is the 50% retracement level of the 2020-2023 rally crossing at $388.80. Second support is the 62% retracement level of the 2020-2023 rally crossing at $365.60.
July soybean oil was higher overnight as it consolidates some of its recent losses. Overnight trading sets the stage for a higher opening when the day session begins trading. Stochastics and the RSI are neutral to bearish signaling that sideways to lower prices are possible near-term. If July extends this year's decline, the 75% retracement level of the 2020-2022 rally crossing at 40.19 is the next downside target. Closes above last-Friday's high crossing at 49.66 would signal that a low has been posted while opening the door for a possible test of the 50-day moving average crossing at 52.11. First resistance is last-Friday's high crossing at 49.66. Second resistance is the 50-day moving average crossing at 52.11. First support is the 75% retracement level of the 2020-2022 rally crossing at 40.19. Second support is the 87% retracement level of the 2020-2022 rally crossing at 34.51.
https://www.marketforum.com/forum/topic/95611/#95764
By metmike - June 1, 2023, 8:05 a.m.
Re: Re: INO Morning Market Commentary
By metmike - May 31, 2023, 2:13 p.m.
Front month Beans and wheat are going to reverse higher today the way it looks.
By metmike - June 1, 2023, 8:11 a.m.
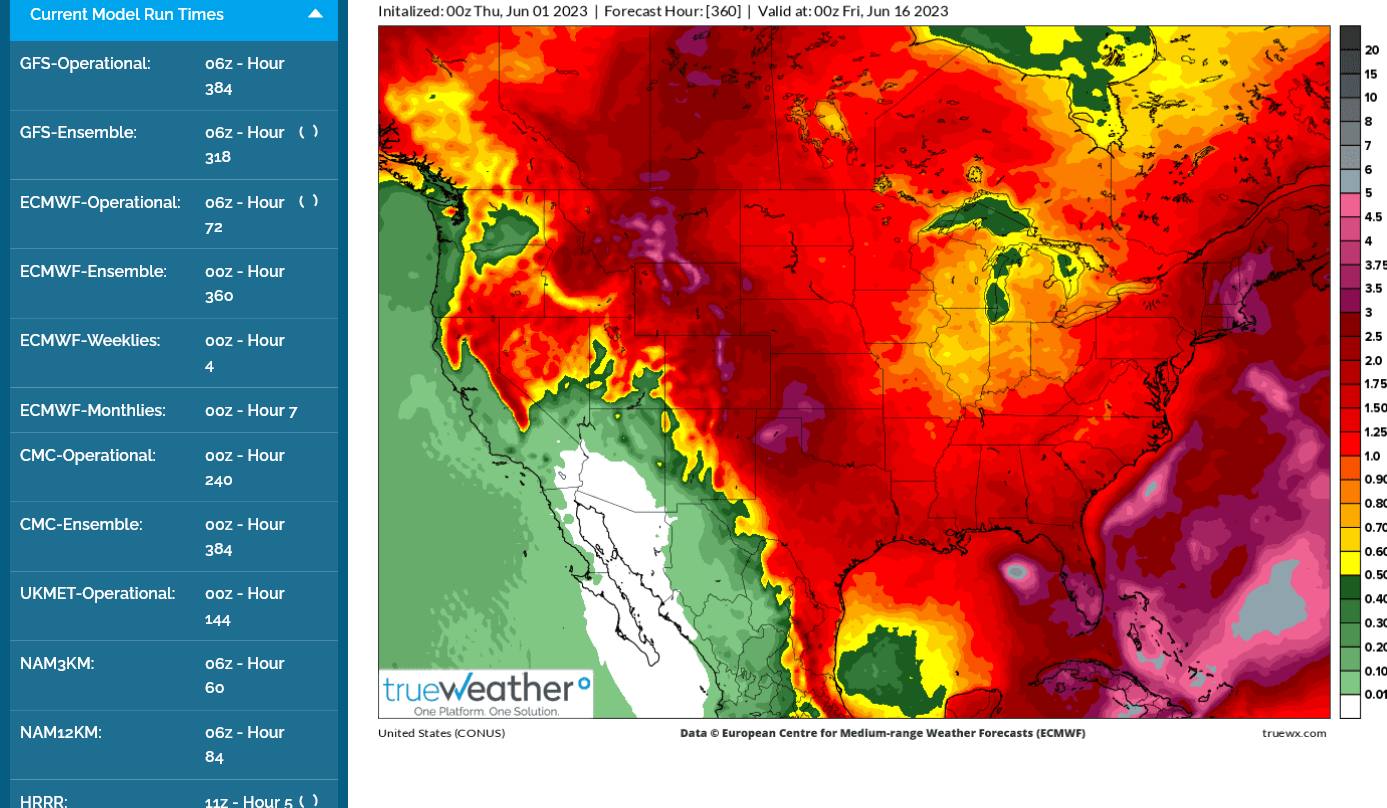
I continue to side with the much drier European ensemble model that continues to stay pretty dry thru 2 weeks(The GEFS is the wettest with almost double the rains in the Cornbelt).
None of the models show a heat ridge or dome that would completely suppress rains. So even the EE has some rain chances. This was the last 0z EE for you bulls:
8:09 am CDT: I take the last paragraph back. The NON EE models do show an upper level heat ridge building in from the south. This is part of why they are so much wetter because of more GOM moisture and jet stream energy riding on top of the ridge, tracking across the Midwest with a potential, version of a ring of fire type pattern. Lots of uncertainty in the mid-June and beyond forecast.