KEY EVENTS TO WATCH FOR:
Monday, June 5, 2023
9:45 AM ET. May US Services PMI
PMI, Services (previous 53.6)
10:00 AM ET. May ISM Report On Business Services PMI
Services PMI (previous 51.9)
Business Activity Idx (previous 52.0)
Prices Idx (previous 59.6)
Employment Idx (previous 50.8)
New Orders Idx (previous 56.1)
10:00 AM ET. May Employment Trends Index
ETI (previous 116.18)
ETI, Y/Y%
10:00 AM ET. April Manufacturers' Shipments, Inventories & Orders (M3)
Total Orders, M/M% (previous +0.9%)
Orders, Ex-Defense, M/M% (previous +1.0%)
Orders, Ex-Transport, M/M% (previous -0.7%)
Durable Goods, M/M%
Durable Goods, M/M%
11:00 AM ET. May Global Services PMI
PMI, Services (previous 55.4)
The STOCK INDEXES? http://quotes.ino.com/ex?changes/?c=indexes
The Dow gapped up and closed sharply higher on Friday as it extends the rally off May's low.Today's high-range close sets the stage for a steady to higher opening when Monday's day session begins trading. Stochastics and the RSI are neutral to bullish signaling that sideways to higher prices are possible near-term. If the Dow extends today's rally, May's high crossing at 34,257.83 is the next upside target. Closes below Thursday's low crossing at 32,704.51 would signal that a short-term top has been posted. First resistance is today's high crossing at 33,792.14. Second resistance is May's high crossing at 34,257.83. First support is May's low crossing at 32,586.56. Second support is the 38% retracement level of the October-December rally crossing at 32,399.25.
The June NASDAQ 100 closed higher on Friday and posted a new high close for the year. The high-range close sets the stage for a steady to higher opening when Monday's day session begins trading. Stochastics and the RSI are overbought but remain neutral to bullish signaling sideways to higher prices are possible. If June extends this year's rally, the 87% retracement level of the 2022-decline crossing at 14,801.49 is the next upside target. Closes below the 20-day moving average crossing at 13,794.04 would signal that a short-term top has been posted. First resistance is today's high crossing at 14,627.75. Second resistance is the 87% retracement level of the 2022-decline crossing at 14,801.49. First support is the 10-day moving average crossing at 14,120.50. Second support is the 20-day moving average crossing at 13,794.04.
The June S&P 500 closed sharply higher on Friday as it extended the rally off May's low. The high-range close sets the stage for a steady to higher opening when Monday's day session begins trading. Stochastics and the RSI are neutral to bullish signaling that sideways to higher prices are possible near-term. If June extends the rally off March's low, the 62% retracement level of 2022's decline crossing at 4321.54 is the next upside target. Closes below the 20-day moving average crossing at 4175.96 would confirm that a short-term top has been posted. First resistance is today's high crossing at 4294.75. Second resistance is the 62% retracement level of 2022's decline crossing at 4321.54. First support is the 20-day moving average crossing at 4175.99. Second support is the 50-day moving average crossing at 4141.32.
INTEREST RATES? http://quotes.ino.com/ex?changes/?c=interest ""
September T-bonds closed down 31/32's at 127-28.
September T-bonds closed lower on Friday as it consolidates some of the rally off May's low. The low-range close sets the stage for a steady to lower opening when Monday's day session begins trading. Stochastics and the RSI are neutral to bullish signaling that sideways to higher prices are possible near-term. Closes above the 20-day moving average crossing at 128-22 would confirm that a short-term low has been posted while opening the door for additional gains near-term. If September renews the decline off April's high, the 87% retracement level of the March- April rally crossing at 124-19 is the next downside target. First resistance is the 20-day moving average crossing at 128-22. Second resistance is the 50-day moving average crossing at 130-12. First support is the 75% retracement level of the March-April rally crossing at 125-30. Second support is the 87% retracement level of the March- April rally crossing at 124-19.
September T-notes closed down 290-pts. At 113.265.
June T-notes closed sharply lower on Friday as it consolidates some of this week's short covering rally. The low-range close sets the stage for a steady to lower opening when Monday's day session begins trading. Stochastics and the RSI are neutral to bullish signaling that sideways to higher prices are possible near-term. Closes above the 20-day moving average crossing at 115.021 would signal that a short-term low has been posted. If June renews the decline off May's high, the 75% retracement level of March's rally crossing at 112.190 is the next downside target. First resistance is the 20-day moving average crossing at 115.021. Second resistance is the 50-day moving average crossing at 115.206. First support is the 75% retracement level of March's rally crossing at 112.190. Second support is the 87% retracement level of March's rally crossing at 111.243.
ENERGY MARKETS? http://quotes.ino.com/ex?changes/?c=energy ""
July crude oil closed higher on Friday as it consolidated some of this week's decline. The high-range close sets the stage for a steady to higher opening when Monday's day session begins. Stochastics and the RSI are turning neutral to bullish signaling that sideways to higher prices are possible near-term. Closes above the 50-day moving average crossing at $74.61 would confirm that a short-term low has been posted. If July renews this week's decline, May's low crossing at $63.90 is the next downside target. First resistance is the 50-day moving average crossing at $74.61. Second resistance is the April 28th high crossing at $76.74. First support is Wednesday's low crossing at $67.03. Second support is May's low crossing at $63.90.
July heating oil closed higher on Friday. The high-range close sets the stage for a steady to higher opening when Monday's day trading session begins. Stochastics and the RSI have turned neutral to bullish signaling that sideways to higher prices are possible near-term. Closes above the 50-day moving average crossing at $2.4406 would signal that a short-term low has been posted. If July renews the decline off May's high, May's low crossing at $2.1550 is the next downside target. First resistance is the 50-day moving average crossing at $2.4406. Second resistance is the April 25th high crossing at $2.5326. First support is Wednesday's low crossing at $2.2268. Second support is May's low crossing at $2.1550.
July unleaded gas closed higher on Friday as it consolidates some of this week's decline. The high-range close sets the stage for a steady to higher opening when Monday's day session begins trading. Stochastics and the RSI are turning neutral to bullish signaling that sideways to higher prices are possible near-term. Closes above the 50-day moving average crossing at 2.5286 would signal that a short-term low has been posted. If July renews this week's decline, the May 15th low crossing at 2.3565 is the next downside target. First resistance is the 75% retracement level of the April-May decline crossing at 2.6803. Second resistance is the 87% retracement level crossing at 2.6979. First support is the May 15th low crossing at 2.3565. Second support is May's low crossing at 2.2132.
July Henry natural gas posted an inside day with a slightly higher close on Friday as it consolidated some of the decline off May's high. The mid-range close sets the stage for a steady to higher opening when Monday's day session begins trading. Stochastics and the RSI are oversold but remain neutral to bearish signaling that sideways to lower prices are possible near-term. If July renews the decline off March's high, the September-2020 low on the monthly continuation chart crossing at 1.795 is the next downside target. Closes above the 50-day moving average crossing at 2.529 would signal that a short-term low has been posted. First resistance is the 20-day moving average crossing at 2.436. Second resistance is the 50-day moving average crossing at 2.529. First support is Thursday's low crossing at 2.136. Second support is theSeptember-2020 low on the monthly continuation chart crossing at 1.795.
CURRENCIES? http://quotes.ino.com/ex?changes/?c=currencies ""
The June Dollar closed higher on Friday as it consolidates above the 25% retracement level of the September-February decline crossing at $103.586. The high-range close sets the stage for a steady to higher opening when Monday's session begins trading. Stochastics and the RSI are turning neutral to bearish signaling that sideways to lower prices are possible near-term. Closes below the 20-day moving average crossing at 103.032 would signal that a short-term top has been posted. If June extends the rally off May's low, the March 15th high crossing at 104.720 is the next upside target. First resistance is the March 15th high crossing at 104.720. Second resistance is the March 8th high crossing at 105.490. First support is the 20-day moving average crossing at 103.032. Second support is the 50-day moving average crossing at 102.173.
The June Euro closed lower on Friday. The low-range close sets the stage for a steady to lower opening when Monday's day session begins trading. However, stochastics and the RSI are turning neutral to bullish signaling that sideways to higher prices is possible near-term. Closes above the 20-day moving average crossing at $1.08466would signal that a short-term low has been posted. If June extends the decline off May's high, the 38% retracement level of the 2022-2023 rally crossing at $1.05914 is the next downside target. First resistance is the 20-day moving average crossing at $1.08467. Second resistance is the 50-day moving average crossing at 1.09300. First support is Wednesday's low crossing at $1.06470. Second support is the 38% retracement level of the 2022-2023 rally crossing at $1.05914.
The June British Pound closed lower on Friday as it consolidates some of this week's rally. The low-range close sets the stage for a steady to lower opening when Monday's day session begins trading. Stochastics and the RSI are neutral to bullish signaling sideways to higher prices are possible near-term. If June extends this week's rally, May's high crossing at 1.2692 is the next upside target. If June resumes the decline off May's high, the 25% retracement level of the 2022-2023 rally crossing at 1.2138 is the next downside target. First resistance is today's high crossing at 1.2549. Second resistance is May's high crossing at 1.2692. First support is May's low crossing at 1.2314. Second support is April's low crossing at 1.2293.
The June Swiss Franc closed lower on Friday. The low-range close sets the stage for a steady to lower opening when Friday's day session begins trading. Stochastics and the RSI are oversold but are turning neutral to bullish signaling that sideways to higher prices are possible near-term. Closes above the 50-day moving average crossing at 1.11701 would signal that a short-term low has been posted. If June resumes the decline off May's high, the 38% retracement level of 2022-2023 rally crossing at 1.09131 is the next downside target. First resistance is the 50-day moving average crossing at 1.11701. Second resistance is the May 4th high crossing at 1.13940. First support is the 38% retracement level of 2022-2023 rally crossing at 1.09131. Second support is the 50% retracement level of 2022-2023 rally crossing at 1.07646.
The June Canadian Dollar closed higher on Friday as it extends this week's rally off May's low. The high-range close sets the stage for a steady to higher opening when Monday's day session begins trading. Stochastics and the RSI are neutral to bullish signaling that sideways to higher prices are possible near-term. If June extends this week's rally, the May 16th high crossing at 74.66 is the next upside target. Closes below the 10-day moving average crossing at 73.88 would signal that a short-term top has been posted. First resistance is the May 16th high crossing at 74.66. Second resistance is May's high crossing at 75.18. First support is April's low crossing at 73.23. Second support is the 75% retracement level of the March-April rally crossing at 73.02.
The June Japanese Yen closed lower on Friday. The low-range close sets the stage for a steady to lower opening when Monday’s day session begins trading. Stochastics and the RSI are turning neutral to bullish signaling that sideways to higher prices are possible near-term. Closes above the 20-day moving average crossing at 0.073040 would signal that a short-term low has been posted. If June extends the decline off March's high, the 87% retracement level of the October-January rally crossing at 0.069908 is the next downside target. First resistance is the 20-day moving average crossing at 0.073040. Second resistance is the 50-day moving average crossing at 0.074608. First support is the 75% retracement level of the October-January rally crossing at 0.071337. Second support is the 87% retracement level of the October-January rally crossing at 0.069908.
PRECIOUS METALS? http://quotes.ino.com/ex?changes/?c=metals ""
August gold closed sharply lower on Friday as it ended a four-day rally. The low-range close sets the stage for a steady to lower opening when Monday's day session begins trading. Stochastics and the RSI are turning neutral to bearish signaling that sideways to lower prices are possible near-term. If August renews the aforementioned decline, the 38% retracement level of the 2022-2023 rally crossing at $1925.20. Closes above the 50-day moving average crossing at $2020.30 would signal that a short-term low has been posted. First resistance is the 20-day moving average crossing at $2007.40. Second resistance is the 50-day moving average crossing at $2020.30. First support is the 38% retracement level of the 2022-2023 rally crossing at $1941.90. Second support is the 50% retracement level of the 2022-2023 rally crossing at $1892.30.
July silver closed lower on Friday as it consolidates some of this week's rally. The low-range close sets the stage for a steady to lower opening when Monday's day session begins trading. Stochastics and the RSI are neutral to bullish signaling that sideways to higher prices are possible near-term. Closes above the 20-day moving average crossing at 24.159 would signal that a short-term low has been posted. If July renews the decline off May's high, the 62% retracement level of the March-May rally crossing at 22.541 is the next downside target. First resistance is the 20-day moving average crossing at 24.159. Second resistance is the 50-day moving average crossing at 24.670. First support is the 62% retracement level of the March-May rally crossing at 22.541. Second support is the 75% retracement level of the March-May rally crossing at 21.705.
July copper closed higher on Friday as it extends this week's rally. The mid-range close sets the stage for a steady to higher opening when Monday's day session begins trading. Stochastics and the RSI are neutral to bullish signaling that sideways to higher prices are possible near-term. Multiple closes above the 20-day moving average crossing at 3.8034 would confirm that a low has been posted. If July renews the decline off April's high, the 75% retracement level of the 2022-2023 rally crossing at 3.4383 is the next downside target. First resistance is the 20-day moving average crossing at 3.8034. Second resistance is the 50-day moving average crossing at 3.8954. First support is the 75% retracement level of the 2022-2023 rally crossing at 3.4683. Second support is the 87% retracement level of the 2022-2023 rally crossing at 3.3261.
GRAINS? http://quotes.ino.com/ex?changes/?c=grains "
July Corn closed up $0.16 1/2-cents at $6.09.
July corn closed sharply higher on Friday as it extends the rally off May's low. The high-range close sets the stage for a steady to higher opening when Monday's night session begins trading. Stochastics and the RSI are overbought but remain neutral to bullish signaling that sideways to higher prices are possible near-term. Today's close above the 50-day moving average crossing at $6.04 3/4 opens the door for additional gains near-term. Closes below Wednesday's low crossing at $5.77 1/2 would temper the near-term friendly outlook. First resistance is today's high crossing at $6.10 1/2. Second resistance is the 38% retracement level of the 2022-2023 decline crossing at $6.28. First support is Wednesday's low crossing at $5.77 1/2. Second support is May's low crossing at $5.47.
July wheat closed up $0.08 1/4-cents at $6.19.
July wheat closed higher on Friday as it extends the trading range of the past two-weeks. The high-range close sets the stage for a steady to higher opening when Monday's day session begins trading. Stochastics and the RSI are neutral to bullish signaling signaling that sideways to higher prices are possible near-term. Closes above the 20-day moving average crossing at $6.24 would signal that a short-term low has been posted while opening the door for additional short-covering gains. If July renews the decline off February's high, the March-2021 low crossing at $5.71 is the next downside target. First resistance is the 20-day moving average crossing at $6.24. Second resistance is the 50-day moving average crossing at $6.56 1/4. First support is Wednesday's low crossing at $5.73 1/4. Second support is the March-2021 low crossing at $5.71.
July Kansas City Wheat closed up $0.09 3/4-cents at $8.12 1/4.
July Kansas City wheat closed higher on Friday as it consolidates some of the decline off May's high. The high-range close sets the stage for a steady to higher opening when Monday's day session begins trading. Stochastics and the RSI are turning neutral to bullish signaling that sideways to higher prices are possible near-term. Closes above the 20-day moving average crossing at $8.38 1/2 would signal that a short-term low has been posted. If July renews the decline off May's high, the 87% retracement level of May's rally crossing at $7.59 3/4 is the next downside target. First resistance is the 10-day moving average crossing at $8.13. Second resistance is the 20-day moving average crossing at $8.38 1/2. First support is the 87% retracement level of May's rally crossing at $7.59 3/4. Second support is May's low crossing at $7.36 1/4.
July Minneapolis wheat closed up $0.18 3/4-cents crossing at $8.07 3/4.
July Minneapolis wheat closed higher on Friday as it consolidates some of the decline off May's high. The high-range close sets the stage for a steady to higher opening when Monday's day session begins trading. Stochastics and the RSI are oversold but remain neutral to bearish signaling that sideways to lower prices are possible near-term. If July extends the decline off May's high, May's low crossing at $8.69 is the next downside target. Closes above the 20-day moving average crossing at $8.26 1/4 would signal that a short-term low has been posted. First resistance is the 20-day moving average crossing at $8.26 1/4. Second resistance is the 50-day moving average crossing at $8.41 3/4. First support is Wednesday's low crossing at $7.75 1/2. Second support is May's low crossing at $7.69.
SOYBEAN COMPLEX? http://quotes.ino.com/ex?changes/?c=grains "
July soybeans closed up $0.23-cents at $13.52 1/2.
July soybeans closed higher on Friday as it consolidates some of the decline off April's high. The high-range close sets the stage for a steady to higher opening when Monday's day session begins trading. Stochastics and the RSI are neutral to bullish signaling that sideways to higher prices are possible near-term. Closes above the 20-day moving average crossing at $13.57 1/2 would signal that a low has been posted. If July extends this year's decline, the 50% retracement level of the 2020-2022 crossing at $12.12 is the next downside target. First resistance is the 20-day moving average crossing at $13.57 1/2. Second resistance is the 50-day moving average crossing at $14.11 3/4. First support is Wednesday's low crossing at $12.70 3/4. Second support is the 50% retracement level of the 2020-2022 crossing at $12.12.
July soybean meal closed down $3.80 at $397.60.
July soybean meal closed lower on Friday. The low-range close sets the stage for a steady to lower opening when Monday's day session begins trading. Stochastics and the RSI are oversold but are turning neutral to bullish signaling that sideways to higher prices are possible near-term. Closes above the 20-day moving average crossing at $413.40 would signal that a short-term low has been posted. If July renews the decline off March's high, the 62% retracement level of the 2020-2023 rally crossing at $365.60 is the next downside target. First resistance is the 20-day moving average crossing at $413.40. Second resistance is the 50-day moving average crossing at $432.70. First support is Wednesday's low crossing at $386.30. Second support is the 62% retracement level of the 2020-2023 rally crossing at $365.60.
July soybean oil closed up 164-pts. at 49.50.
July soybean oil closed higher on Friday and above the 20-day moving average crossing at 49.17 signals that a low has been posted. The high-range close sets the stage for a steady to higher opening when Monday's day session begins trading. Stochastics and the RSI are neutral to bullish signaling that sideways to higher prices are possible near-term. If July renews this year's decline, the 75% retracement level of the 2020-2022 rally crossing at 40.19 is the next downside target. First resistance is the 20-day moving average crossing at 49.17. Second resistance is the 50-day moving average crossing at 52.02. First support is Wednesday's low crossing at 44.53. Second support is the 75% retracement level of the 2020-2022 rally crossing at 40.19.
LIVESTOCKhttp://quotes.ino.com/exchanges/?c=livestock
July hogs closed up $2.43 at $84.48.
July hogs closed higher on Friday as it consolidated some of the rally off May's low. The high-range close sets the stage for a steady to higher opening when Monday's day session begins trading. Stochastics and the RSI are neutral to bearish signaling that sideways to lower prices are possible near-term. Today's close above the 20-day moving average crossing at $83.44 signals that a short-term low has been posted. Closes below Wednesday's gap crossing at $79.53 would signal that a short-term top has been posted. First resistance is the 50-day moving average crossing at $88.20 Second resistance is the April 28th high crossing at $94.00. First support is last-Friday's low crossing at $74.02. Second support is weekly support on the continuation chart crossing at $72.98.
August cattle closed up $0.75 at $173.13.
August cattle closed higher on Friday as it extends the rally off May's low. The mid-range close sets the stage for a steady to higher opening on Monday. Stochastics and the RSI are overbought but remain neutral to bullish signaling that sideways to higher prices are possible near-term. Thursday's rally eclipsed the previous all-time high that was posted in January-2014 high on the monthly continuation chart crossing at $171.65. August is now trading in uncharted territory making upside targets hard to project. Closes below the 20-day moving average crossing at $164.12 would signal that a top has been posted. First resistance is today's high crossing at $174.25. Second resistance is unknown. First support is the 10-day moving average crossing at $166.49. Second support is the 20-day moving average crossing at $164.12.
August Feeder cattle closed up $0.10 at $241.75.
August Feeder cattle closed slightly higher on Friday. The low-range close sets the stage for a steady to lower opening when Monday's day session begins trading. Stochastics and the RSI are overbought but remain neutral to bullish signaling that sideways to higher prices are possible near-term. If August extends the rally off May's low, the October-2014 high on the monthly continuation chart crossing at $245.20 is the next upside target. Closes below the 20-day moving average crossing at $232.30 would signal that a short-term top has been posted. First resistance is today's high crossing at $243.80. Second resistance is the October-2014 high on the monthly continuation chart crossing at $245.20. First support is the 20-day moving average crossing at $232.30. Second support is the 50-day moving average crossing at $227.34.
FOOD & FIBERhttp://quotes.ino.com/ex changes/?c=food
July coffee closed lower as it posted a key reversal down on Friday. The low-range close sets the stage for a steady to lower opening on Monday. Stochastics and the RSI are turning neutral to bullish signaling sideways to higher prices are possible near-term. Closes above the 20-day moving average crossing at $18.50 would signal that a short-term low has been posted. If July extends the decline off April's high, March's low crossing at $16.56 is the next downside target. First resistance is the 20-day moving average crossing at $18.50. Second resistance is May's high crossing at $19.44. First support is Wednesday's low crossing at $17.56. Second support is March's low crossing near $16.56.
July cocoa closed slightly higher on Friday as it extends the trading range of the past four-weeks. The high-range close sets the stage for a steady to higher opening on Monday. Stochastics and the RSI are turning neutral to bullish signaling that sideways to higher prices are possible near-term. If July extends the rally off March's low, monthly resistance crossing at 32.15 is the next upside target. Closes below the 20-day moving average crossing at 30.01 would signal that a short-term top has been posted.
July sugar closed lower on Friday and the mid-range close sets the stage for a steady to lower opening on Monday. Stochastics and the RSI are neutral to bearish signaling that sideways to lower prices are possible near-term. If July extends today's decline, the 50-day moving average crossing at 24.39 is the next downside target. Closes above Tuesday's high crossing at 26.22 would signal that a short-term low has been posted.
July cotton closed lower on Friday as it consolidated some of this week's rally. The low-range close sets the stage for a steady to lower opening on Monday. Stochastics and the RSI are bullish signaling sideways to higher prices are possible near-term. If July extends this week's rally, May's high crossing at 87.98 is the next upside target. Closes below the 50-day moving average crossing at 82.29 would signal that a top has been posted.
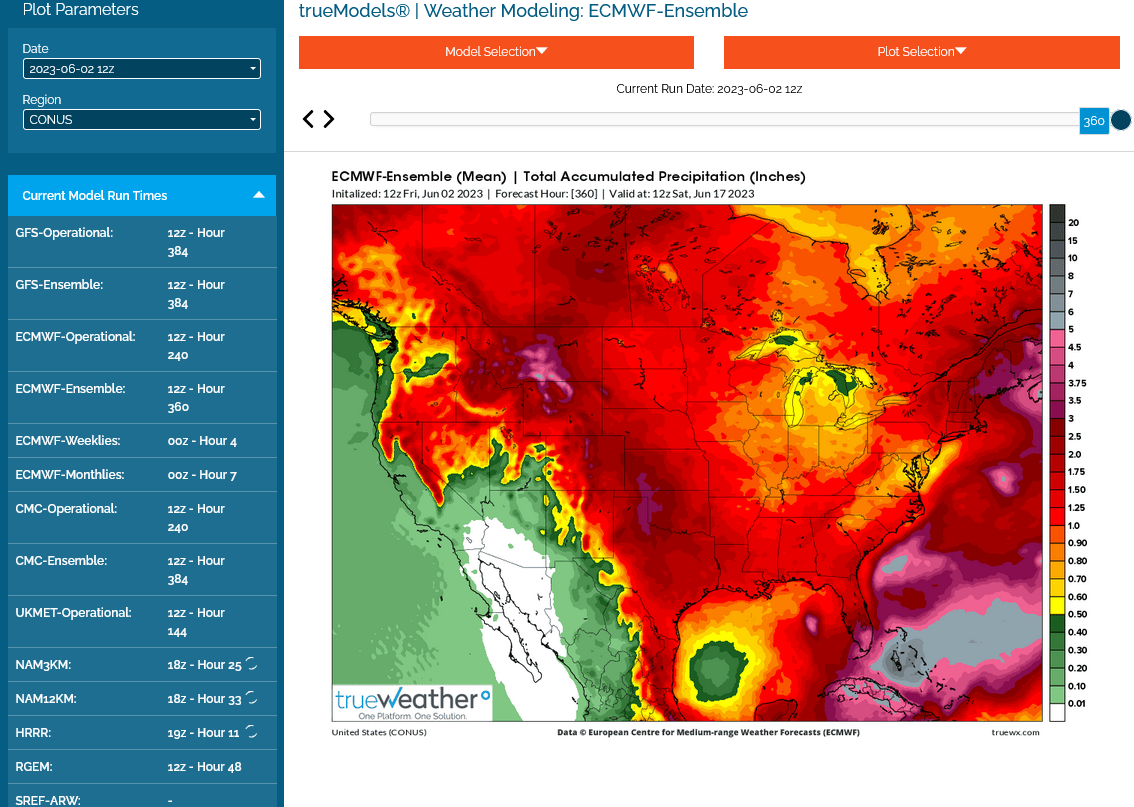
Weather continues bullish C and S with the drier EE being the best model right now!
By metmike - June 2, 2023, 4:17 p.m.
The just updated 12z EE is still pretty dry. Only around an inch of rain in most of the Cornbelt the next 2 weeks.....around half of the average. This mean INCREASING dry spots and drought on top of already dry soils:
Temps in the high population centers may heat up later this month?
https://www.cpc.ncep.noaa.gov/products/predictions/WK34/
| Week 3-4 Outlooks | |
| Valid: 17 Jun 2023 to 30 Jun 2023 Updated: 02 Jun 2023 | |
Temperature Probability | Precipitation Probability (Experimental)  |