KEY EVENTS TO WATCH FOR:
Monday, June 5, 2023
9:45 AM ET. May US Services PMI
PMI, Services (expected 55.1; previous 53.6)
10:00 AM ET. May ISM Report On Business Services PMI
Services PMI (expected 52.3; previous 51.9)
Business Activity Idx (previous 52.0)
Prices Idx (previous 59.6)
Employment Idx (previous 50.8)
New Orders Idx (previous 56.1)
10:00 AM ET. May Employment Trends Index
ETI (previous 116.18)
ETI, Y/Y%
10:00 AM ET. April Manufacturers' Shipments, Inventories & Orders (M3)
Total Orders, M/M% (expected +0.6%; previous +0.9%)
Orders, Ex-Defense, M/M% (previous +1.0%)
Orders, Ex-Transport, M/M% (previous -0.7%)
Durable Goods, M/M%
Durable Goods, M/M%
11:00 AM ET. May Global Services PMI
PMI, Services (previous 55.4)
The STOCK INDEXES? http://quotes.ino.com/ex?changes/?c=indexes
The STOCK INDEXES: The June NASDAQ 100 was lower overnight as it consolidates some of this year's rally. Overnight trading set the stage for a lower opening when the day session begins trading. Stochastics and the RSI are overbought but are neutral to bullish signaling that sideways to higher prices are possible near-term. If June extends this year's rally, the 87% retracement level of the 2022-decline crossing at 14,801.49 is the next upside target. Closes below the 20-day moving average crossing at 13,855.15 would signal that a short-term top has been posted. First resistance is the 87% retracement level of the 2022-decline crossing at 14,801.49. Second resistance is the March-2022 high crossing at 15,407.50. First support is the 10-day moving average crossing at 14,188.70. Second support is the 20-day moving average crossing at 13,855.15.
The June S&P 500 was steady to slightly higher overnight as it extends the rally off March's low. Overnight trading sets the stage for a slightly higher opening when the day session begins trading. Stochastics and the RSI are overbought but remain neutral to bullish signaling that sideways to higher prices are possible near-term. If June extends the rally off March's low, the August-2022 high crossing at 4382.75 is the next upside target. Closes below the 20-day moving average crossing at 4182.84 would signal that a short-term top has been posted. First resistance is last-Friday's high crossing at 4297.75. Second resistance August's high crossing at 4382.75. First support is the 10-day moving average crossing at 4207.52. Second support is the 20-day moving average crossing at 4182.86.
INTEREST RATES http://quotes.ino.com/ex changes/?c=interest"
INTEREST RATES: September T-bonds were lower overnight. Overnight trading sets the stage for a lower opening when the day session begins trading. Stochastics and the RSI are turning neutral to bearish signaling that sideways to lower prices are possible near-term. If September renews the decline off April's high, the 87% retracement level of the March-April rally crossing at 124-19 is the next downside target. Closes above last-Friday's high crossing at 129-16 would renew the rally off last-Tuesday's low. First resistance is last-Friday's high crossing at 129-16. Second resistance is the 50-day moving average crossing at 130-09. First support is the 75% retracement level of the March-April rally crossing at 125-30. Second support is the 87% retracement level of the March-April rally crossing at 124-19.
September T-notes gapped down and were lower overnight. Overnight trading sets the stage for a lower opening when the day session begins trading. Stochastics and the RSI are turning neutral to bearish signaling that sideways to lower prices are possible near-term. If September renews the decline off May's high, the 75% retracement level of the March-May rally crossing at 112.190 is the next downside target. Closes above last-Thursday's high crossing at 115.000 would renew the rally off May's low. First resistance is last-Thursday's high crossing at 115.000. Second resistance is the 50-day moving average crossing at 115.184. First support is the 75% retracement level of the March-May rally crossing at 112.190. Second support is the 87% retracement level of the 2022-2023 rally crossing at 111.243.
ENERGY MARKETS? http://quotes.ino.com/ex?changes/?c=energy ""
ENERGIES:Julycrude oil gapped up and was higher overnight as it extended the rally off last-Wednesday's low. Overnight trading sets the stage for a higher opening when the day session begins trading. Stochastics and the RSI are bullish signaling that sideways to higher prices are possible near-term. Closes above the 50-day moving average crossing at $74.66 would signal a resumptions of the rally off May's low. Closes below last-Wednesday's low crossing at $67.03 would open the door for a possible test of May's low crossing at $63.90. First resistance is the Overnight high crossing at $75.06. Second resistance is the April 28th high crossing at $76.74. First support is last-Wednesday's low crossing at $67.03. Second support is the May low crossing at $63.90.
July heating oil was higher overnight as it extends the rally off May's low. Overnight trading sets the stage for a higher opening when the day session begins trading. Stochastics and the RSI are bullish signaling that sideways to higher prices are possible near-term. Closes above the 50-day moving average crossing at 2.4387 would open the door for additional gains and a possible test of the April 25th high crossing at 2.5325. Closes below last-Wednesday's low crossing at 2.2268 would open the door for a possible test of May's low crossing at 2.1550. First resistance is the 50-day moving average crossing at 2.4387. Second resistance is the 50-day moving average crossing at 2.4387. First support is last-Wednesday's low crossing at 2.2268. Second support is May's low crossing at 2.1550.
July unleaded gas gapped up and was higher overnight as it extends the rally off last-Thursday's low. Overnight trading sets the stage for a higher opening when the day session begins trading. Stochastics and the RSI are turning neutral to bullish signaling that sideways to higher prices are possible near-term. Closes above the 50-day moving average crossing at $2.5301 would signal that a short-term low has been posted. If July renews last-week's decline, the May 15th low crossing at 2.3565 is the next downside target. First resistance is the 50-day moving average crossing at $2.5301. Second resistance is the 75% retracement level of the April-May decline crossing at $2.6308. First support is the May 15th low crossing at $2.3565. Second support is March's low crossing at $2.2872.
July natural gas was slightly higher overnight as it consolidates some of last-week's decline. Overnight trading sets the stage for a slightly higher opening when the day session begins trading. Stochastics and the RSI are oversold but remain neutral to bearish signaling that sideways to lower prices are possible near-term. If July renews the decline off March's high, the September-2020 low on the monthly continuation chart crossing at 1.795 is the next downside target. Closes above the 50-day moving average crossing at 2.518 would signal that a short-term low has been posted. First resistance is the May 19th high crossing at 2.816. Second resistance is the 25% retracement level of the 2022-2023 decline crossing at 2.997. First support is last-Thursday's low crossing at 2.136. Second support is the September-2020 low on the monthly continuation chart crossing at 1.795.
CURRENCIEShttp://quotes.ino.com/ex changes/?c=currencies"
CURRENCIES:The June Dollar was higher overnight and sets the stage for a higher opening when the day session begins trading later this morning. Stochastics and the RSI are neutral to bullish signaling that sideways to higher prices are possible near-term. Closes below the 20-day moving average crossing at $103.186 would signal that a short-term top has been posted. If June extends the rally off May's low, the March 15th high crossing at $104.720 is the next upside target. First resistance is the March 15th high crossing at $104.720. Second resistance is the 38% retracement level of the 2022-2023 decline crossing at $105.309.First support is the 20-day moving average crossing at $103.186. Second support is the 50-day moving average crossing at $102.203.
The June Euro was slightly lower overnight and sets the stage for a lower opening when the day session begins trading. Stochastics and the RSI are neutral to bullish signaling that sideways to higher prices are possible near-term. Closes above the 20-day moving average crossing at $1.08289 would signal that a short-term low has been posted. If June extends this month's decline, the 38% retracement level of the 2022-2023 rally crossing at 1.05914 is the next downside target. First resistance is the 20-day moving average crossing at $1.08289. Second resistance is the 50-day moving average crossing at $1.09277. First support is the 38% retracement level of the 2022-2023 rally crossing at 1.05914. Second support is the 50% retracement level of the 2022-2023 rally crossing at 1.04252.
The June British Pound was lower overnight and sets the stage for a lower opening when the day session begins trading. Stochastics and the RSI are turning neutral to bearish signaling that sideways to lower prices near-term. If June renews the rally off May's low, May's high crossing at 1.2692 is the next upside target. If June renews the decline off May's high, April's low crossing at 1.2293 is the next downside target. First resistance is last-Friday's high crossing at 1.2549. Second resistance is the May 10th high crossing at 1.2692. First support is April's low crossing at 1.2293. Second support is the 25% retracement level of the 2022-2023 rally crossing at 1.2138.
The June Swiss Franc was lower overnight as it extends the decline off May's high. Overnight trading sets the stage for a lower opening when the day session begins trading. Stochastics and the RSI are turning neutral to bullish signaling that sideways to higher prices are possible near-term. Closes above the 50-day moving average crossing at 1.11704 would signal that a short-term low has been posted. If June resumes the decline off May's high, the 38% retracement level of the 2022-2023 rally crossing at 1.09131 is the next downside target. First resistance is the 50-day moving average crossing at 1.11704. Second resistance is May's high crossing at 1.13940. First support is last-Wednesday's low crossing at 1.09545. Second support is the 38% retracement level of the 2022-2023 rally crossing at 1.09131.
The June Canadian Dollar was slightly lower overnight as it consolidates some of the rally off the May 26th low. Overnight trading sets the stage for a lower opening when the day session begins trading. Stochastics and the RSI are overbought but remain neutral to bullish signaling that sideways to higher prices are possible near-term. If June extends the rally off the May 26th low, May's high crossing at $75.18 is the next upside target. Closes below the 10-day moving average crossing at $73.91 would signal that a short-term top has been posted. First resistance is the May 16th high crossing at $74.66. Second resistance is May's high crossing at $75.18. First support is April's low crossing at $73.23. Second support is the 75% retracement level of the March-April rally crossing at $73.02.
The June Japanese Yen was slightly lower overnight and sets the stage for a lower opening when the day session begins trading. Stochastics and the RSI are oversold but are turning neutral to bearish signaling that sideways to lower prices are possible near-term. If June extends the decline off the March's high, the 87% retracement level of the 2022-2023 rally crossing at 0.069908 is the next downside target. Closes above the 20-day moving average crossing at 0.072876 would signal that a short-term low has been posted. First resistance is the 20-day moving average crossing at 0.072876. Second resistance is the 50-day moving average crossing at 0.074487. First support is the 75% retracement level of the 2022-2023 rally crossing at 0.071337. Second support is the 87% retracement level of the 2022-2023 rally crossing at 0.069908.
PRECIOUS METALS http://quotes.ino.com/ex changes/?c=metals"
Augustgold was lower overnight and sets the stage for a lower opening when the day session begins trading later this morning. Stochastics and the RSI are neutral to bearish signaling that sideways to lower prices are possible near-term. If August extends the decline off May's high, the 38% retracement level of the September-May rally crossing at $1941.90 is the next downside target. Closes above the 50-day moving average crossing at $2018.90 would signal that a short-term low has been posted. First resistance is the 50-day moving average crossing at $2018.90. Second resistance is the May 4th high crossing at $2102.20. First support is the 38% retracement level of the September-May rally crossing at $1941.90. Second support is the 50% retracement level of the September-May rally crossing at $1892.30.
July silver was lower overnight and sets the stage for a lower opening when the day session begins trading later this morning. Stochastics and the RSI are neutral to bullish signaling that sideways to higher prices are possible near-term. Closes above the 20-day moving average crossing at $24.040 would temper the near-term bearish outlook. If July renews the decline off May's high, the 62% retracement level of the March-April rally crossing at $22.541 is the next downside target. First resistance is the 20-day moving average crossing at $24.040. Second resistance is the 50-day moving average crossing at $26.673. First support is the 62% retracement level of the March-April rally crossing at $22.541. Second support is the 75% retracement level of the March-April rally crossing at $21.705.
July copper was steady to slightly higher overnight as it extends the rally off May's low. Overnight trading sets the stage for a slightly higher opening when the day session begins trading. Stochastics and the RSI are neutral to bullish signaling that sideways to higher prices are possible near-term. Closes above the 20-day moving average crossing at 3.7173 would signal that a short-term low has been posted while opening the door for additional short covering gains. If July renews the decline off April's high, the 75% retracement level of the 2022-2023 rally crossing at 3.4683 is the next downside target. First resistance is the 20-day moving average crossing at 3.7173. Second resistance is the 50-day moving average crossing at 3.8876. First support is the 75% retracement level of the 2022-2023 rally crossing at 3.4683. Second support is the 87% retracement level of the 2022-2023 rally crossing at 3.3261.
GRAINS http://quotes.ino.com/ex changes/?c=grains
July corn was slightly higher overnight as the market continues to struggle for near-term direction due to changing weather forecast for the Midwest. Overnight trading sets the stage for a slightly higher opening when the day sessions begins trading. Stochastics and the RSI are overbought but remain neutral to bullish signaling that sideways to higher prices are possible near-term. If July extends the rally off May's low, the 75% retracement level of the April-May decline crossing at $6.22 1/2 is the next downside target. Closes below last-Wednesday's low crossing at $5.77 1/2 would signal that a short-term top has been posted.First resistance is the 62% retracement level of the April-May decline crossing at $6.09 1/4. Second resistance is the 75% retracement level of the April-May decline crossing at $6.22 1/2. First support is last-Wednesday's low crossing at $5.77 1/2. Second support is May's low crossing at $5.47.
July wheat was slightly higher overnight as it extends the rally off last-Wednesday's low. Overnight trading sets the stage for a slightly higher opening when the day session begins trading. Stochastics and the RSI have turned neutral to bullish signaling that sideways to higher prices are possible near-term. Closes above the 20-day moving average crossing at $6.22 would temper the near-term bearish outlook. If July renews the decline off March's high, the March-2021 low crossing at $5.71 is the next downside target. First resistance is the 20-day moving average crossing at $6.22. Second resistance is the 50-day moving average crossing at $6.55. First support is last-Wednesday's low crossing at $5.73 1/4. Second support is the March-2021 low crossing at $5.71.
July Kansas City wheat was higher overnight as it extends the rally off last-Wednesday's low. Overnight trading sets the stage for a higher opening when the day session begins trading later this morning. Stochastics and the RSI are turning neutral to bullish signaling that sideways to higher prices are possible near-term. Closes above the 20-day moving average crossing at $8.37 3/4 would signal that a short-term low has been posted. If July renews the decline off May's high, the 87% retracement level of this month's rally crossing at $7.59 3/4 is the next downside target. First resistance is the 20-day moving average crossing at $8.37 3/4. Second resistance is the May 23rd high crossing at $8.49 1/2. First support is the 87% retracement level of this month's rally crossing at $7.59 3/4. Second support is May's low crossing at $7.36 1/4.
July Minneapolis wheat was higher overnight and sets the stage for a steady to higher opening when the day session begins trading. Stochastics and the RSI oversold but are turning neutral to bullish signaling that sideways to higher prices are possible near-term. Closes above the 20-day moving average crossing at $8.25 would temper the near-term bearish outlook. If July extends the decline off May's high, May's low crossing at $7.69 is the next downside target. First resistance is the 20-day moving average crossing at $8.25. Second resistance is the 50-day moving average crossing at $8.41. First support is last-Wednesday's low crossing at $7.75 1/2. Second support is the May 3rd low crossing at $7.69.
SOYBEAN COMPLEX? http://quotes.ino.com/ex?changes/?c=grains "
July soybeans were steady to fractionally lower overnight as they consolidate some of the rally off last-Wednesday's low. Overnight trading sets the stage for a steady to fractionally lower opening when the day session begins trading later this morning. Stochastics and the RSI are neutral to bullish signaling that sideways to higher prices are possible near-term. Closes above the 20-day moving average crossing at $13.53 1/4 would signal that a short-term low has been posted. If July renews the decline off April's high, the 50% retracement level of the 2020-2022 rally crossing at $12.12 is the next downside target. First resistance is the 20-day moving average crossing at $13.56 1/4. Second resistance is the 50-day moving average crossing at $14.11. First support is last-Wednesday's low crossing at $12.70 3/4. Second support is the 50% retracement level of the 2020-2022 rally crossing at $12.12.
July soybean meal was higher overnight and sets the stage for a higher opening when the day session begins trading. Stochastics and the RSI are turning neutral to bullish signaling that sideways to higher prices are possible near-term. Closes above the 20-day moving average crossing at $412.10 would signal that a short-term low has been posted. If July extends the decline off March's high, the 62% retracement level of the 2020-2023 rally crossing at $365.60 is the next downside target. First resistance is the 20-day moving average crossing at $412.10. Second resistance is the 50-day moving average crossing at $432.00. First support is the 50% retracement level of the 2020-2023 rally crossing at $388.80. Second support is the 62% retracement level of the 2020-2023 rally crossing at $365.60.
July soybean oil was steady to slightly lower overnight as it consolidates some of its recent gains. Overnight trading sets the stage for a slightly lower opening when the day session begins trading. Stochastics and the RSI are neutral to bullish signaling that sideways to higher prices are possible near-term. If July extends the rally off last-Wednesday's low, the 50-day moving average crossing at 51.96 is the next upside target. If July renews this year's decline, the 75% retracement level of the 2020-2022 rally crossing at 40.19 is the next downside target. First resistance is the May 26th high crossing at 49.66. Second resistance is the 50-day moving average crossing at 51.96. First support is the 62% retracement level of the 2020-2022 rally crossing at 46.42. Second support is the 75% retracement level of the 2020-2022 rally crossing at 40.19.
Still not much change overnight!
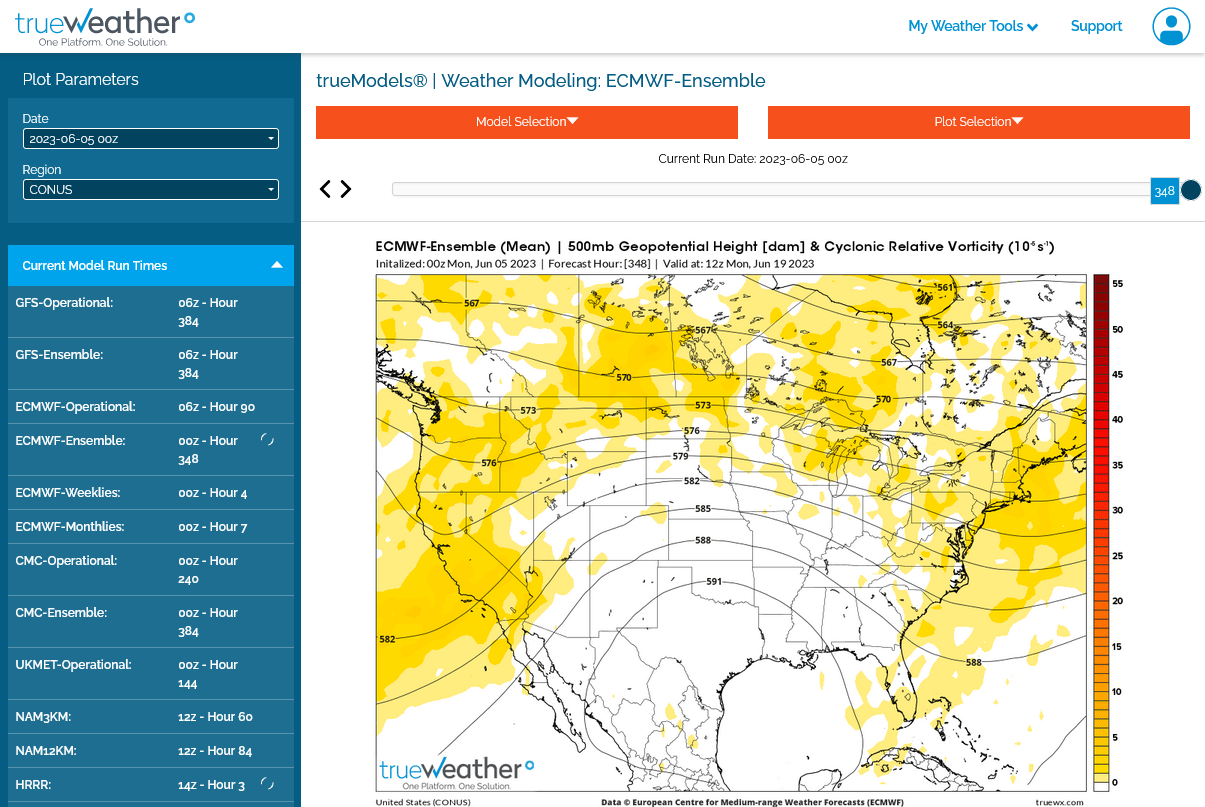
It's possible that when this upper level ridge starts building in, that we morph into a ring of fire pattern over the top with better chances of rain??
The forecast from the last EE is still not bearish.
1. Upper level map in 2 weeks
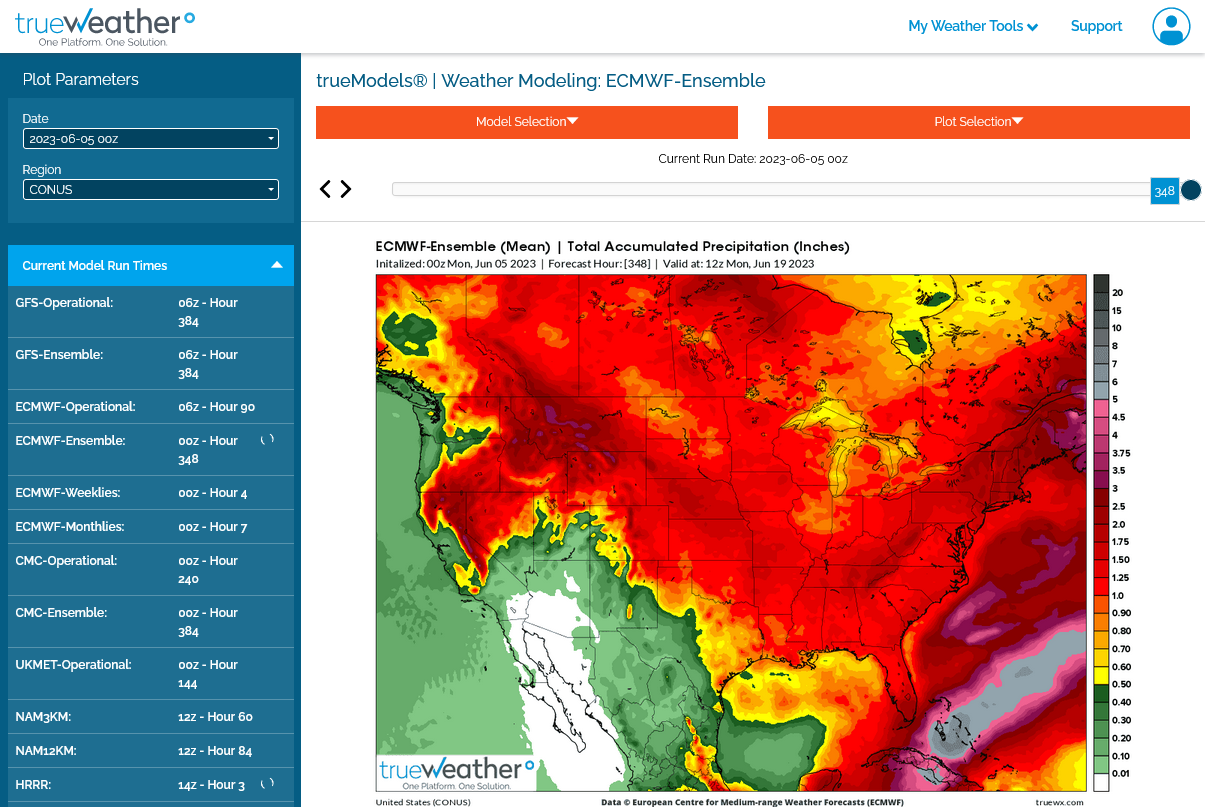
2. Total rains for 2 weeks. Still only around a inch. a bit more in the WCB and bullish but still slightly more than the end of last week.
3. The markets are struggling, so this must be dialed in, with the big spike higher after last weeks lows..... we assume.