https://www.marketforum.com/forum/topic/95929/#95932
Re: INO Evening Market Comments
By metmike - June 5, 2023, 7:58 p.m.
Thanks much tallpine!
CN down -12c with weather on the bullish side and a deteriorating crop?
Go figure!
CZ was only down -4c but that will come back on the open.
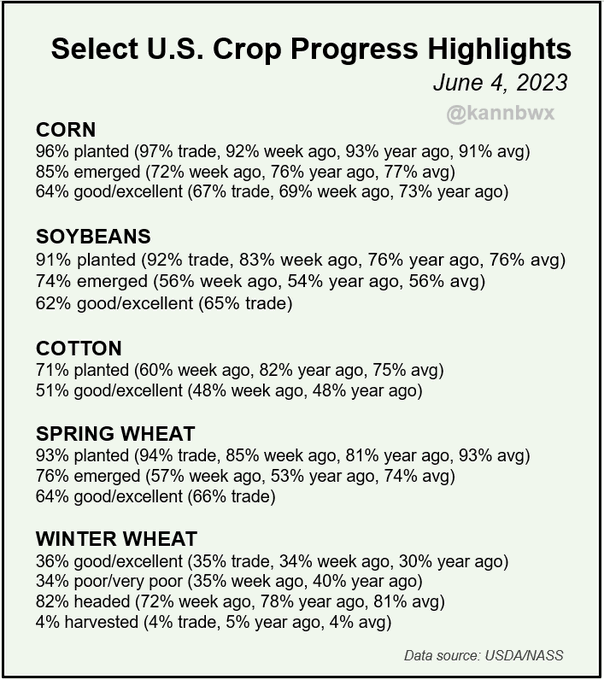
After the close, we saw the crop rating fall for corn by 5% and the first bean rating at just 62%. Worse than the market expected but seriously, why would the market think better considering the bone dry weather for most of the Cornbelt the last 5 weeks?
https://release.nass.usda.gov/reports/prog2223.txt
++++++++++++
U.S. #corn conditions fall 5 points on the week to 64% good/excellent, below the trade expectation of 67%. #Soybeans at 62% good/exc and spring #wheat at 64% were also below expectations. Winter wheat condition improved and harvest is 4% complete.
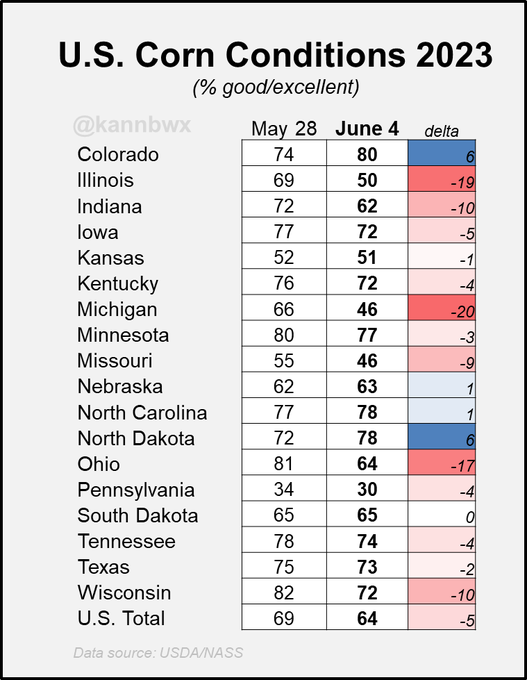
U.S. #corn conditions dropped to 64% good/excellent as of Sunday from 69% a week earlier. That was led by a 19-point drop in No. 2 grower Illinois. Other surrounding states in the eastern belt that were very dry last week also saw declines.
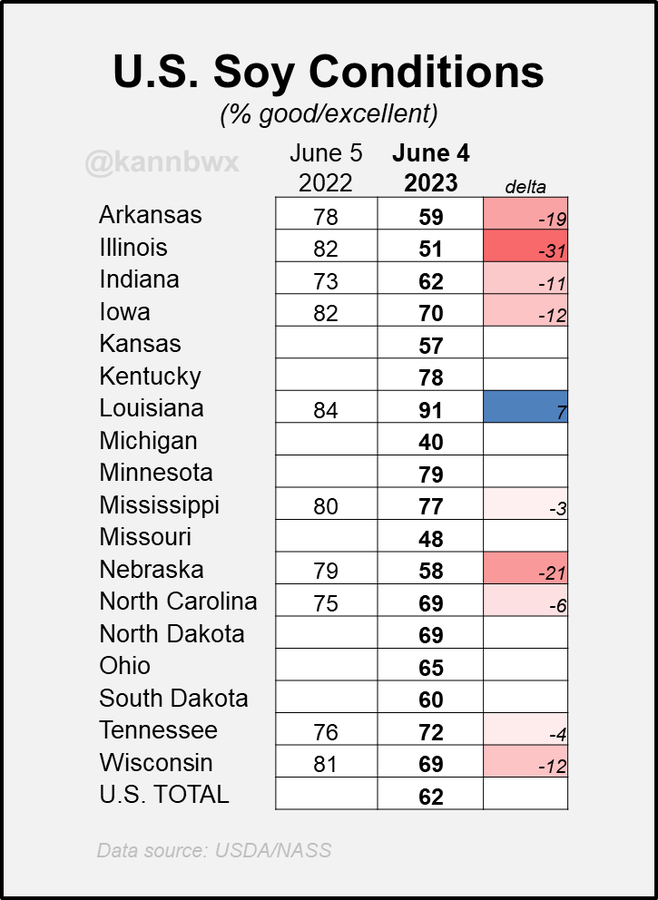
National and some state-level conditions for #soybeans were not available in this same week last year, so here are the available comparisons plus all June 4, 2023 numbers. Top grower Illinois is in at just 51% good/excellent.
Here's the link for the latest comprehensive weather update:
https://www.marketforum.com/forum/topic/83844/
Why are the markets tonight struggling with the early gains which resulted from the crop ratings being LOWER than expected?
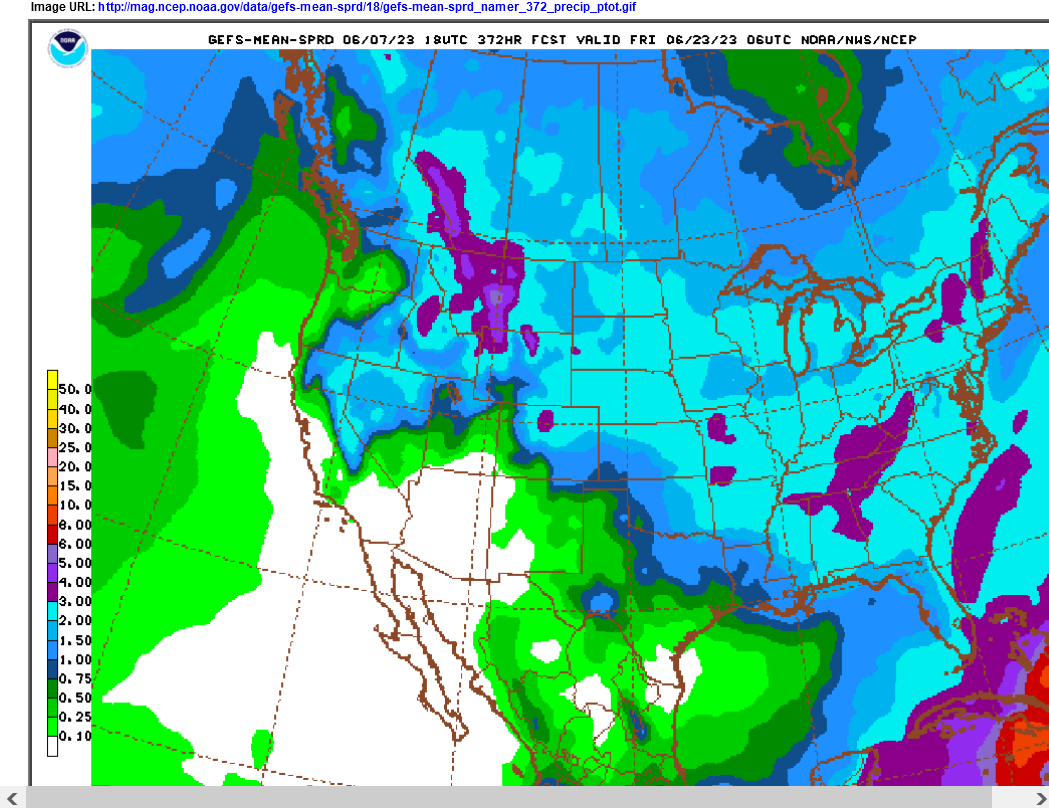
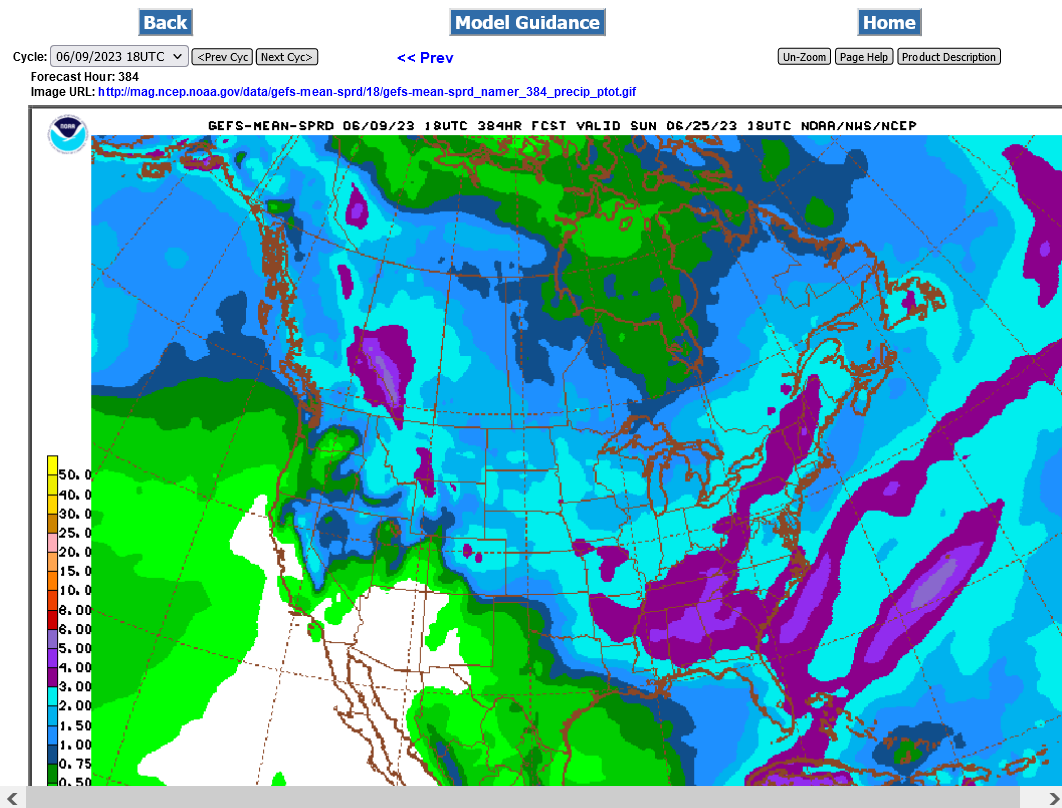
This was the last 18z GEFS. Rains have been increasing.
This is the wettest model, double the EE rains but the EE model also has been increasing its rains a bit.
Light blue is 2+ inches.
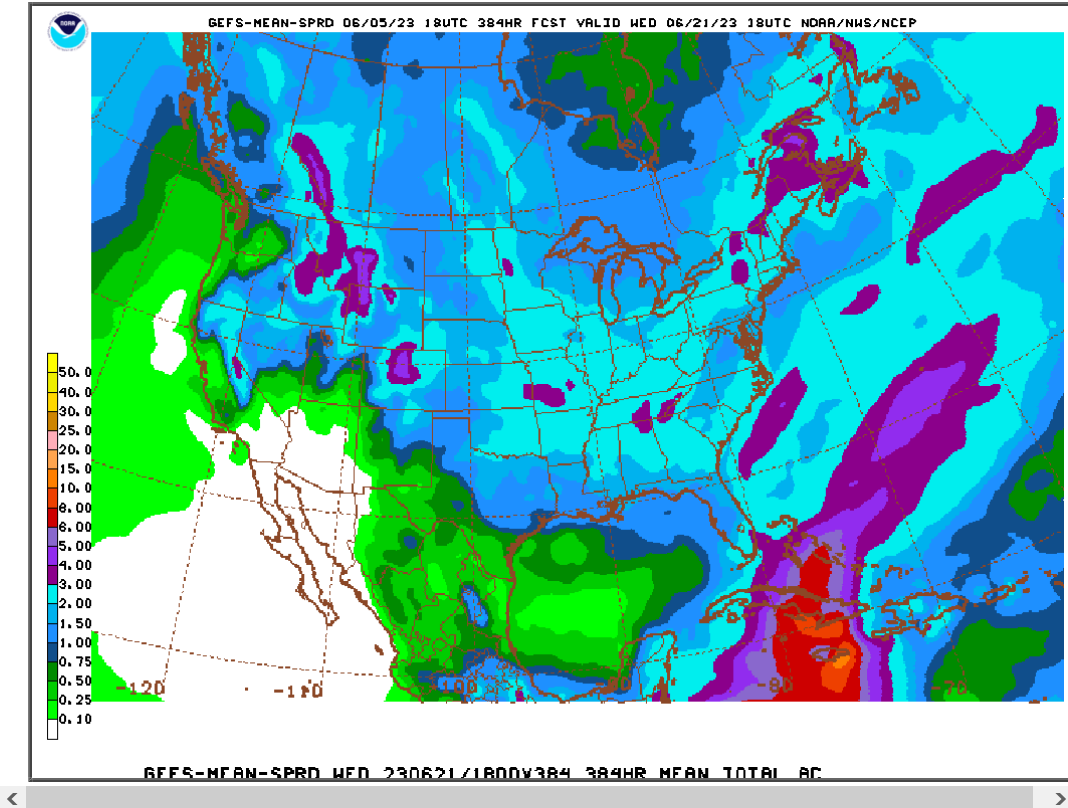
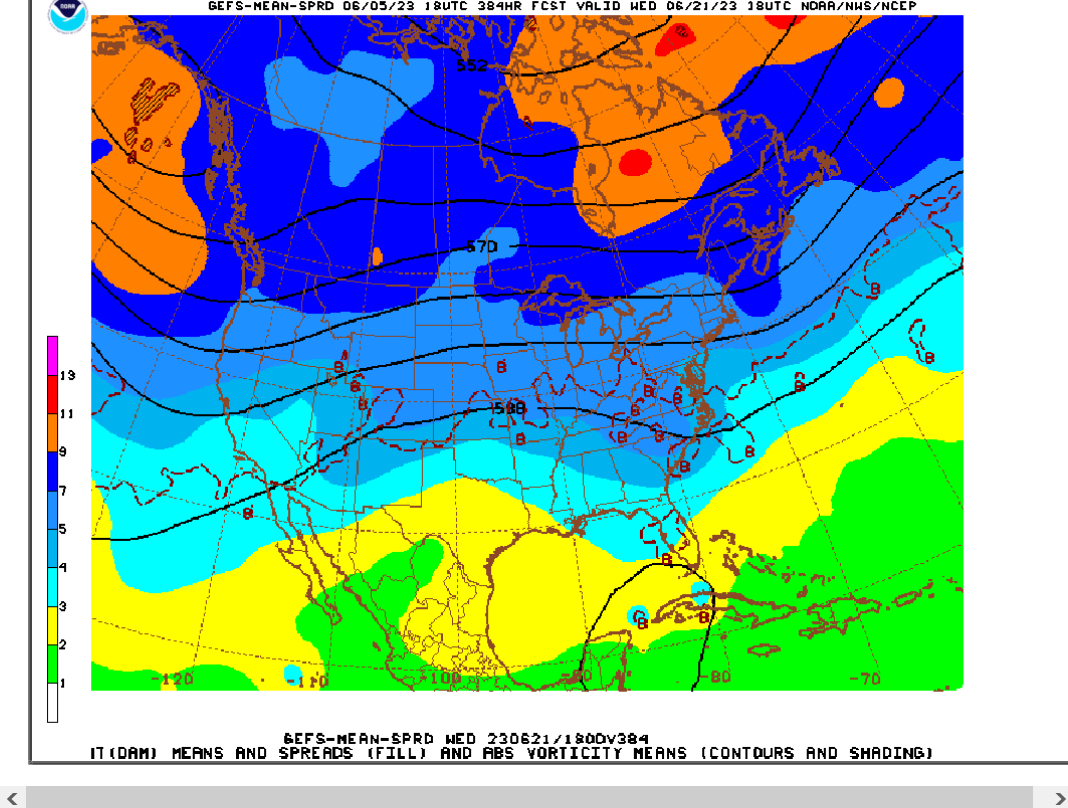
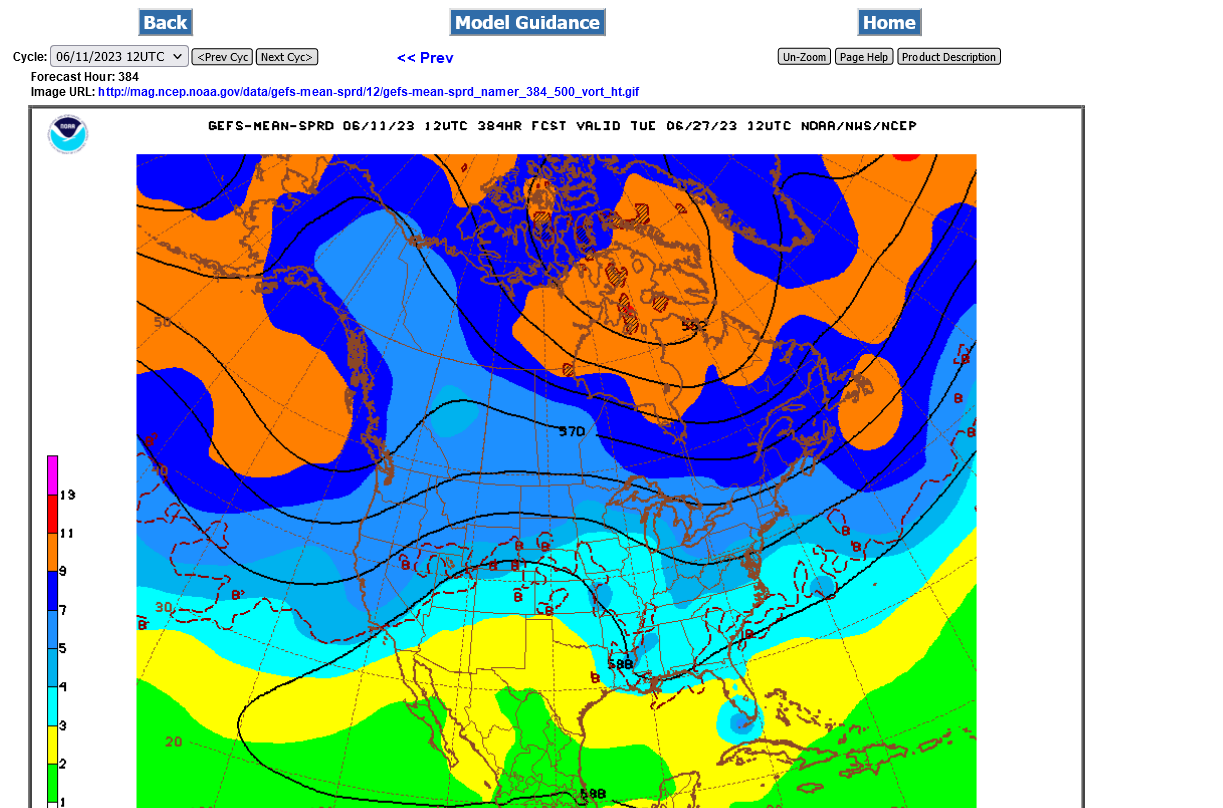
Below, at 2 weeks we see an upper level ridge building from the south. What MAY happen is that the El Nino driven jet stream coming from the S.Pacific over the top of the ridge(the ridge bringing in v.warm/humid air) could bring a ring of fire type pattern with active convective systems over the top of the heat ridge.
https://www.marketforum.com/forum/topic/83844/#83853
Soilmoisture anomaly:
These maps sometimes take a day to catch up to incorporate the latest data(the bottom map is only updated once a week).
https://www.cpc.ncep.noaa.gov/products/Soilmst_Monitoring/US/Soilmst/Soilmst.shtml#
![]()


++++++++++++++++++++++++++++
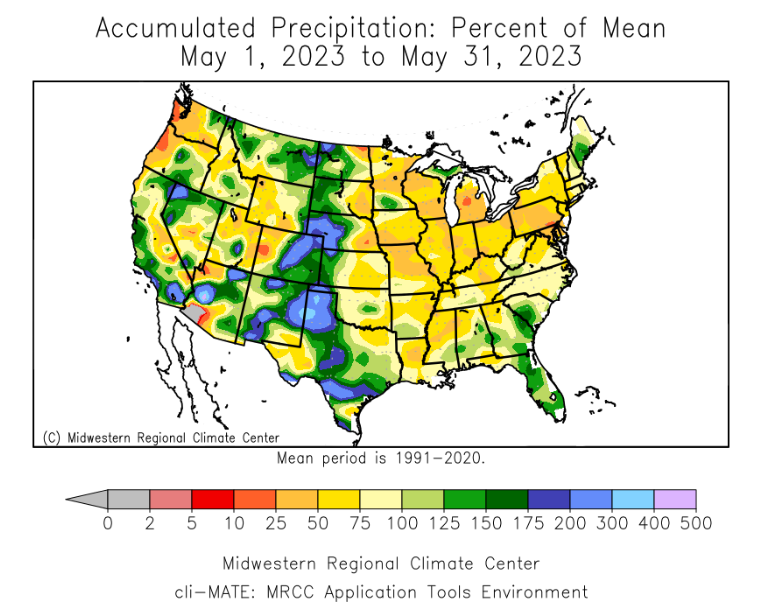
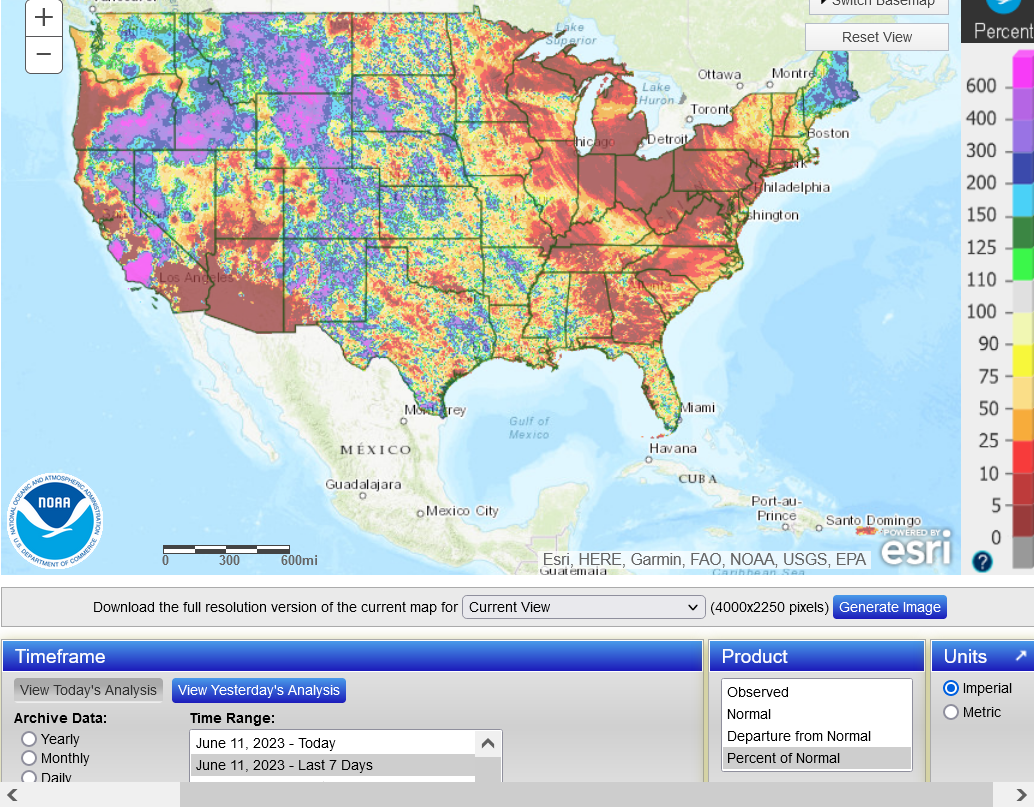
Final May precip map below
https://water.weather.gov/precip/
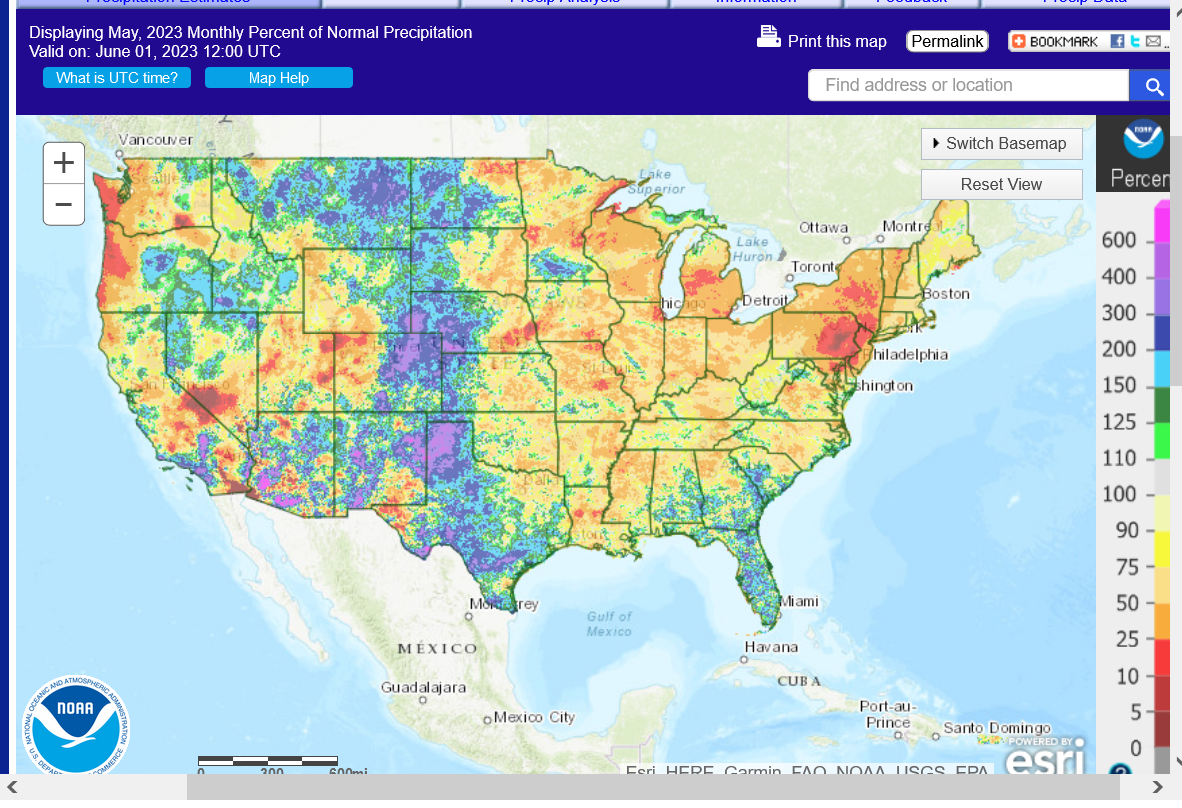
Most of the severe drought in the West has been wiped out!
Last week, May 30, 2023
https://droughtmonitor.unl.edu/
Huge expansion of drought in the Midwest!!

Drought monitor previous years: You can see the natural La Niña, (cold water-in the tropical Pacific)causing the drought! Starting in 2020, then worsening for 2+ years!
The ending of La Niña in 2023-heading towards El Nino, is causing the opposite weather-bombarding us with moisture.…..too much in some cases. This is a natural cycle NOT climate change!
7 Day Total precipitation below:
http://www.wpc.ncep.noaa.govcdx /qpf/p168i.gif?1530796126

With the huge drop in crop ratings, many wonder why corn/beans were not up 20/40c today!
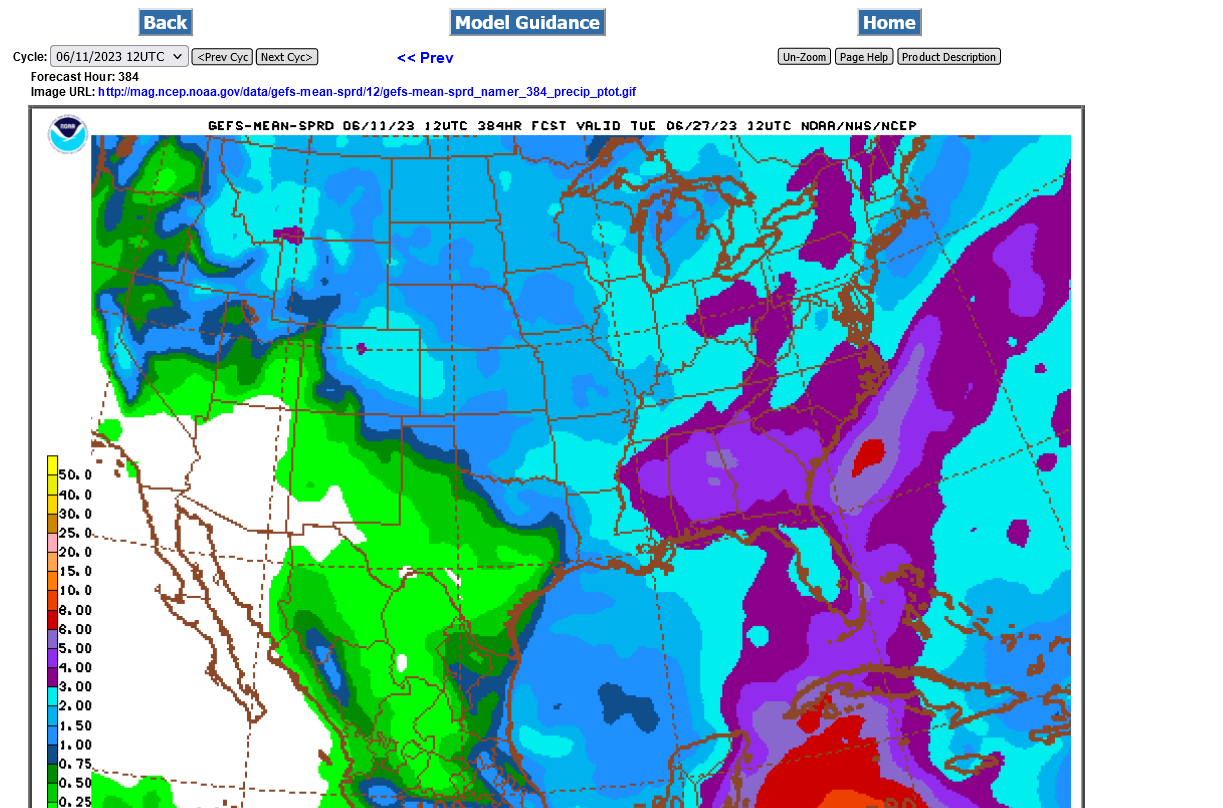
The last 12z GEFS model is your answer:
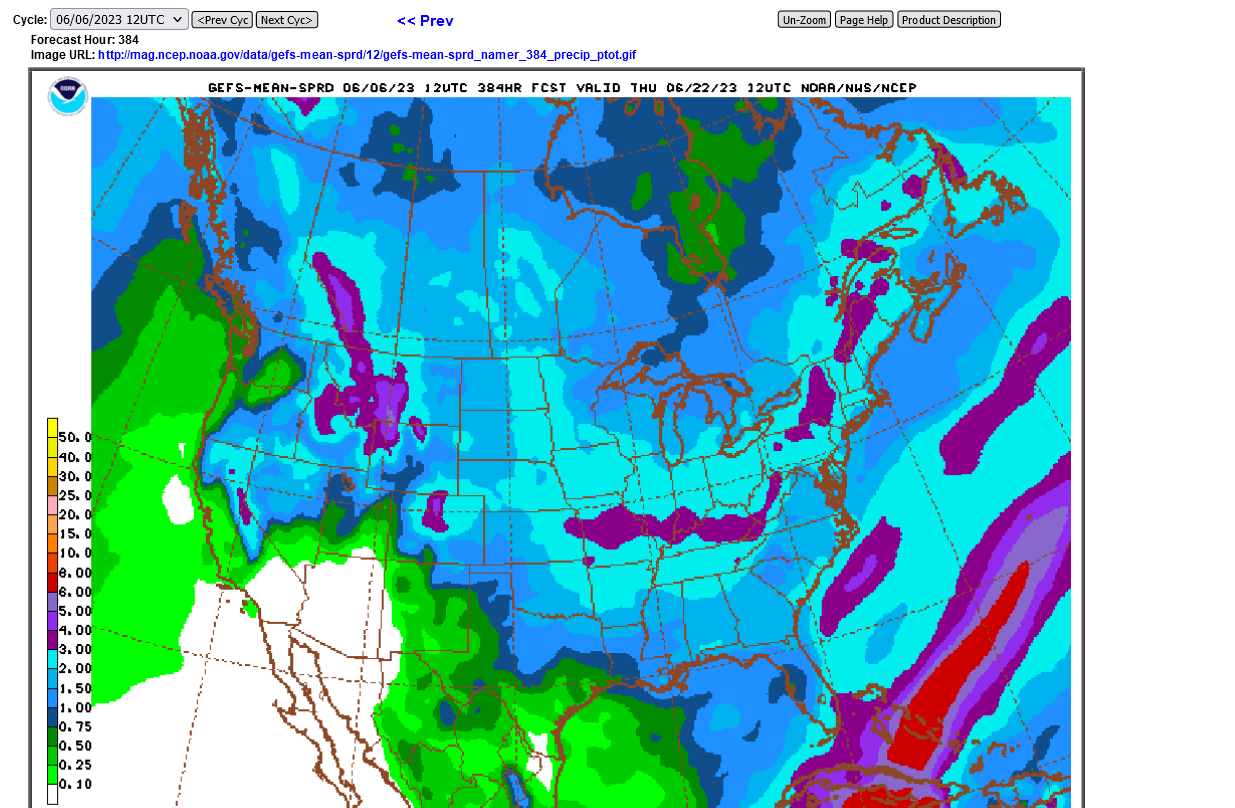
This model continues to have almost twice the rain as the much drier EE and CMC models which is where I'm still leaning though I would love the rain. The EE has only half the rain of the GEFS but the EE is also increasing rain, from its lower amounts.
Our dry spell in Evansville, IN is now the longest in almost 6 years at something like 46 days.
Markets today were insane to try to trade with spikes up and down numerous times from the bullish battle of the deteriorating crop going against the bearish increases in the rain forecast.
The 7 day NWS outlook is also increasing rains every day. This is likely the El Nino kicking in from the warming waters of the Pacific. Global warming and El Nino greatly INCREASE the odds of favorable weather in the US Cornbelt.
7 Day Total precipitation below:
http://www.wpc.ncep.noaa.govcdx /qpf/p168i.gif?1530796126
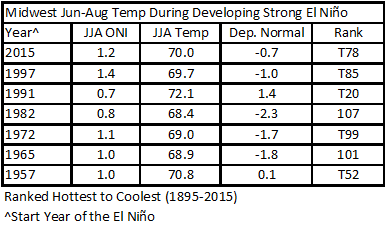
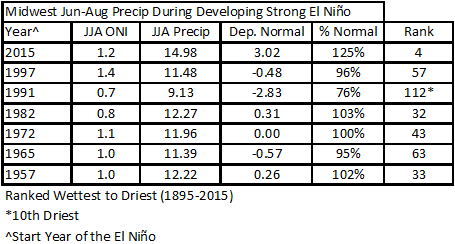
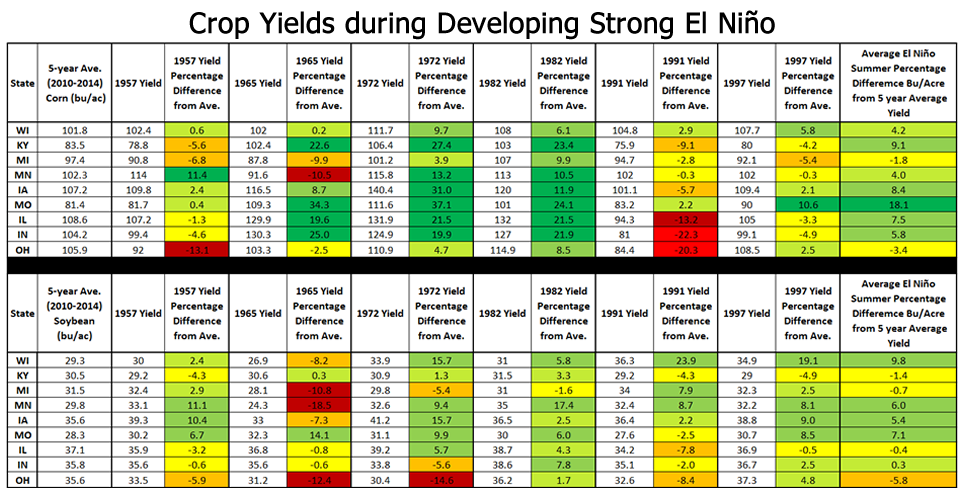
Only 1 year, 1991 featured notably hotter and drier than average growing season weather when there was a strong El Nino developing!!!
This greatly increases the odds for above trend yields this Summer for all crops in the Midwest and potential for RECORD yields.
https://mrcc.purdue.edu/mw_climate/elNino/impacts.jsp
Re: INO Morning Market Commentary
By metmike - June 7, 2023, 11:32 a.m.
Thank you tallpine!
Not much change in the weather forecast.
Rain chances still going up with time as the beneficial impact of the El Nino......warming tropical Pacific Ocean kicks in.
Not much more rain than yesterday but the pattern is getting closer to the rains.
This is NOT a done deal, however.
++++++++++
Actually, looking closer there is LESS rain on the GEFS than Tuesday morning!
However, the pattern is still the same.
There are several individual ensemble members on some models, that instead of a ring of fire pattern with El Nino perturbations coming over the top of a ridge to the south......they build the ridge strongly into the Midwest.
+++++++++++
By metmike - June 7, 2023, 12:34 p.m.
Old crop beans up sharply, new crop beans around unch. New crop corn down sharply.
Something other than weather is impacting prices when this happens.
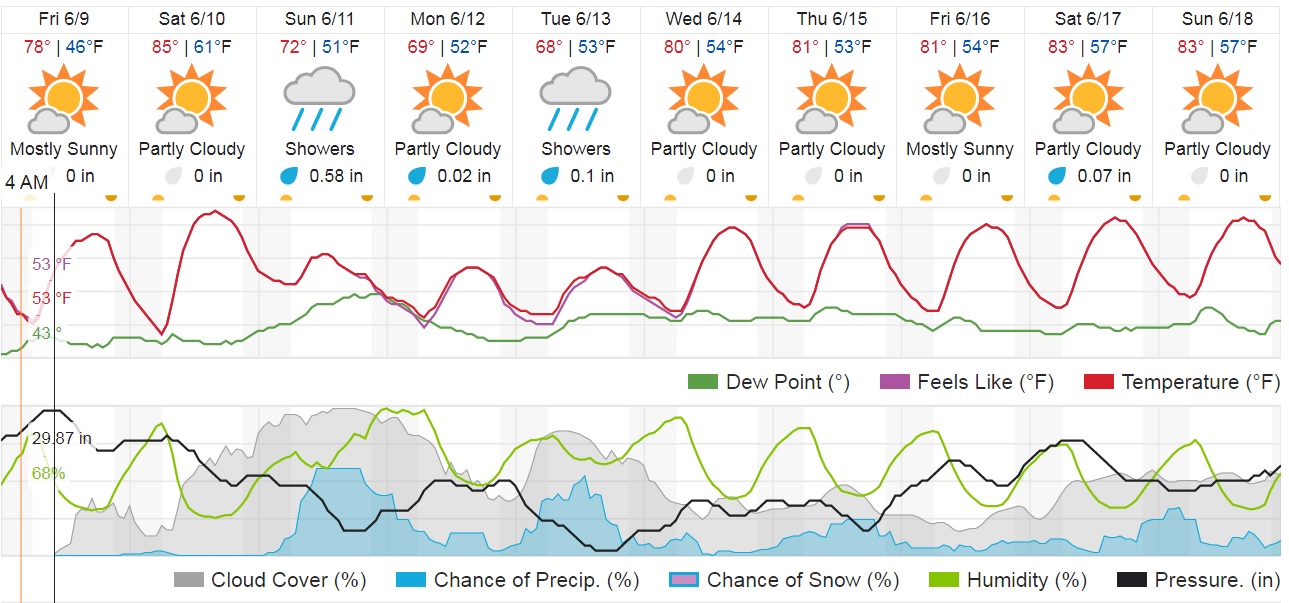
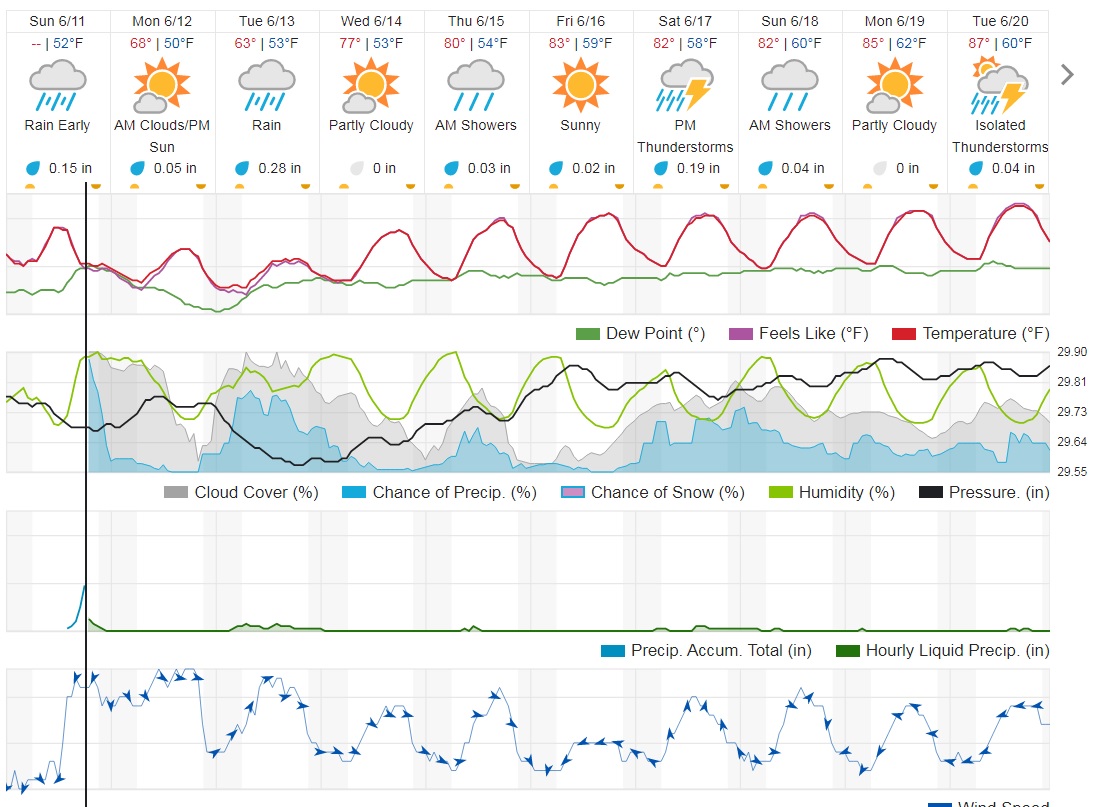
SURPRISINGLY ENOUGH ~ I SAW A LOT OF FIELDS TODAY & NOT A ONE OF THEM LOOKED STRESSED, OTHER THAN BEIN' SHORT.
YESTERDAY, THERE WAS 1" OF RAIN IN THE FORECAST FOR SUN, & MON, COMBINED. NOW, IT'S DOWN TO .75, COMBINED FOR THOSE DAYS.
Thanks Jean!
Latest 7 day rain forecast:
7 Day Total precipitation below:
http://www.wpc.ncep.noaa.govcdx /qpf/p168i.gif?1530796126
DECEMBER/NEW CROP Corn gapped lower on the open tonight. Looks like a downside break away gap!
This was the last 18z GEFS
WELL, MIKE ~ I JUST CHECKED & NOW WE'RE DOWN TO .50 FOR SUN. & MONDAY!
Thanks, Jean!
Small gap lower for CZ on the open last night was tested alot of times.
That often means it will be closed/filled because if the downside breakaway gap formation is based on a sudden bearish element imposed on the market.........it keeps going lower from the pressuring force. If there's no follow thru, that means the force is wavering and possibly transient.
That happens alot in sensitive weather markets when the forecast is uncertain and changing back and forth.
As long as it stays open, however its still a downside breakaway gap.
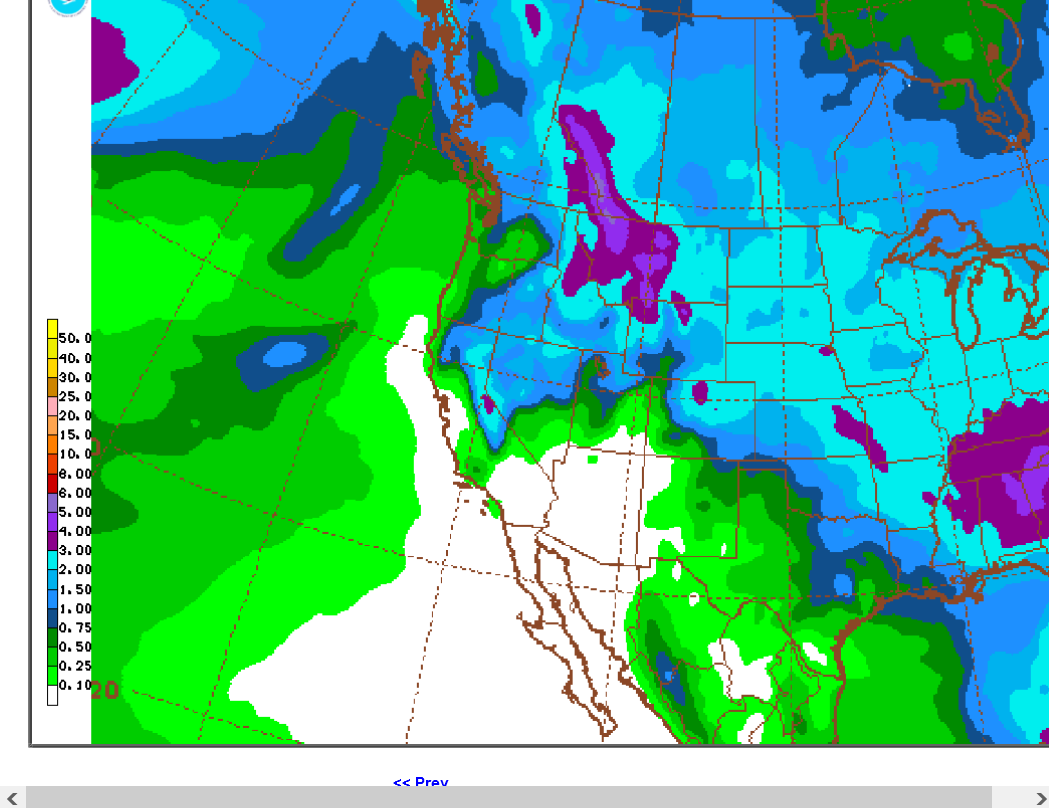
Last 6z GEFS below. Around 2 inches of rain in 2 weeks in most places.
The EE continues drier, with around 60% of these amounts.. except in the far southwest Cornbelt where its pretty wet too.
OK, we barely filled the gap, as I suspected earlier but at sitting at yesterday's lows.
They market is extremely uncertain, with many wild gyrations up and down this week, many of them during the same trading session.
++++++++++++++++++
When a gap fails/get's filled, the direction signal reverses. In this case, it becomes bullish when we are above the "gap and crap" because it shows the force causing the gap was not strong enough to keep the market going in that direction(or has gone away).
Again, weather markets with changing forecasts are notorious for this.
However, when there's a PATTERN CHANGE from 1 type of weather to another with the opposite impact on the crops, the signal and direction can usually stay sustained in the same direction( with fluctuations before that overpowers uncertainty).
New crop corn, the weakest thing on the board has clawed back to higher which is suggesting the gap and crap selling exhaustion signal described in the previous post.
A reversal pattern.
less rain in these latest models will confirm that with a higher close……if that happens.
more rain and we can go lower again.
LOL I JUST CHECKED. WE'RE STILL HOLDING AT 0.50... BUT... IT'S NOW SPREAD ACROSS A 3 DAY SPAN = SUN, MON. TUES.
CZ did in fact confirm the gap and crap reversal up as a bullish technical formation on the price charts.
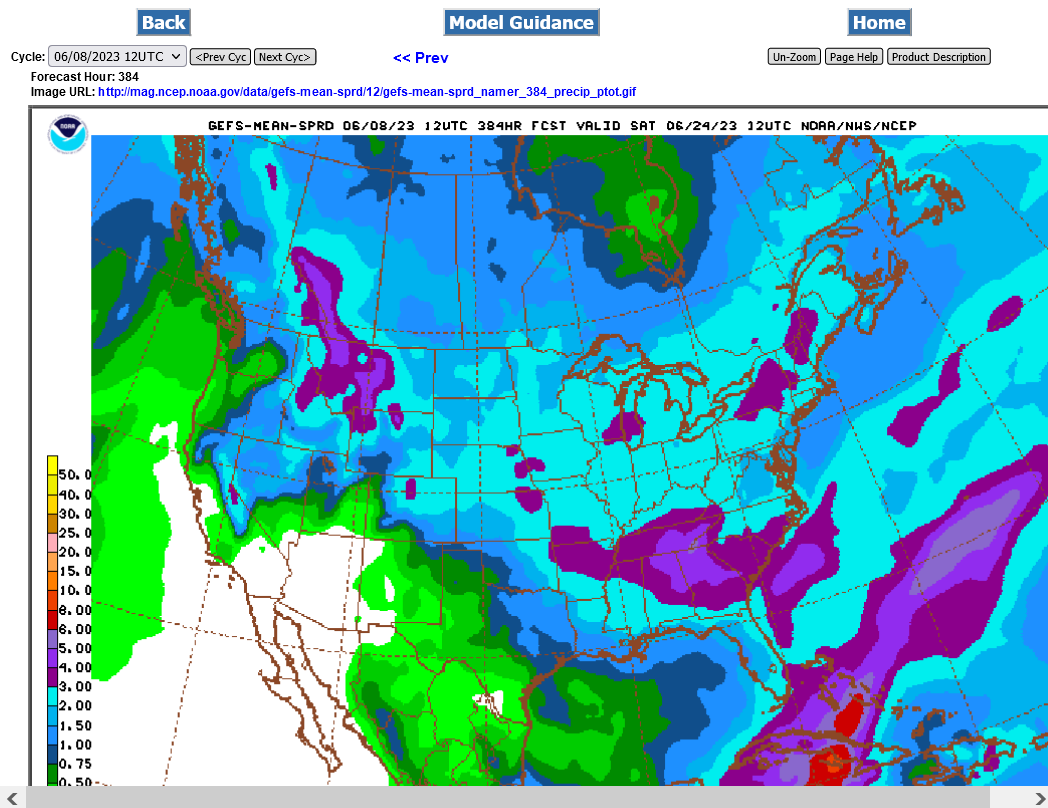
If you look at the last 12z GEFS that came out during the reversal up, with a bit MORE rain than any previous runs, it seems baffling.
However, I will content that increasing HEAT in week 2 is offsetting the additional rain. Corn is most impacted by heat.
Most of the highest yielding years have ALL been cool or average temps.
Hot Summers NEVER give us high yields for corn. Heat fill is a real yield killer but that comes in late July/August. Heat in pollination is bad too and pollination will be early this year from early planting and now, rapidly accumulating GDDs.
Heat in June with lots of rain is not that bad for corn.........usually. However, we have a widespread flash drought in most of the Midwest and the crop in many areas will be be moisture starved at times and heat with a moisture starved crop is never good.


euro now drier. rating down another 5 on Monday. Does not seem like much action in the pits for this kind of crap weather
NOW, WE'RE BACK TO .75, DURING THOSE SAME 3 DAYS.
"euro now drier"
No, the European model was a bit WETTER yet and catching up to the wettest GEFS.
NOW, WE'RE BACK TO .75 FOR SUNDAY, ONLY LOL
Thanks Jean.
You're in an area that is on the fringe/edge of the potential nice rains to possibly being on the periphery and missing much of the moisture.
Upper Midwest is skinny on the upcoming rains:
7 Day Total precipitation below:
http://www.wpc.ncep.noaa.govcdx /qpf/p168i.gif?1530796126
Last 18z GEFS rains the next 2 weeks:
Temperature Probability | Precipitation Probability (Experimental)  |
wow. noticed several forecasts now calling for reduced rain and coverage. Last thing eastern corn belt needs. Saw several with 90% of 1.25 and now 50-60% of .50. Same story, mother nature rules and when you are suffering thru a dry period its hard to get good coverage and if you are really wet it will rain a bunch anytime
Forecast hasn't changed much.
As El Nino kicks in more, the rains are shifting north and east from their recent S.Plains location.
Still too dry in the Upper Midwest, southeast to around Indy the next week but as the pattern continues to creep northward, those areas have better chances in week 2.
7 Day Total precipitation below:
http://www.wpc.ncep.noaa.govcdx /qpf/p168i.gif?1530796126
2 weeks from the last 6z GEFS below:
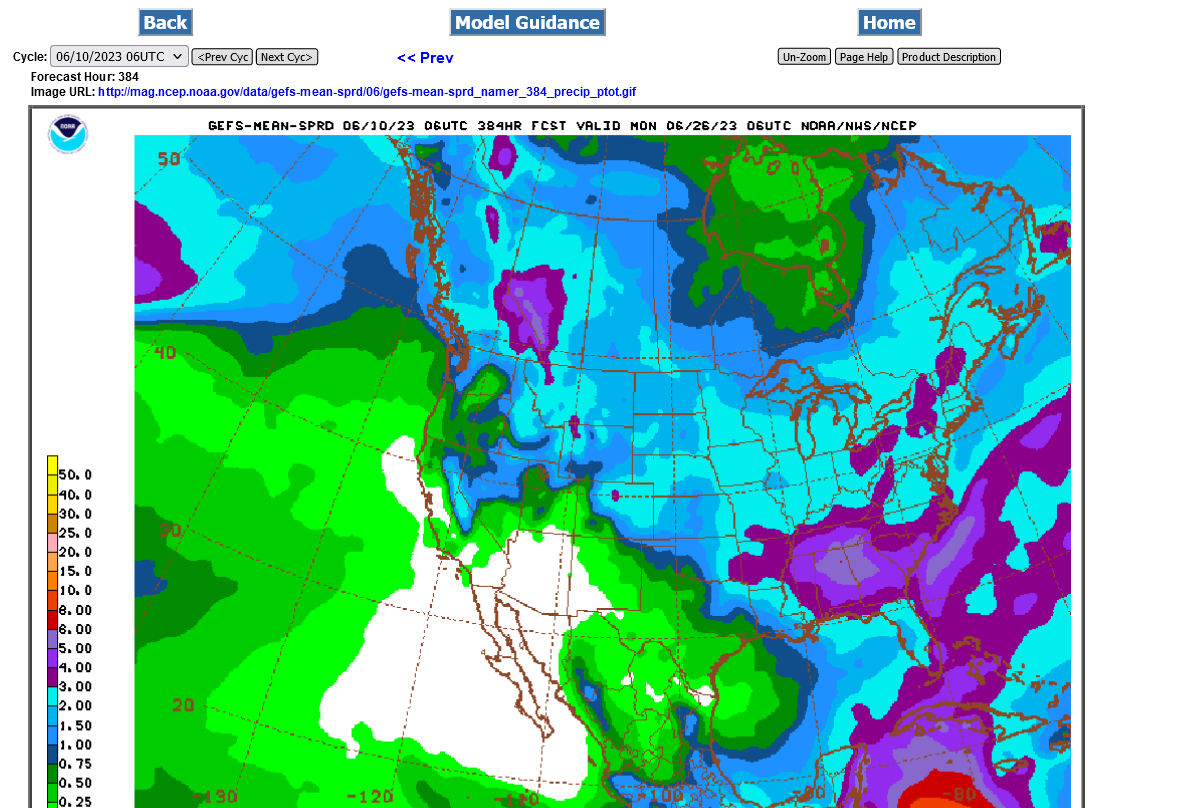
These are the areas that need rain the most. Actually THE ENTIRE CORNBELT but some spots are losing a bit of yield potential already.
https://www.cpc.ncep.noaa.gov/products/Soilmst_Monitoring/US/Soilmst/Soilmst.shtml#
![]()
week 2 better? many wondering what will be left after another week of this
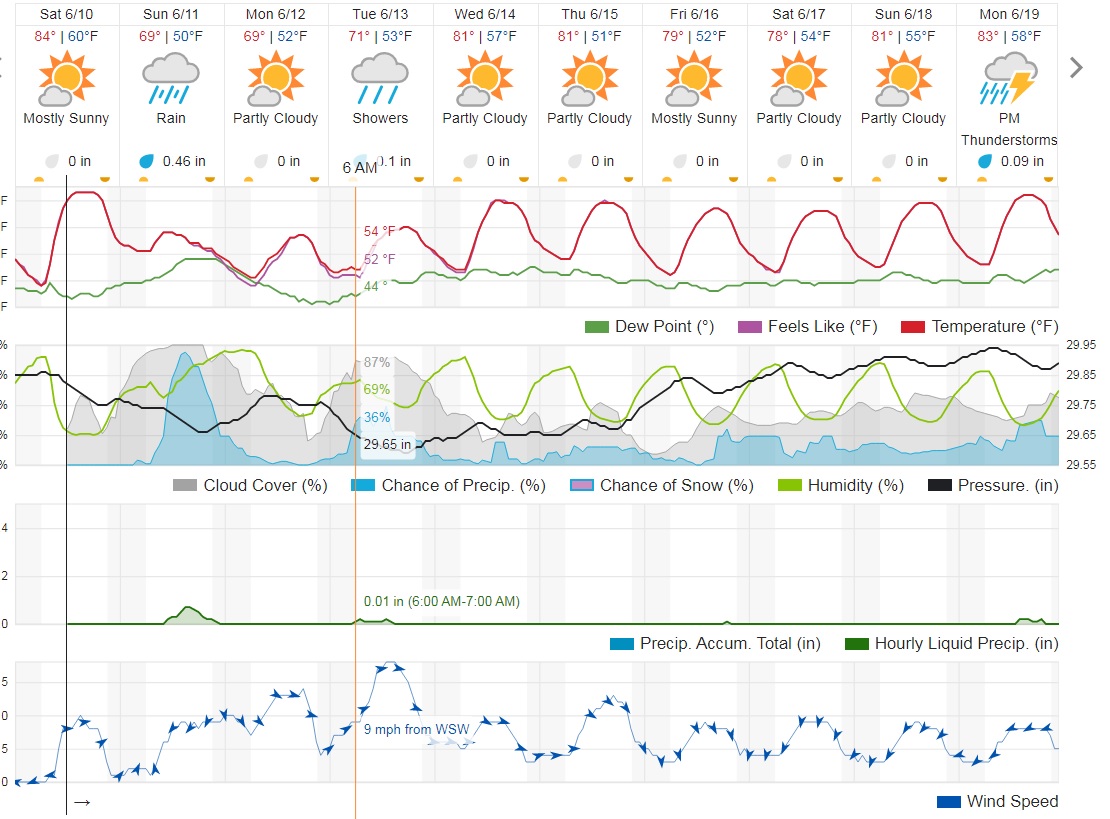
well , this big system that so many of us had our hopes on is fading into a mostly big fat nothing. The radar now somehow has a large chunk in Ohio, passing thru these parts with an excuse me sprinkle. Mets declared last nite an all day affair into Monday morning. Off and on rain, over an inch. Its falling apart, fading, Do not see where the energy will come from to generate and rain.
The big change today is in week 2. Instead of El Nino perturbations coming around the periphery of the upper level ridge, aimed at the Midwest, the upper level ridge builds STRONGER into the Plains/WCB and blocks the perturbations and results in an expanding upper ridge Plains to WCB and MUCH LESS rain along with HEAT.
More weather:
MIKE ~ SO FAR... DURING THE 2 HOURS OF "RAIN" ON THE RADAR, WE'VE JUST NOW REACHED A WHOPPING >>>> 0.01 INCHES.
MY WOOD DECK RAILING WAS SO DRY & HOT... THE FEW RAIN DROPS THAT DID LAND, DISAPPEARED, INSTANTLY!
EDIT AT 4:04 PM...... THE WIND HAS SHIFTED & IT'S COMING OUTTA THE N.E. THERE IS RAIN. RUNNING DOWN THE WINDOWS!!
I'LL BET THE BIRDS ARE HAPPY! IT'S BEEN A STRUGGLE FOR THEM TO FEED THEIR YOUNG!
Precipitation in the U.S. Midwest was only 53% of normal in May, the driest May since 1994 and the 7th driest since 1895. For comparison:
May 1988 - 42% - 3rd
May 1992 - 50% - 4th
May 1994 - 51% - 6th
May 2021 - 77% - 42nd
May 2012 - 85% - 60th
May 2022 - 105% - 93rd
+++++++++++++++++++++
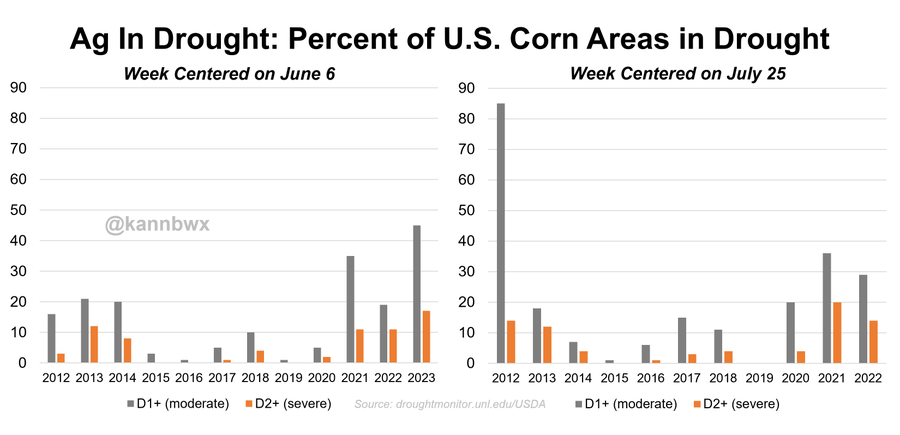
45% of U.S. #corn areas were covered by drought as of Tuesday, up from 34% a week earlier and the most for this week since records began in 2012.
Precipitation in the U.S. Midwest was only 53% of normal in May, the driest May since 1994 and the 7th driest since 1895. For comparison: May 1988 - 42% - 3rd May 1992 - 50% - 4th May 1994 - 51% - 6th May 2021 - 77% - 42nd May 2012 - 85% - 60th May 2022 - 105% - 93rd
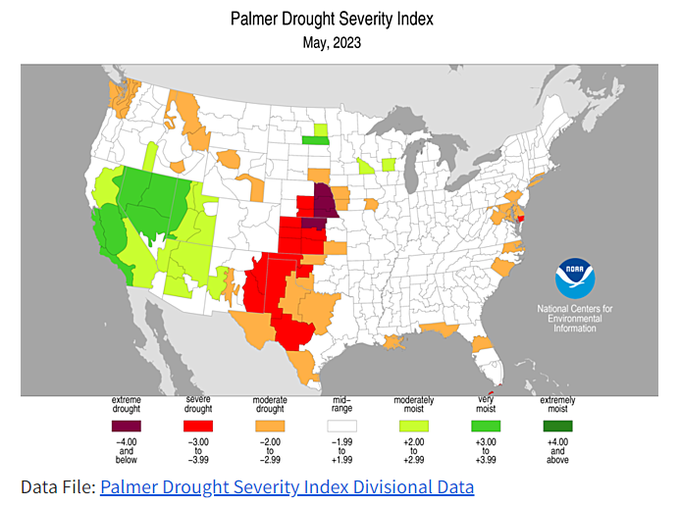
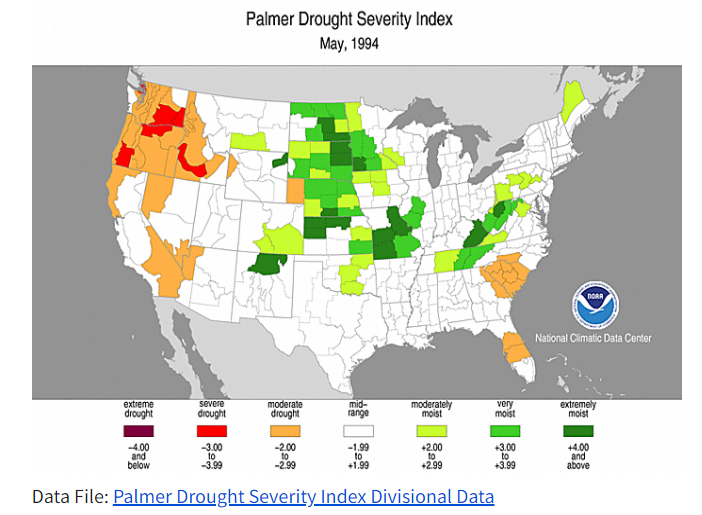
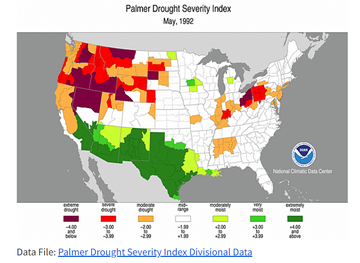
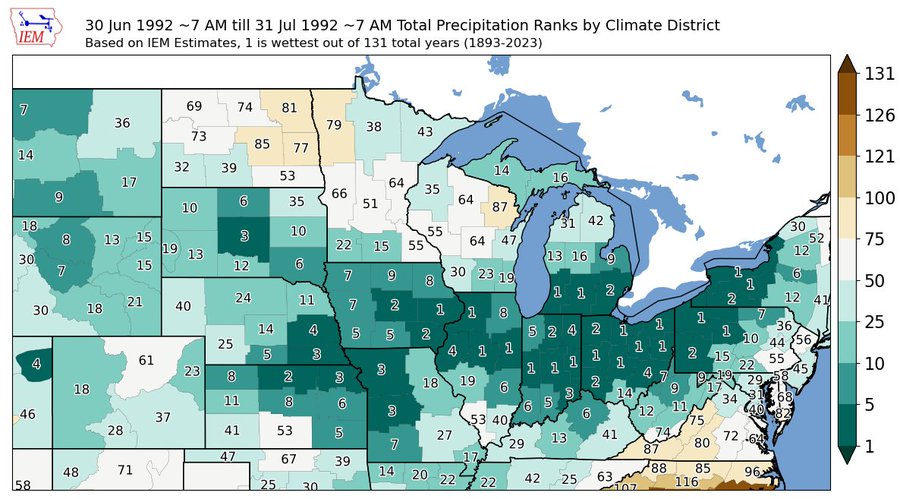
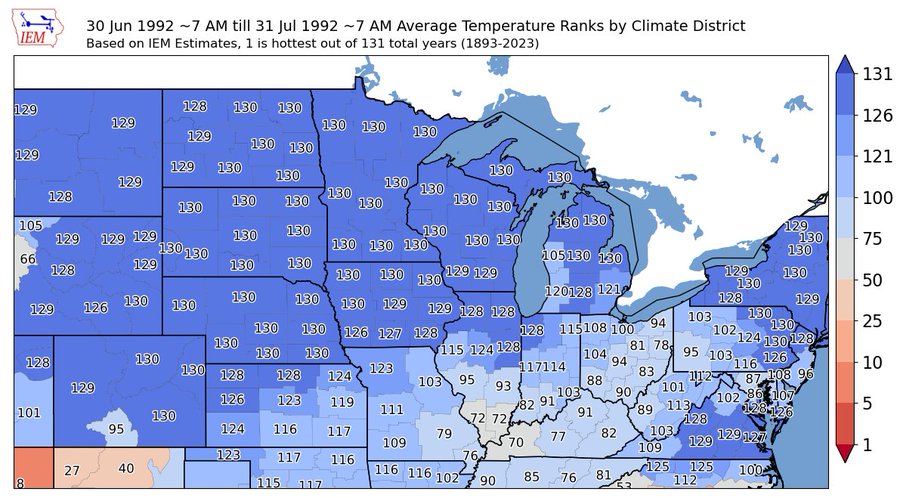
1992 and 1994 - terribly dry Mays but great #corn yields. There are many ways you can compare them, but here's something pretty basic - Palmer Drought Severity Index by district. Def weakens a 1994 argument but 1992 is intriguing.
July 1992 is a huge outlier - unicorn stuff after how tough May-June was. July was the Midwest's 2nd wettest & 3rd coolest since 1895, important to keep in mind if you're comparing 1992 & 2023. Could just average July weather in 92 have been enough for decent yields? Don't know.
metmike: This will likely NOT be another Summer of 1992!
WE ARE NOW UP TO 0.33 INCHES IN 4 1/2 HOURS.
GOOD THING IS ~ IT'S DOWN TO 60 DEGREES
It's over in southwest In. .51 in our backyard rain gauge. Best rain in a month.
You still have another couple of showers possible in Lima-land.
WE DID AT A GOOD, SLOW & STEADY 1/2", IN A 6 HOUR SPAN ~ YES!!!!!!
Crop ratings will take another big drop tomorrow!
% Average rains the last week:
https://water.weather.gov/precip/
7 day temps last week. HEAT, increasing stress except in the ECB(which was dry last week-got a bit of rain today)
https://www.cpc.ncep.noaa.gov/products/tanal/temp_analyses.php
Corn still holding the gap higher on the open.
Beans struggling a bit after the double digit gains on Friday.
Looks like mcfarm did the best of all. Depending on location, close to an inch or if farther southeast from Indy, over an inch.
Since he only reports bad weather, he stopped reporting when that much rain fell.