KEY EVENTS TO WATCH FOR:
Thursday, June 8, 2023
8:30 AM ET. Unemployment Insurance Weekly Claims Report - Initial Claims
Jobless Claims (expected 235K; previous 232K)
Jobless Claims, Net Chg (previous +2K)
Continuing Claims (previous 1795000)
Continuing Claims, Net Chg (previous +6K)
8:30 AM ET. U.S. Weekly Export Sales
10:00 AM ET. April Monthly Wholesale Trade
Inventories, M/M% (expected -0.2%; previous +0%)
10:30 AM ET. EIA Weekly Natural Gas Storage Report
Working Gas In Storage (Cbf) (previous 2446B)
Working Gas In Storage, Net Chg (Cbf) (previous +110B)
2:00 PM ET. SEC Closed Meeting
4:30 PM ET. Foreign Central Bank Holdings
4:30 PM ET. Federal Discount Window Borrowings
Friday, June 9, 2023
10:00 AM ET. 1st Quarter Quarterly Services
12:00 PM ET. World Agricultural Supply & Demand Estimates (WASDE)
Corn, End Stocks (Bushels)
Soybeans, End Stocks (Bushels)
Wheat, End Stocks (Bushels)
Cotton, End Stocks (Bales)
Monday, June 12, 2023
2:00 PM ET. May Monthly Treasury Statement of Receipts and Outlays of the U.S. Government
The STOCK INDEXES? http://quotes.ino.com/ex?changes/?c=indexes
The Dow closed higher on Wednesday.Today's high-range close sets the stage for a steady to higher opening when Thursday's day session begins trading. Stochastics and the RSI are neutral to bullish signaling that sideways to higher prices are possible near-term. If the Dow extends the rally off May's low, May's high crossing at 34,257.83 is the next upside target. Closes below last-Thursday's low crossing at 32,704.51 would signal that a short-term top has been posted. First resistance is last-Friday's high crossing at 33,792.14. Second resistance is May's high crossing at 34,257.83. First support is last-Thursday's low crossing at 32,704.51. Second support is May's low crossing at 32,586.56. Third support is the 38% retracement level of the October-December rally crossing at 32,399.25.
The June NASDAQ 100 closed sharply lower on Wednesday. The low-range close sets the stage for a steady to lower opening when Thursday's day session begins trading. Stochastics and the RSI are overbought but remain neutral to bullish signaling sideways to higher prices are possible. If June extends this year's rally, the 87% retracement level of the 2022-decline crossing at 14,801.49 is the next upside target. Closes below the 20-day moving average crossing at 13,973.35 would signal that a short-term top has been posted. First resistance is Monday's high crossing at 14,694.75. Second resistance is the 87% retracement level of the 2022-decline crossing at 14,801.49. First support is the 10-day moving average crossing at 14,323.75. Second support is the 20-day moving average crossing at 13,973.36.
The June S&P 500 closed lower on Wednesday. The low-range close sets the stage for a steady to lower opening when Thursday's day session begins trading. Stochastics and the RSI are overbought but remain neutral to bullish signaling that sideways to higher prices are possible near-term. If June extends the rally off March's low, the 62% retracement level of 2022's decline crossing at 4321.54 is the next upside target. Closes below the 20-day moving average crossing at 4196.30 would confirm that a short-term top has been posted. First resistance is Monday's high crossing at 4305.75. Second resistance is the 62% retracement level of 2022's decline crossing at 4321.54. First support is the 20-day moving average crossing at 4196.30. Second support is the 50-day moving average crossing at 4158.43.
INTEREST RATES? http://quotes.ino.com/ex?changes/?c=interest ""
September T-bonds closed down 1-17/32's at 126-12.
September T-bonds closed sharply lower on Wednesday. The low-range close sets the stage for a steady to lower opening when Thursday's day session begins trading. Stochastics and the RSI are turning neutral to bearish signaling that sideways to lower prices are possible near-term. If September renews the decline off April's high, the 87% retracement level of the March- April rally crossing at 124-19 is the next downside target. Closes above last-Thursday's high crossing at 129-16 would confirm that a short-term low has been posted while opening the door for additional gains near-term. First resistance is last-Thursday's high crossing at 129-16. Second resistance is the 50-day moving average crossing at 130-05. First support is the 75% retracement level of the March-April rally crossing at 125-30. Second support is the 87% retracement level of the March- April rally crossing at 124-19.
September T-notes closed down 200-pts. At 113.050.
June T-notes closed sharply lower on Wednesday. The low-range close sets the stage for a steady to lower opening when Thursday's day session begins trading. Stochastics and the RSI are turning neutral to bearish signaling that sideways to lower prices are possible near-term. If June renews the decline off May's high, the 75% retracement level of March's rally crossing at 112.190 is the next downside target. Closes above last-Thursday's high crossing at 115.000 would signal that a short-term low has been posted. First resistance is last-Thursday's high crossing at 115.000. Second resistance is the 50-day moving average crossing at 115.160. First support is the 75% retracement level of March's rally crossing at 112.190. Second support is the 87% retracement level of March's rally crossing at 111.243.
ENERGY MARKETS? http://quotes.ino.com/ex?changes/?c=energy ""
July crude oil closed higher on Wednesday.The high-range close sets the stage for a steady to higher opening when Thursday's day session begins. Stochastics and the RSI are neutral to bullish signaling that sideways to higher prices are possible near-term. Closes above the 50-day moving average crossing at $74.68 would confirm that a short-term low has been posted while opening the door for additional short-term gains. Closes below last-Wednesday's low crossing at $67.03 would signal that a double top has been posted with the late-May high. First resistance is the 50-day moving average crossing at $74.68. Second resistance is the April 28th high crossing at $76.74. First support is last-Wednesday's low crossing at $67.03. Second support is May's low crossing at $63.90.
July heating oil closed higher on Wednesday. The high-range close sets the stage for a steady to higher opening when Thursday's day trading session begins. Stochastics and the RSI are neutral to bullish signaling that sideways to higher prices are possible near-term. Closes above the 50-day moving average crossing at $2.4335 would signal that a short-term low has been posted while opening the door for additional gains near-term. If July renews the decline off April's high, May's low crossing at $2.1550 is the next downside target. First resistance is the 50-day moving average crossing at $2.4335. Second resistance is the April 25th high crossing at $2.5326. First support is last-Wednesday's low crossing at $2.2268. Second support is May's low crossing at $2.1550.
July unleaded gas closed sharply higher on Wednesday as it renewed the rally off May's low. The high-range close sets the stage for a steady to higher opening when Thursday's day session begins trading. Stochastics and the RSI are neutral to bullish signaling that sideways to higher prices are possible near-term. If July extends the rally off May's low, the 87% retracement level of the April-May decline crossing at 2.6979 is the next upside target. Closes below the 20-day moving average crossing at 2.5029 would signal that a short-term top has been posted. First resistance today's high crossing at 2.6527. Second resistance is the 75% retracement level of the April-May decline crossing at 2.6803. First support is the June low crossing at 2.4016. Second support is the May 15th low crossing at 2.3565.
July Henry natural gas closed slightly higher on Wednesday as it consolidated some of the decline off May's high. The high-range close sets the stage for a steady to higher opening when Thursday's day session begins trading. Stochastics and the RSI are turning neutral to bullish signaling that sideways to higher prices are possible near-term. Closes above the 50-day moving average crossing at 2.498 would signal that a short-term low has been posted. If July renews the decline off March's high, the September-2020 low on the monthly continuation chart crossing at 1.795 is the next downside target.First resistance is the 20-day moving average crossing at 2.419. Second resistance is the 50-day moving average crossing at 2.498. First support is last-Thursday's low crossing at 2.136. Second support is the September-2020 low on the monthly continuation chart crossing at 1.795.
CURRENCIES? http://quotes.ino.com/ex?changes/?c=currencies ""
The September Dollar closed slightly lower on Wednesday as it consolidates above the 25% retracement level of the September-February decline crossing at $103.281. The high-range close sets the stage for a steady to higher opening when Thursday's session begins trading. Stochastics and the RSI are neutral to bearish signaling that sideways to lower prices are possible near-term. Closes below the 20-day moving average crossing at 103.063 would signal that a short-term top has been posted. If September extends the rally off May's low, the March 15th high crossing at 104.250 is the next upside target. First resistance is the March 15th high crossing at 104.250. Second resistance is the March 8th high crossing at 104.730. First support is the 20-day moving average crossing at 103.063. Second support is the 50-day moving average crossing at 101.940.
The September Euro closed slightly higher on Wednesday. The mid-range close sets the stage for a steady to higher opening when Thursday's day session begins trading. Stochastics and the RSI are turning neutral to bearish signaling that sideways to lower prices is possible near-term. If September extends the decline off May's high, the 38% retracement level of the 2022-2023 rally crossing at $1.06472 is the next downside target. Closes above the 20-day moving average crossing at $1.08525 would signal that a short-term low has been posted. First resistance is the 20-day moving average crossing at $1.08525. Second resistance is the 50-day moving average crossing at 1.09716. First support is last-Wednesday's low crossing at $1.07025. Second support is the 38% retracement level of the 2022-2023 rally crossing at $1.06472.
The September British Pound closed slightly higher on Wednesday. The mid-range close sets the stage for a steady to higher opening when Thursday's day session begins trading. Stochastics and the RSI are neutral to bearish signaling sideways to lower prices are possible near-term. If September resumes the decline off May's high, the 25% retracement level of the 2022-2023 rally crossing at 1.2100 is the next downside target. If September renews last-week's rally, May's high crossing at 1.2705 is the next upside target. First resistance is last-Friday's high crossing at 1.2564. Second resistance is May's high crossing at 1.2705. First support is May's low crossing at 1.2333. Second support is April's low crossing at 1.2316.
The September Swiss Franc closed lower on Wednesday. The low-range close sets the stage for a steady to lower opening when Thursday's day session begins trading. Stochastics and the RSI are turning neutral to bearish signaling that sideways to lower prices are possible near-term. If September resumes the decline off May's high, the 38% retracement level of 2022-2023 rally crossing at 1.10197 is the next downside target. Closes above the 50-day moving average crossing at 1.12808 would signal that a short-term low has been posted. First resistance is the 50-day moving average crossing at 1.12908. Second resistance is the May 4th high crossing at 1.14920. First support is the 38% retracement level of 2022-2023 rally crossing at 1.10197. Second support is the 50% retracement level of 2022-2023 rally crossing at 1.08741.
The September Canadian Dollar closed higher on Wednesday as it extends the rally off May's low. The mid-range close sets the stage for a steady to higher opening when Thursday's day session begins trading. Stochastics and the RSI are overbought but remain neutral to bullish signaling that sideways to higher prices are possible near-term. If September extends the aforementioned rally, April's high crossing at 75.31 is the next upside target. Closes below the 10-day moving average crossing at 74.18 would signal that a short-term top has been posted. First resistance is today's high crossing at 75.21. Second resistance is April's high crossing at 75.31. First support is the 10-day moving average crossing at 74.18. Second support is May's low crossing at 73.44.
The September Japanese Yen closed lower on Wednesday. The low-range close sets the stage for a steady to lower opening when Thursday’s day session begins trading. Stochastics and the RSI are turning neutral to bearish signaling that sideways to lower prices are possible near-term. If September extends the decline off March's high, the 87% retracement level of the October-January rally crossing at 0.070777 is the next downside target. Closes above the 20-day moving average crossing at 0.073649 would signal that a short-term low has been posted. First resistance is the 20-day moving average crossing at 0.073694. Second resistance is the 50-day moving average crossing at 0.075304. First support is the 75% retracement level of the October-January rally crossing at 0.072174. Second support is the 87% retracement level of the October-January rally crossing at 0.070777.
PRECIOUS METALS? http://quotes.ino.com/ex?changes/?c=metals ""
August gold closed sharply lower on Wednesday as it extends the trading range of the past four-weeks. The low-range close sets the stage for a steady to lower opening when Thursday's day session begins trading. Stochastics and the RSI are neutral to bearish signaling that sideways to lower prices are possible near-term. If August renews the decline off May's high, the 38% retracement level of the 2022-2023 rally crossing at $1941.90. Closes above the 50-day moving average crossing at $2017.90 would signal that a short-term low has been posted. First resistance is the 20-day moving average crossing at $1995.40. Second resistance is the 50-day moving average crossing at $2017.90. First support is the 38% retracement level of the 2022-2023 rally crossing at $1941.90. Second support is the 50% retracement level of the 2022-2023 rally crossing at $1892.30.
July silver closed slightly lower on Wednesday. The low-range close sets the stage for a steady to lower opening when Thursday's day session begins trading. Stochastics and the RSI are neutral to bullish signaling that sideways to higher prices are possible near-term. Closes above last-Friday's high crossing at 24.120 would signal that a short-term low has been posted while opening the door for additional gains near-term. If July renews the decline off May's high, the 62% retracement level of the March-May rally crossing at 22.546 is the next downside target. First resistance is last-Friday's high crossing at 24.120. Second resistance is the 50-day moving average crossing at 24.682. First support is the 62% retracement level of the March-May rally crossing at 22.546. Second support is the 75% retracement level of the March-May rally crossing at 21.708.
July copper closed slightly lower on Wednesday as it consolidates some of the rally off May's low. The low-range close sets the stage for a steady to lower opening when Thursday's day session begins trading. Stochastics and the RSI are overbought but remain neutral to bullish signaling that sideways to higher prices are possible near-term. If July extends the rally off May's low, the 50-day moving average crossing at 3.8755 is the next upside target. If July renews the decline off April's high, the 75% retracement level of the 2022-2023 rally crossing at 3.4683 is the next downside target. First resistance is today's high crossing at 3.8115. Second resistance is the 50-day moving average crossing at 3.8755. First support is May's low crossing at 3.5450. Second support is the 75% retracement level of the 2022-2023 rally crossing at 3.4683.
GRAINS? http://quotes.ino.com/ex?changes/?c=grains "
July Corn closed down $0.03 3/4-cents at $6.04 1/4.
July corn post closed lower on Wednesday. The low-range close sets the stage for a steady to lower opening when Thursday's night session begins trading. Stochastics and the RSI are overbought but remain neutral to bullish signaling that sideways to higher prices are possible near-term. If July extends the rally off May's low, the 75% retracement level of the April-May decline crossing at $6.22 1/2 is the next upside target. Closes below last-Friday's low crossing at $5.81 1/4 would temper the near-term friendly outlook. First resistance is Monday's high crossing at $6.14. Second resistance is the 75% retracement level of the April-May decline crossing at $6.22 1/2. First support is last-Wednesday's low crossing at $5.77 1/2. Second support is May's low crossing at $5.47.
July wheat closed down $0.11-cents at $6.16 3/4.
July wheat closed lower on Wednesday as it consolidates some of the rally off last-Wednesday's low. The low-range close sets the stage for a steady to lower opening when Thursday's day session begins trading. Stochastics and the RSI are neutral to bullish signaling signaling that sideways to higher prices are possible near-term. Closes above the 50-day moving average crossing at $6.51 3/4 would open the door for a possible test of May's high crossing at $6.69 later this week. If July renews the decline off February's high, the March-2021 low crossing at $5.71 is the next downside target. First resistance is the 50-day moving average crossing at $6.51 3/4. Second resistance is May's high crossing at $6.69. First support is last-Wednesday's low crossing at $5.73 1/4. Second support is the March-2021 low crossing at $5.71.
July Kansas City Wheat closed down $0.32 1/4-cents at $7.88.
July Kansas City wheat closed sharply lower on Wednesday as it consolidates some of the rally off last-Wednesday's low. The low-range close sets the stage for a steady to lower opening when Thursday's day session begins trading. Stochastics and the RSI are turning neutral to bearish signaling that sideways to lower prices are possible near-term. Closes above the 20-day moving average crossing at $8.33 1/4 would signal that a short-term low has been posted. If July renews the decline off May's high, the 87% retracement level of May's rally crossing at $7.59 3/4 is the next downside target. First resistance is the 20-day moving average crossing at $8.33 1/4. Second resistance is the May 10th high crossing at $8.63 3/4. First support is the 87% retracement level of May's rally crossing at $7.59 3/4. Second support is May's low crossing at $7.36 1/4.
July Minneapolis wheat closed down $0.22 1/2-cents crossing at $7.94.
July Minneapolis wheat closed lower on Wednesday as it consolidates some of the rally off last-Wednesday's low. The low-range close sets the stage for a steady to lower opening when Thursday's day session begins trading. Stochastics and the RSI are turning neutral to bearish signaling that sideways to lower prices are possible near-term. If July renews the decline off May's high, May's low crossing at $8.69 is the next downside target. Closes above the 50-day moving average crossing at $8.38 3/4 would signal that a short-term low has been posted. First resistance is the 50-day moving average crossing at $8.38 3/4. Second resistance is May's high crossing at $8.88 1/2. First support is last-Wednesday's low crossing at $7.75 1/2. Second support is May's low crossing at $7.69.
SOYBEAN COMPLEX? http://quotes.ino.com/ex?changes/?c=grains "
July soybeans closed up $0.07 1/2-cents at $13.60 3/4.
July soybeans closed higher on Wednesday as it extends the rally off last-Wednesday's low. The mid-range close sets the stage for a steady to higher opening when Thursday's day session begins trading. Stochastics and the RSI are neutral to bullish signaling that sideways to higher prices are possible near-term. If July extends the rally off last-Wednesday's low, the 50-day moving average crossing at $14.08 1/2 is the next upside target. Closes below the 10-day moving average crossing at $13.32 1/2 would signal that a short-term top has been posted. If July renews this year's decline, the 50% retracement level of the 2020-2022 crossing at $12.12 is the next downside target. First resistance is the 50-day moving average crossing at $14.08 1/2. Second resistance is May's high crossing at $14.46 3/4. First support is May's low crossing at $12.70 3/4. Second support is the 50% retracement level of the 2020-2022 crossing at $12.12.
July soybean meal closed up $8.50 at $405.20.
July soybean meal closed higher on Wednesday. The high-range close sets the stage for a steady to higher opening when Thursday's day session begins trading. Stochastics and the RSI are neutral to bullish signaling that sideways to higher prices are possible near-term. Closes above the 20-day moving average crossing at $409.90 would signal that a short-term low has been posted. If July renews the decline off March's high, the 62% retracement level of the 2020-2023 rally crossing at $365.60 is the next downside target. First resistance is the 20-day moving average crossing at $409.90. Second resistance is the 50-day moving average crossing at $430.40. First support is last-Wednesday's low crossing at $386.30. Second support is the 62% retracement level of the 2020-2023 rally crossing at $365.60.
July soybean oil closed down 45-pts. at 50.47.
July soybean oil closed lower on Wednesday as it consolidates some of the rally off last-Wednesday's low.The low-range close sets the stage for a steady to lower opening when Thursday's day session begins trading. Stochastics and the RSI are overbought but remain neutral to bullish signaling that sideways to higher prices are possible near-term. If July extends the rally off last-Wednesday's low, the 50-day moving average crossing at 51.83 is the next upside target. If July renews this year's decline, the 75% retracement level of the 2020-2022 rally crossing at 40.19 is the next downside target. First resistance is the 50-day moving average crossing at 51.83. Second resistance is May's high crossing at 55.12. First support is last-Wednesday's low crossing at 44.53. Second support is the 75% retracement level of the 2020-2022 rally crossing at 40.19.
LIVESTOCKhttp://quotes.ino.com/exchanges/?c=livestock
July hogs closed down $1.10 at $87.23.
July hogs closed lower on Wednesday as it consolidated some of the rally off May's low. The mid-range close sets the stage for a steady to lower opening when Thursday's day session begins trading. Stochastics and the RSI are overbought but remain neutral to bullish signaling that sideways to higher prices are possible near-term. If July extends the rally off May's low, the April 28th high crossing at $94.00 is the next upside target. Closes below the 10-day moving average crossing at $82.21 would signal that a short-term top has been posted. First resistance is today's high crossing at $88.73. Second resistance is the April 28th high crossing at $94.00. First support is last-Wednesday's gap crossing at $79.53. Second support is May's low crossing at $74.02.
August cattle closed down $2.13 at $173.38.
August cattle posted a key reversal down as it closed sharply lower on Wednesday. The low-range close sets the stage for a steady to lower opening on Thursday. Stochastics and the RSI are overbought but remain neutral to bullish signaling that sideways to higher prices are possible near-term. If August extends this year's rally unto uncharted territory, upside targets will be hard to project. Closes below the 20-day moving average crossing at $166.16 would signal that a top has been posted. First resistance is today's high crossing at $178.10. Second resistance is unknown. First support is the 10-day moving average crossing at $169.64. Second support is the 20-day moving average crossing at $166.16.
August Feeder cattle closed down $4.63 at $238.63.
August Feeder cattle posted a key reversal down as it closed sharply lower on Wednesday. The low-range close sets the stage for a steady to lower opening when Thursday's day session begins trading. Stochastics and the RSI are overbought but are turning neutral to bearish signaling that sideways to lower prices are possible near-term. Closes below the 20-day moving average crossing at $235.00 would signal that a short-term top has been posted. If August extends the rally off May's low, the October-2014 high on the monthly continuation chart crossing at $245.20 is the next upside target. First resistance is today's high crossing at $245.18. Second resistance is the October-2014 high on the monthly continuation chart crossing at $245.20. First support is the 10-day moving average crossing at $238.81. Second support is the 20-day moving average crossing at $235.00.
FOOD & FIBERhttp://quotes.ino.com/ex changes/?c=food
July coffee closed higher on Wednesday. The high-range close sets the stage for a steady to higher opening on Thursday. Stochastics and the RSI have turned neutral to bullish signaling sideways to higher prices are possible near-term. Closes above last-Friday's high crossing at $18.78 would signal that a short-term low has been posted. If July renews the decline off April's high, March's low crossing at $16.56 is the next downside target. First resistance is last-Friday's high crossing at $18.78. Second resistance is May's high crossing at $19.44. First support is last-Wednesday's low crossing at $17.56. Second support is March's low crossing near $16.56.
July cocoa posted a key reversal up as it closed sharply higher on Wednesday to extend this year's rally. The high-range close sets the stage for a steady to higher opening on Thursday. Stochastics and the RSI are neutral to bullish signaling that sideways to higher prices are possible near-term. If July extends the rally off March's low, monthly resistance crossing at 32.15 is the next upside target. Closes below the 20-day moving average crossing at 30.17 would signal that a short-term top has been posted.
July sugar closed slightly lower on Wednesday, The low-range close sets the stage for a steady to lower opening on Thursday. Stochastics and the RSI are oversold but remain neutral to bearish signaling that sideways to lower prices are possible near-term. Multiple closes below the 50-day moving average crossing at 24.63 would open the door for additional weakness near-term. Closes above the 20-day moving average crossing at 25.48 would signal that a short-term low has been posted.
July cotton closed lower on Wednesday. The high-range close sets the stage for a steady to slightly lower opening on Thursday. Stochastics and the RSI are neutral to bearish signaling sideways to lower prices are possible near-term. Closes below the 50-day moving average crossing at 82.69 would signal that a top has been posted. If July extends the rally off the May 25th low crossing at 79.86, May's high crossing at 87.98 is the next upside target.
Thanks, tallpine!
Rain forecasts are going back and forth but there's more rain in the forecast than there was several days ago.
7 Day Total precipitation below:
http://www.wpc.ncep.noaa.govcdx /qpf/p168i.gif?1530796126

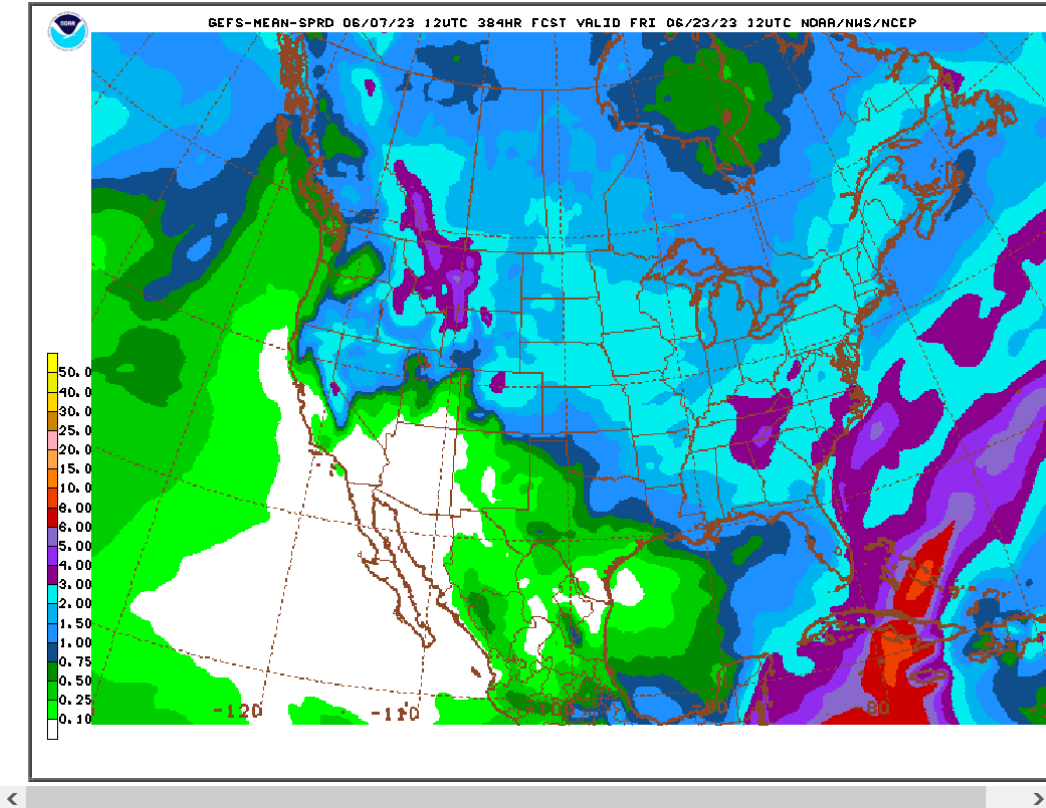
1. The last 12z GEFS
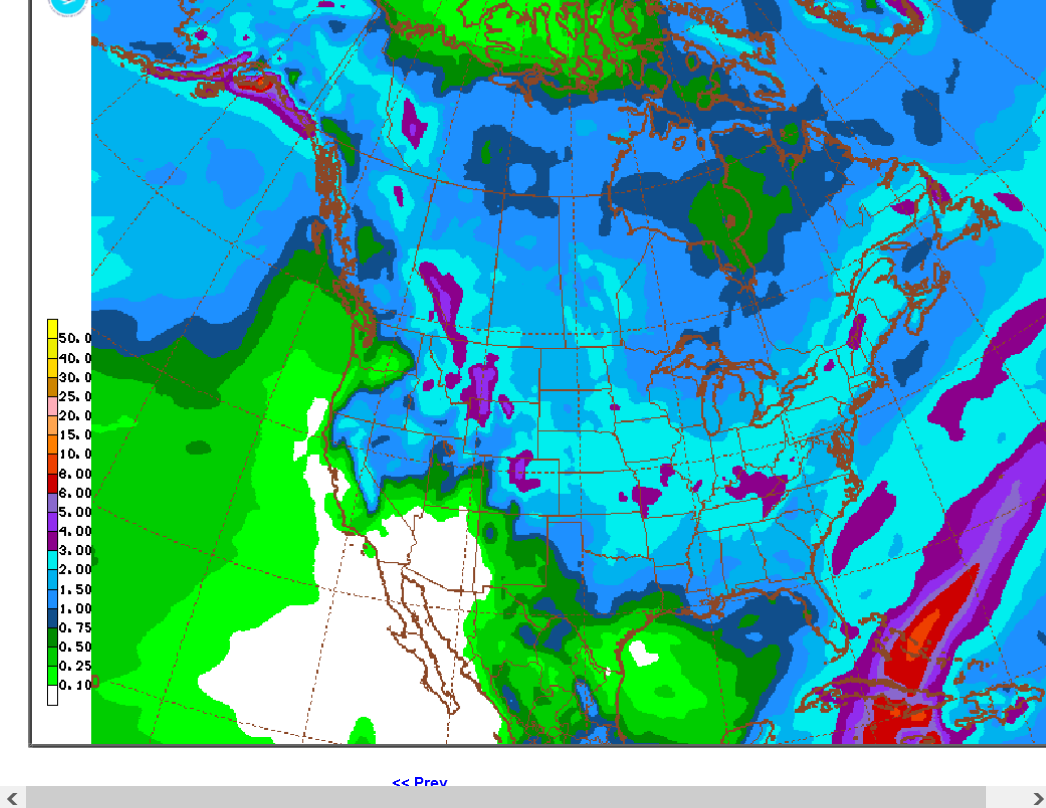
2. 18z GEFS from 18 hours ago.