KEY EVENTS TO WATCH FOR:
Friday, June 9, 2023
10:00 AM ET. 1st Quarter Quarterly Services
12:00 PM ET. World Agricultural Supply & Demand Estimates (WASDE)
Corn, End Stocks (Bushels)
Soybeans, End Stocks (Bushels)
Wheat, End Stocks (Bushels)
Cotton, End Stocks (Bales)
Monday, June 12, 2023
2:00 PM ET. May Monthly Treasury Statement of Receipts and Outlays of the U.S. Government
The STOCK INDEXES? http://quotes.ino.com/ex?changes/?c=indexes
The STOCK INDEXES: The September NASDAQ 100 was steady to slightly lower overnight as it extends the trading range of the past two-weeks. Overnight trading set the stage for a slightly lower opening when the day session begins trading. Stochastics and the RSI are overbought but are turning neutral to bearish signaling that sideways to lower prices are possible near-term. Closes below the 20-day moving average crossing at 14,243.21 would signal that a short-term top has been posted. If June extends this year's rally, the 75% retracement level of the 2021-2022-decline on the weekly continuation chart crossing at 15,202.41 is the next upside target. First resistance is the 75% retracement level of the 2021-2022-decline on the weekly continuation chart crossing at 15,202.41. Second resistance is the March-2022 high on the weekly continuation chart crossing at 15,268.75. First support is the 20-day moving average crossing at 14,243.21. Second support is the 50-day moving average crossing at 13,686.59.
The September S&P 500 was steady to slightly lower overnight as it extends this week's trading range. Overnight trading sets the stage for a slightly lower opening when the day session begins trading. Stochastics and the RSI are overbought but remain neutral to bullish signaling that sideways to higher prices are possible near-term. If June extends the rally off March's low, the August-2022 high crossing at 4409.00 is the next upside target. Closes below the 20-day moving average crossing at 4252.09 would signal that a short-term top has been posted. First resistance is Monday's high crossing at 4348.75. Second resistance the August-2022 high crossing at 4409.00. First support is the 10-day moving average crossing at 4299.68. Second support is the 20-day moving average crossing at 4252.09.
INTEREST RATES http://quotes.ino.com/ex changes/?c=interest"
INTEREST RATES: September T-bonds were lower overnight. Overnight trading sets the stage for a lower opening when the day session begins trading. Stochastics and the RSI have turned neutral to bearish signaling that sideways to lower prices are possible near-term. If September renews the decline off April's high, the 87% retracement level of the March-April rally crossing at 124-19 is the next downside target. Closes above Wednesday's high crossing at 128-16 would signal that a short-term low has been posted. First resistance is last-Friday's high crossing at 129-16. Second resistance is the 50-day moving average crossing at 130-02. First support is the 75% retracement level of the March-April rally crossing at 125-30. Second support is the 87% retracement level of the March-April rally crossing at 124-19.
September T-notes were lower overnight. Overnight trading sets the stage for a lower opening when the day session begins trading. Stochastics and the RSI are neutral to bearish signaling that sideways to lower prices are possible near-term. If September renews the decline off May's high, the 75% retracement level of the March rally crossing at 112.190 is the next downside target. Closes above the 20-day moving average crossing at 114.115 would signal that a short-term low has been posted. First resistance is last-Thursday's high crossing at 115.000. Second resistance is the 50-day moving average crossing at 115.139. First support is the 75% retracement level of the March-May rally crossing at 112.190. Second support is the 87% retracement level of the 2022-2023 rally crossing at 111.243.
ENERGY MARKETS? http://quotes.ino.com/ex?changes/?c=energy ""
ENERGIES:Julycrude oil was slightly higher overnight as it extends the May-June trading range. Overnight trading sets the stage for a steady to slightly higher opening when the day session begins trading. Stochastics and the RSI are neutral to bearish signaling that sideways to lower prices are possible near-term. Closes above Monday's high crossing at $75.06 would mark an upside breakout of the aforementioned trading range as it would signal the resumption of the rally off May's low. Closes below the May 31st low crossing at $67.03 would open the door for a possible test of May's low crossing at $63.90. First resistance is Monday's high crossing at $75.06. Second resistance is the April 28th high crossing at $76.74. First support is the May 31st low crossing at $67.03. Second support is the May low crossing at $63.90.
July heating oil was steady to slightly higher overnight and set sets the stage for a slightly higher opening when the day session begins trading. Stochastics and the RSI are becoming overbought but remain neutral to bullish signaling that sideways to higher prices are possible near-term. Closes above the 50-day moving average crossing at 2.4283 would open the door for additional gains and a possible test of the April 25th high crossing at 2.5325. Closes below last-Wednesday's low crossing at 2.2268 would open the door for a possible test of May's low crossing at 2.1550. First resistance is the 50-day moving average crossing at 2.4283. Second resistance is the April 24th high crossing at 2.5332. First support is last-Wednesday's low crossing at 2.2268. Second support is May's low crossing at 2.1550.
July unleaded gas was steady to slightly higher overnight. Overnight trading sets the stage for a slightly higher opening when the day session begins trading. Stochastics and the RSI are overbought but remain neutral to bullish signaling that sideways to higher prices are possible near-term. If July extends the rally off May's low, the 87% retracement level of the April-May decline crossing at $2.6958 is the next upside target. Closes below the 20-day moving average crossing at 2.5218 would signal that a short-term top has been posted. First resistance is the 87% retracement level of the April-May decline crossing at $2.6958. Second resistance is April's high crossing at $2.7675. First support is the June 1st low crossing at 2.4016. Second support is the May 15th low crossing at $2.3565.
July natural gas was steady to slightly lower overnight and sets the stage for a slightly lower opening when the day session begins trading. Stochastics and the RSI are turning neutral to bullish signaling that sideways to higher prices are possible near-term. Closes above the 50-day moving average crossing at 2.483 would signal that a short-term low has been posted. If July renews the decline off March's high, the September-2020 low on the monthly continuation chart crossing at 1.795 is the next downside target. First resistance is the 50-day moving average crossing at 2.483. Second resistance is the May 19th high crossing at 2.816. First support is last-Thursday's low crossing at 2.136. Second support is the September-2020 low on the monthly continuation chart crossing at 1.795.
CURRENCIEShttp://quotes.ino.com/ex changes/?c=currencies"
CURRENCIES:The September Dollar was steady to slightly higher overnight as it consolidates some of Thursday's loss. Overnight trading sets the stage for a higher opening when the day session begins trading later this morning. Stochastics and the RSI are neutral to bearish signaling that sideways to lower prices are possible near-term. Closes below Thursday's low crossing at $102.875 would signal that a short-term top has been posted while opening the door for additional weakness near-term. If September renews the rally off May's low, the 38% retracement level of the 2022-2023 decline crossing at $104.932 is the next upside target. First resistance is the March 15th high crossing at $104.250. Second resistance is the 38% retracement level of the 2022-2023 decline crossing at $104.932.First support is Thursday's low crossing at $102.875. Second support is the 50-day moving average crossing at $101.988.
The September Euro was lower overnight as it extends the trading range of the past two-weeks. Overnight trading sets the stage for a lower opening when the day session begins trading. Stochastics and the RSI are neutral to bullish signaling that sideways to higher prices are possible near-term. Closes above the 20-day moving average crossing at $1.08332 would signal that a short-term low has been posted while opening the door for additional gains near-term. If September renews the decline off April's high, the 38% retracement level of the 2022-2023 rally crossing at 1.06472 is the next downside target. First resistance is the 20-day moving average crossing at $1.08332. Second resistance is the 50-day moving average crossing at $1.09659. First support is the 38% retracement level of the 2022-2023 rally crossing at 1.06472. Second support is the 50% retracement level of the 2022-2023 rally crossing at 1.04833.
The September British Pound was slightly lower overnight as it consolidates some of Thursday's rally. Overnight trading sets the stage for a slightly lower opening when the day session begins trading. Stochastics and the RSI remain neutral to bullish signaling that sideways to higher prices near-term. If September extends the rally off May's low, May's high crossing at 1.2705 is the next upside target. If September renews the decline off May's high, April's low crossing at 1.2316 is the next downside target. First resistance is the overnight high crossing at 1.2588. Second resistance is the May 10th high crossing at 1.2705. First support is April's low crossing at 1.2316. Second support is the 25% retracement level of the 2022-2023 rally crossing at 1.2100.
The September Swiss Franc was lower overnight as it consolidates some of Thursday's rally. Overnight trading sets the stage for a lower opening when the day session begins trading. Stochastics and the RSI are neutral to bullish signaling that sideways to higher prices are possible near-term. If September extends the rally off May's low, the 50-day moving average crossing at 1.12855 is the next upside target. If September resumes the decline off May's high, the 38% retracement level of the 2022-2023 rally crossing at 1.10197 is the next downside target. First resistance is the 50-day moving average crossing at 1.12855. Second resistance is May's high crossing at 1.14920. First support is May's low crossing at 1.10700. Second support is the 38% retracement level of the 2022-2023 rally crossing at 1.10197.
The September Canadian Dollar was higher overnight as it extends the rally off the May 26th low. Overnight trading sets the stage for a higher opening when the day session begins trading. Stochastics and the RSI are overbought but remain neutral to bullish signaling that sideways to higher prices are possible near-term. If September extends the rally off the May 26th low, April's high crossing at $75.31 is the next upside target. Closes below the 20-day moving average crossing at $74.31 would signal that a short-term top has been posted. First resistance is May's high crossing at $75.26. Second resistance is April's high crossing at $75.31. First support is the 20-day moving average crossing at $74.31. Second support is April's low crossing at $73.39.
The September Japanese Yen was lower overnight as it extends the trading range of the past three-weeks. Overnight trading sets the stage for a lower opening when the day session begins trading. Stochastics and the RSI are neutral to bullish signaling that sideways to higher prices are possible near-term. Closes above the 20-day moving average crossing at 0.073356 would signal that a short-term low has been posted. If September renews the decline off the March's high, the 87% retracement level of the 2022-2023 rally crossing at 0.070777 is the next downside target. First resistance is the 20-day moving average crossing at 0.073356. Second resistance is the 50-day moving average crossing at 0.075128. First support is the 75% retracement level of the 2022-2023 rally crossing at 0.072174. Second support is the 87% retracement level of the 2022-2023 rally crossing at 0.070777.
PRECIOUS METALS http://quotes.ino.com/ex changes/?c=metals"
Precious Metals: Augustgold was slightly lower overnight as it extends the trading range of the past four-weeks. Overnight trading sets the stage for a slightly lower opening when the day session begins trading later this morning. Stochastics and the RSI are neutral signaling that sideways trading is possible near-term. Closes above the 50-day moving average crossing at $2016.90 would signal that a short-term low has been posted. If August renews the decline off May's high, the 38% retracement level of the September-May rally crossing at $1941.90 is the next downside target. First resistance is the 50-day moving average crossing at $2016.90. Second resistance is the May 4th high crossing at $2102.20. First support is the 38% retracement level of the September-May rally crossing at $1941.90. Second support is the 50% retracement level of the September-May rally crossing at $1892.30.
July silver was slightly higher overnight as it extends the rally off May's low. Overnight trading sets the stage for a slightly higher opening when the day session begins trading later this morning. Stochastics and the RSI are neutral to bullish signaling that sideways to higher prices are possible near-term. If July extends the rally off May's low, the 50-day moving average crossing at $24.712 is the next upside target. Closes below Monday's low crossing at $23.320 would signal that a short-term top has been posted. First resistance is the overnight high crossing at $24.540. Second resistance is the 50-day moving average crossing at $24.712. First support is the 62% retracement level of the March-April rally crossing at $22.546. Second support is the 75% retracement level of the March-April rally crossing at $21.708.
July copper was steady to slightly lower overnight. Overnight trading sets the stage for a slightly lower opening when the day session begins trading. Stochastics and the RSI are overbought but remain neutral to bullish signaling that sideways to higher prices are possible near-term. If July extends the rally off May's low, the 50-day moving average crossing at 3.8637 is the next upside target. Closes below the 20-day moving average crossing at 3.7059 would temper the near-term friendly outlook. First resistance is the 50-day moving average crossing at 3.8637. Second resistance is the May 8th high crossing at 3.9595. First support is the 75% retracement level of the 2022-2023 rally crossing at 3.4683. Second support is the 87% retracement level of the 2022-2023 rally crossing at 3.3261.
GRAINS http://quotes.ino.com/ex changes/?c=grains
July corn was lower overnight as traders remain cautious about extending the rally off May's low ahead of this weekends weather forecast that is calling for scattered rain across the Midwest. Overnight trading sets the stage for a lower opening when the day sessions begins trading. Stochastics and the RSI are overbought but remain neutral to bullish signaling that sideways to higher prices are possible near-term. If July extends the rally off May's low, the 75% retracement level of the April-May decline crossing at $6.22 1/2 is the next upside target. Closes below last-Wednesday's low crossing at $5.77 1/2 would confirm that a short-term top has been posted.First resistance is the 62% retracement level of the April-May decline crossing at $6.09 1/4. Second resistance is the 75% retracement level of the April-May decline crossing at $6.22 1/2. First support is last-Wednesday's low crossing at $5.77 1/2. Second support is May's low crossing at $5.47.
July wheat was slightly lower overnight and sets the stage for a slightly lower opening when the day session begins trading. Stochastics and the RSI are neutral to bullish signaling that sideways to higher prices are possible near-term. If July extends the rally off May's low, the 50-day moving average crossing at $6.48 1/4 is the next upside target. Closes below the 10-day moving average crossing at $6.15 would signal that a short-term top has been posted. First resistance is the 50-day moving average crossing at $6.48 1/4. Second resistance is May's high crossing at $6.69. First support is May's low crossing at $5.73 1/4. Second support is the March-2021 low crossing at $5.71.
July Kansas City wheat was lower overnight. Overnight trading sets the stage for a lower opening when the day session begins trading later this morning. Stochastics and the RSI are neutral to bullish signaling that sideways to higher prices are possible near-term. Closes above the 50-day moving average crossing at $8.29 would signal that a short-term low has been posted. If July renews the decline off May's high, the 87% retracement level of this month's rally crossing at $7.59 3/4 is the next downside target. First resistance is the 50-day moving average crossing at $8.29. Second resistance is the May 10th high crossing at $8.63 3/4. First support is the 87% retracement level of this month's rally crossing at $7.59 3/4. Second support is May's low crossing at $7.36 1/4.
July Minneapolis wheat was lower overnight and sets the stage for a lower opening when the day session begins trading. Stochastics and the RSI are neutral to bullish signaling that sideways to higher prices are possible near-term. Closes above the 50-day moving average crossing at $8.36 would open the door for additional gains and a possible test of May's high crossing at $8.88 1/2 later this month. If July extends Wednesday's decline, the May 31st low crossing at $7.75 1/2 is the next downside target. First resistance is the 50-day moving average crossing at $8.36. Second resistance is May's high crossing at $8.88 1/2. First support is the May 31st low crossing at $7.75 1/2. Second support is May's low crossing at $7.69.
SOYBEAN COMPLEX? http://quotes.ino.com/ex?changes/?c=grains "
July soybeans were higher overnight as it extends the rally off May's low. Overnight trading sets the stage for a higher opening when the day session begins trading later this morning. Stochastics and the RSI are overbought but remain neutral to bullish signaling that sideways to higher prices are possible near-term. If July extends the aforementioned rally, the 50-day moving average crossing at $14.05 1/4 is the next upside target. Closes below the 10-day moving average crossing at $13.41 would temper the near-term friendly outlook. First resistance is the 50-day moving average crossing at $14.05 1/4. Second resistance is May's high crossing at $14.46 3/4. First support is the 10-day moving average crossing at $13.41. Second support is May's low crossing at $12.70 3/4.
July soybean meal was higher overnight and sets the stage for a higher opening when the day session begins trading. Stochastics and the RSI are bullish signaling that sideways to higher prices are possible near-term. Closes above the 20-day moving average crossing at $407.90 would signal that a short-term low has been posted. If July renews the decline off March's high, the 62% retracement level of the 2020-2023 rally crossing at $365.60 is the next downside target. First resistance is the 20-day moving average crossing at $407.90. Second resistance is the 50-day moving average crossing at $428.40. First support is the 50% retracement level of the 2020-2023 rally crossing at $388.80. Second support is the 62% retracement level of the 2020-2023 rally crossing at $365.60.
July soybean oil was steady to slightly higher overnight as it extends the rally off May's low. Overnight trading sets the stage for a slightly higher opening when the day session begins trading. Stochastics and the RSI are overbought but remain neutral to bullish signaling that sideways to higher prices are possible near-term. If July extends the rally off May's low, May's high crossing at 55.12 is the next upside target. Closes below the 20-day moving average crossing at 48.76 would signal that a short-term top has been posted. First resistance is May's high crossing at 55.12. Second resistance is the April 14th high crossing at 56.21. First support is the 62% retracement level of the 2020-2022 rally crossing at 46.42. Second support is the 75% retracement level of the 2020-2022 rally crossing at 40.19.
Thanks tallpine!
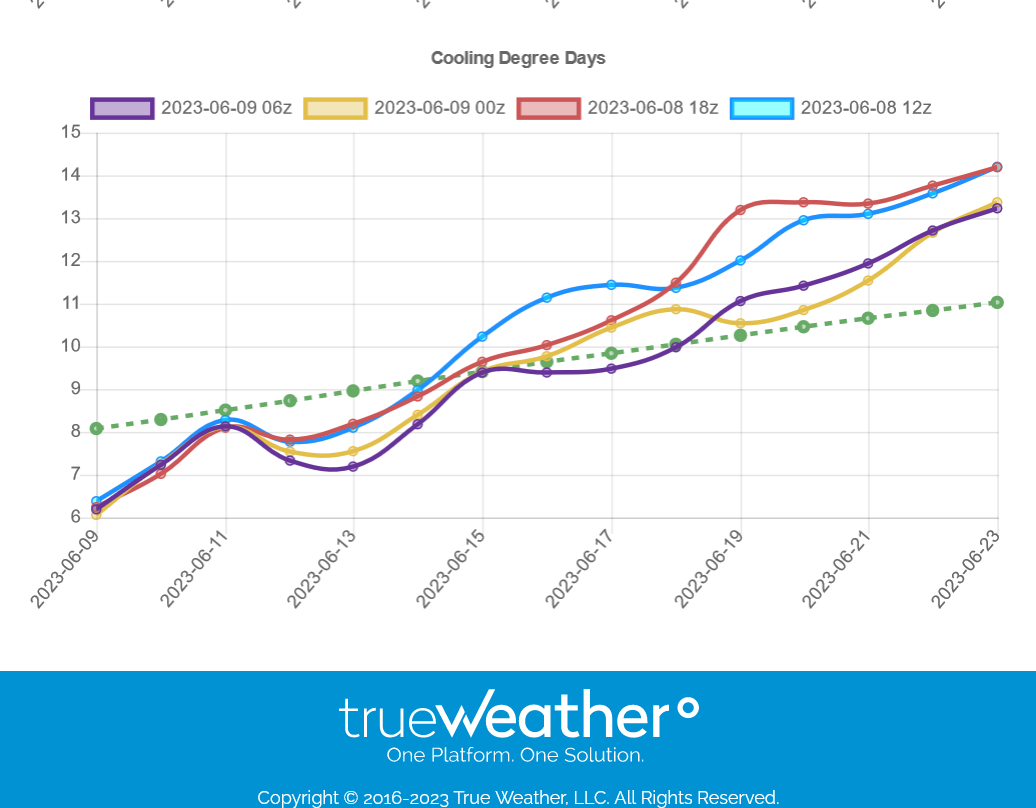
This last 0z GEFS pretty much sums up market and both model expectations for rains the next 2 weeks, including the drier EE that has added rains and is close to the GEFS which has done a better job in dialing in the upcoming El Nino influence..........if that does end up being the dominate, wetter pattern this Summer.
The Upper Midwest/Great Lakes will be driest and hurting most with increasing heat and some places getting very nice rains, especially the southern Midwest.
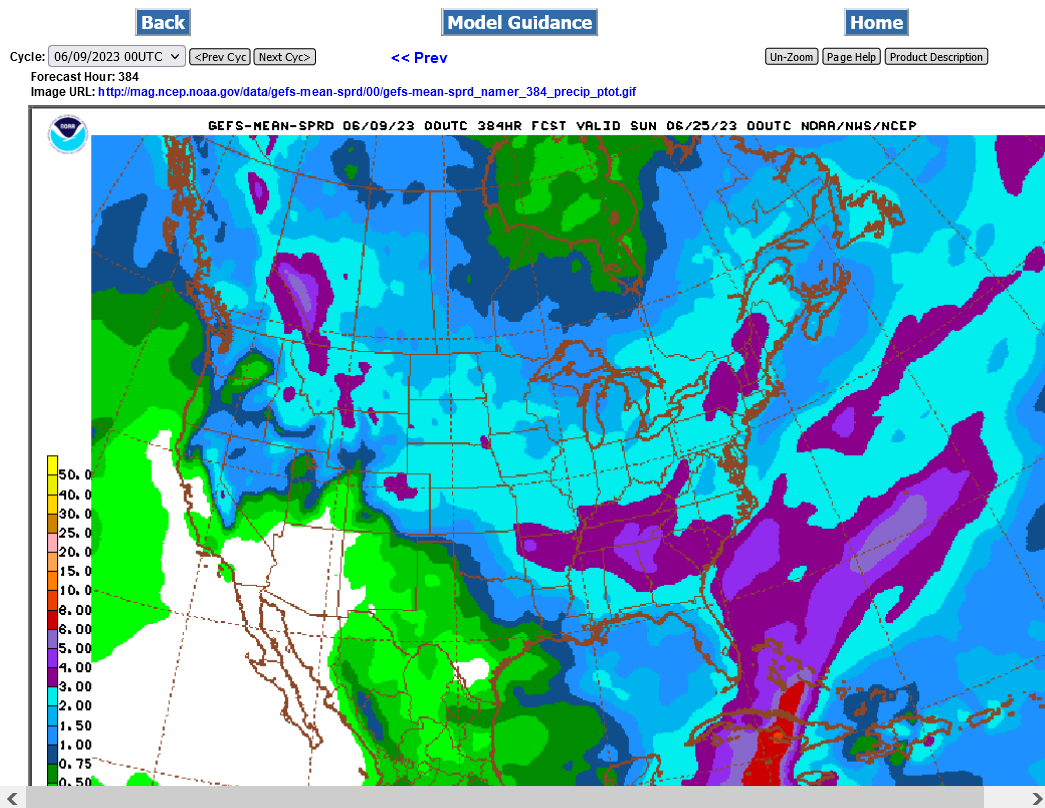
7 Day Total precipitation below:
http://www.wpc.ncep.noaa.govcdx /qpf/p168i.gif?1530796126

The last runs of the models(colors on the left-brown/purple for the GEFS) were not AS warm/took out alot of week 2 heat.