I was caught sleeping on this report (-:
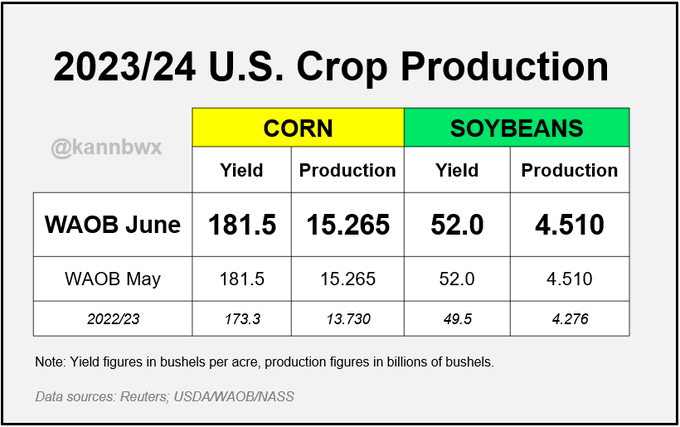
Production/yields for U.S. #corn and #soybeans are unchanged this month, which should have been expected based on USDA's yield model. However, if June stays very dry, these numbers could change next month.
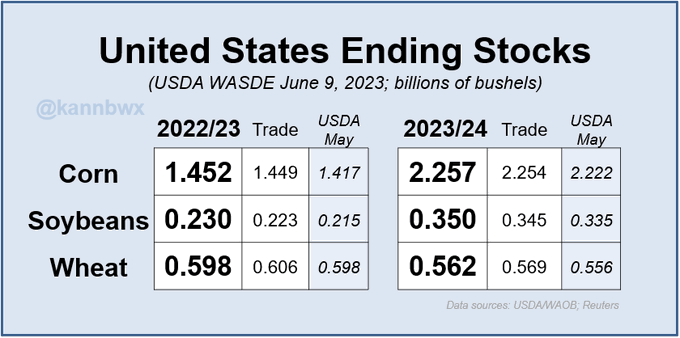
U.S. #wheat production is up slightly from last month and just a bit below the trade guesses. In big drought years, USDA normally captures crop yields earlier than in good years, so this outcome is not surprising.
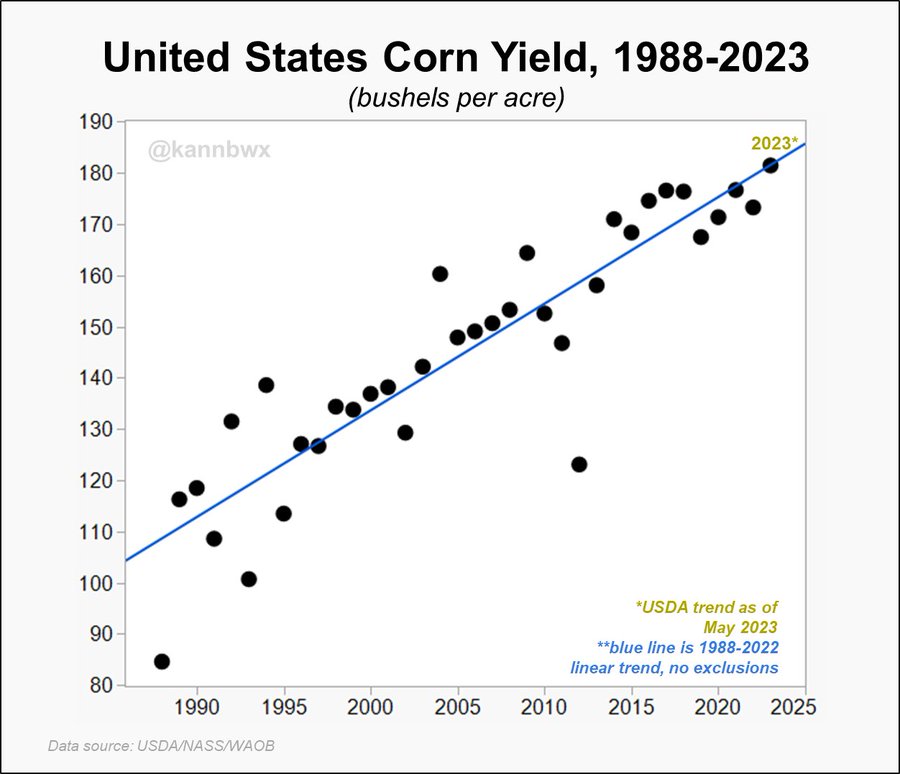
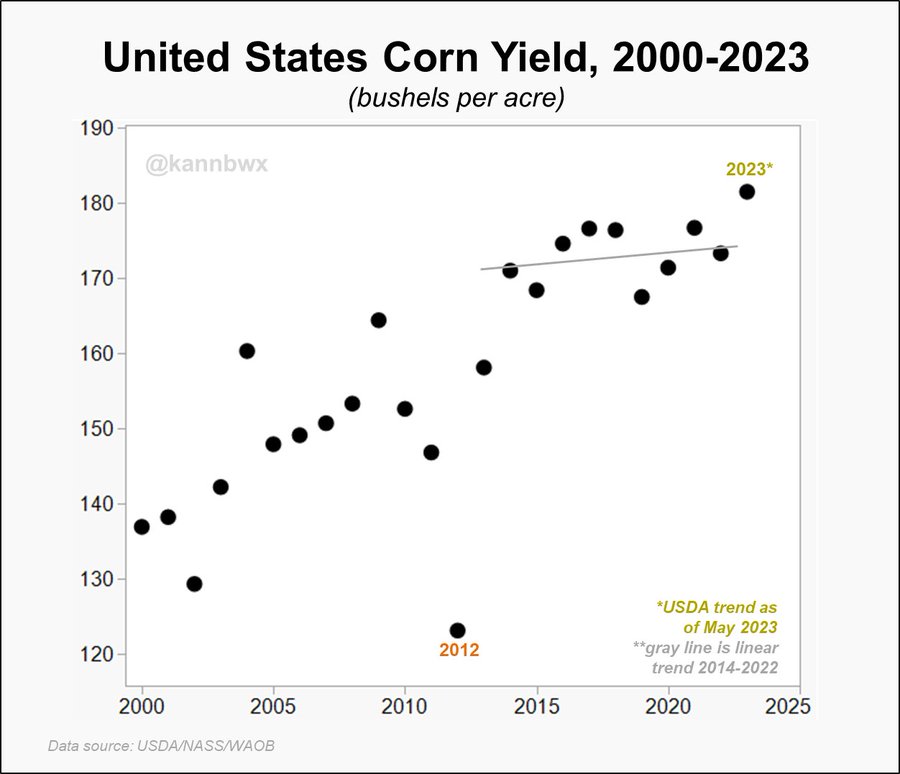
USDA's U.S. #corn yield model is based on a weather-adjusted trend over 1988-2022 and assumes normal planting pace and summer weather. If I draw a simple linear trend through 1988-2022 with no exclusions or other adjustments, I land smack dab on 181.5 bu/acre for 2023. But...
But... trend looks different over more recent years (2014-2022). Even if I exclude 2019 (acreage problems), this trend spits out 175.7 bu/acre for 2023. Seem fair? Too low? Bad weather explains 2020 & 2022 results, e.g., but how many years can a true trend let you explain away?
This isn't the first time I've brought up this discussion and these charts, and I have a feeling this topic of trend yields/starting points won't go away anytime soon. Honestly 181.5 for 2023 feels high to me. But either way, it's important to understand the numbers we're seeing.