KEY EVENTS TO WATCH FOR:
Thursday, June 15, 2023
8:30 AM ET. U.S. Weekly Export Sales
8:30 AM ET. Unemployment Insurance Weekly Claims Report - Initial Claims
Jobless Claims (expected 245K; previous 261K)
Jobless Claims, Net Chg (previous +28K)
Continuing Claims (previous 1757000)
Continuing Claims, Net Chg (previous -37K)
8:30 AM ET. May Import & Export Price Indexes
Import Prices (expected -0.5%; previous +0.4%)
Non-Petroleum Prices (previous -0.1%)
Petroleum Prices (previous +5.7%)
8:30 AM ET. June Philadelphia Fed Business Outlook Survey
Business Activity (expected -14.8; previous -10.4)
Prices Paid (previous 10.9)
Employment (previous -8.6)
New Orders (previous -8.9)
Prices Received (previous -7.0)
Delivery Times (previous -9.3)
Inventories (previous 6.4)
Shipments (previous -4.7)
8:30 AM ET. June Empire State Manufacturing Survey
Mfg Idx (expected -16.0; previous -31.8)
Employment Idx (previous -3.3)
New Orders Idx (previous -28.0)
Prices Received (previous 23.6)
8:30 AM ET. May Advance Monthly Sales for Retail & Food Services
Overall Sales-SA, M/M% (expected -0.2%; previous +0.4%)
Sales, Ex-Auto, M/M% (expected +0.0%; previous +0.4%)
Sales, Ex-Auto & Gas, M/M% (previous +0.6%)
9:15 AM ET. May Industrial Production & Capacity Utilization
Industrial Production, M/M% (expected +0.0%; previous +0.5%)
Capacity Utilization % (expected 79.6%; previous 79.7%)
Capacity Utilization, Net Chg (Pts) (previous +0.3)
10:00 AM ET. April Manufacturing & Trade: Inventories & Sales
Total Inventories (expected +0.2%; previous -0.1%)
10:30 AM ET. EIA Weekly Natural Gas Storage Report
Working Gas In Storage (Cbf) (previous 2550B)
Working Gas In Storage, Net Chg (Cbf) (previous +104B)
2:00 PM ET. SEC Closed Meeting
4:00 PM ET. April Treasury International Capital Data
4:30 PM ET. Foreign Central Bank Holdings
4:30 PM ET. Federal Discount Window Borrowings
N/A Delaware Separation Day holiday
Friday, June 16, 2023
10:00 AM ET. June University of Michigan Survey of Consumers - preliminary
Mid-Mo Sentiment (expected 60.2; previous 57.7)
Mid-Mo Expectations (previous 53.4)
Mid-Mo Current Idx (previous 64.5)
10:00 AM ET. May State Employment and Unemployment
Monday, June 19, 2023
10:00 AM ET. June NAHB Housing Market Index
Housing Mkt Idx (previous 50)
N/A U.S.: Juneteenth. Financial markets closed
The STOCK INDEXES? http://quotes.ino.com/ex?changes/?c=indexes
The STOCK INDEXES: The September NASDAQ 100 was lower overnight as it consolidates some of this year's rally. Overnight trading set the stage for a lower opening when the day session begins trading. Stochastics and the RSI are overbought but remain neutral to bullish signaling that sideways to higher prices are possible near-term. If September extends this year's rally, the 87% retracement level of the 2021-2022-decline on the weekly continuation chart crossing at 15,957.86 is the next upside target. Closes below the 20-day moving average crossing at 14,536.40 would signal that a short-term top has been posted. First resistance is Wednesday's high crossing at 15,243.50. Second resistance is the 87% retracement level of the 2021-2022-decline on the weekly continuation chart crossing at 15,957.86. First support is the 20-day moving average crossing at 14,536.40. Second support is the 50-day moving average crossing at 13,827.10.
The September S&P 500 was lower overnight as it consolidates some of the rally off March's low. Overnight trading sets the stage for a lower opening when the day session begins trading. Stochastics and the RSI are overbought but remain neutral to bullish signaling that sideways to higher prices are possible near-term. If June extends the rally off March's low, the 75% retracement level of the 2022 decline crossing at 4505.40 is the next upside target. Closes below the 20-day moving average crossing at 4297.20 would signal that a short-term top has been posted. First resistance is Wednesday's high crossing at 4439.50. Second resistance is the 75% retracement level of the 2022 decline crossing at 4505.40. First support is the 10-day moving average crossing at 4362.07. Second support is the 20-day moving average crossing at 4297.20.
INTEREST RATES http://quotes.ino.com/ex changes/?c=interest"
INTEREST RATES: September T-bonds were lower overnight. Overnight trading sets the stage for a lower opening when the day session begins trading. Stochastics and the RSI have turned neutral to bearish signaling that sideways to lower prices are possible near-term. If September renews the decline off April's high, the 87% retracement level of the March-April rally crossing at 124-19 is the next downside target. Closes above last-Wednesday's high crossing at 128-16 would signal that a short-term low has been posted. First resistance is the June 1st high crossing at 129-16. Second resistance is the 50-day moving average crossing at 129-19. First support is the 75% retracement level of the March-April rally crossing at 125-30. Second support is the 87% retracement level of the March-April rally crossing at 124-19.
September T-notes were lower overnight and sets the stage for a lower opening when the day session begins trading. Stochastics and the RSI are oversold but remain neutral to bearish signaling that sideways to lower prices are possible near-term. If September extends the decline off May's high, the 87% retracement level of the March rally crossing at 111.243 is the next downside target. Closes above the 20-day moving average crossing at 113.243 would signal that a short-term low has been posted. First resistance is the 20-day moving average crossing at 113.243. Second resistance is the June 1st high crossing at 115.000. First support is the 75% retracement level of the March-May rally crossing at 112.190. Second support is the 87% retracement level of the 2022-2023 rally crossing at 111.243.
ENERGY MARKETS? http://quotes.ino.com/ex?changes/?c=energy ""
ENERGIES:Julycrude oil was slightly higher overnight as it consolidates some of this month's loss. Overnight trading sets the stage for a slightly higher opening when the day session begins trading. Stochastics and the RSI are turning neutral to bullish signaling that sideways to higher prices are possible near-term. Closes above the 20-day moving average crossing at $70.93 would signal that a short-term low has been posted. Closes below Monday's low crossing at $66.80 would open the door for a possible test of May's low crossing at $63.90. First resistance is the 20-day moving average crossing at $70.93. Second resistance is the 50-day moving average crossing at $73.85. First support is Monday's low crossing at $66.80. Second support is the May low crossing at $63.90.
July heating oil was slightly higher overnight and set sets the stage for a slightly higher opening when the day session begins trading. Stochastics and the RSI are neutral to bullish signaling that sideways to higher prices are possible near-term. Closes above the 50-day moving average crossing at 2.4109 would open the door for additional gains and a possible test of the April 25th high crossing at 2.5325. Closes below the May 31st low crossing at 2.2268 would open the door for a possible test of May's low crossing at 2.1550. First resistance is the 50-day moving average crossing at 2.4109. Second resistance is the April 25th high crossing at 2.5332. First support is the May 31st low crossing at 2.2268. Second support is May's low crossing at 2.1550.
July unleaded gas was higher overnight as it consolidates some of Monday's loss and sets the stage for a higher opening when the day session begins trading. Stochastics and the RSI are turning neutral to bullish signaling that sideways to higher prices are possible near-term. If July renews the rally off May's low, the 87% retracement level of the April-May decline crossing at $2.6958 is the next upside target. If July extends the decline off last-Thursday's high, the June 1st low crossing at 2.4016 is the next downside target. First resistance is the 87% retracement level of the April-May decline crossing at $2.6958. Second resistance is April's high crossing at $2.7675. First support is Monday's low crossing at $2.4756. Second support is the June 1st low crossing at 2.4016.
July natural gas was slightly higher overnight and sets the stage for a slightly higher opening when the day session begins trading. Stochastics and the RSI are neutral to bullish signaling that sideways to higher prices are possible near-term. Closes above the 50-day moving average crossing at 2.458 would signal that a short-term low has been posted. If July renews the decline off March's high, the September-2020 low on the monthly continuation chart crossing at 1.795 is the next downside target. First resistance is the 50-day moving average crossing at 2.458. Second resistance is the May 19th high crossing at 2.816. First support is the June 1st low crossing at 2.136. Second support is the September-2020 low on the monthly continuation chart crossing at 1.795.
CURRENCIEShttp://quotes.ino.com/ex changes/?c=currencies"
CURRENCIES:The September Dollar was higher overnight and sets the stage for a higher opening when the day session begins trading later this morning. Stochastics and the RSI are neutral to bearish signaling that sideways to lower prices are possible near-term. If September extends the decline off May's high, the 50-day moving average crossing at $102.100 is the next downside target. If September renews the rally off May's low, the 38% retracement level of the 2022-2023 decline crossing at $104.932 is the next upside target. First resistance is the March 15th high crossing at $104.250. Second resistance is the 38% retracement level of the 2022-2023 decline crossing at $104.932.First support is Wednesday's low crossing at $102.235. Second support is the 50-day moving average crossing at $102.100.
The September Euro was steady to slightly lower overnight as it consolidates some of the rally off May's low. Overnight trading sets the stage for a slightly lower opening when the day session begins trading. Stochastics and the RSI are overbought but remain neutral to bullish signaling that sideways to higher prices are possible near-term. If September extends the rally off May's low, the 50-day moving average crossing at $1.09547 is the next upside target. If September renews the decline off April's high, the 38% retracement level of the 2022-2023 rally crossing at 1.06472 is the next downside target. First resistance is Wednesday's high crossing at $1.09195. Second resistance is the 50-day moving average crossing at $1.09547. First support is the 38% retracement level of the 2022-2023 rally crossing at 1.06472. Second support is the 50% retracement level of the 2022-2023 rally crossing at 1.04833.
The September British Pound was slightly lower overnight and sets the stage for a slightly lower opening when the day session begins trading. Stochastics and the RSI are overbought but remain neutral to bullish signaling that sideways to higher prices near-term. If September extends the rally off May's low, the 62% retracement level of the 2022-2023 decline crossing at 1.2729 is the next upside target. Closes below the 20-day moving average crossing at 1.2491 would signal that a short-term top has been posted. First resistance is Wednesday's high crossing at 1.2716. Second resistance is the 62% retracement level of the 2022-2023 decline crossing at 1.2729. First support is the 20-day moving average crossing at 1.2491. Second support is May's low crossing at 1.2333.
The September Swiss Franc was lower overnight and sets the stage for a lower opening when the day session begins trading. Stochastics and the RSI are neutral to bullish signaling that sideways to higher prices are possible near-term. If September extends the rally off May's low, the 50-day moving average crossing at 1.12843 is the next upside target. If September resumes the decline off May's high, the 38% retracement level of the 2022-2023 rally crossing at 1.10197 is the next downside target. First resistance is the 50-day moving average crossing at 1.12843. Second resistance is May's high crossing at 1.14920. First support is May's low crossing at 1.10700. Second support is the 38% retracement level of the 2022-2023 rally crossing at 1.10197.
The September Canadian Dollar was lower overnight and sets the stage for a lower opening when the day session begins trading. Stochastics and the RSI are overbought but remain neutral to bullish signaling that sideways to higher prices are possible near-term. If September extends the rally off the May 26th low, the November 11th -2022 high crossing at $75.91 is the next upside target. Closes below the 50-day moving average crossing at $74.40 would signal that a short-term top has been posted. First resistance is Wednesday's high crossing at $75.46. Second resistance is the November 11th -2022 high crossing at $75.91. First support is the 50-day moving average crossing at $74.40. Second support is April's low crossing at $73.39.
The September Japanese Yen was sharply lower overnight marking a downside breakout of the trading range of the past four-weeks. Overnight trading sets the stage for a sharply lower opening when the day session begins trading. Stochastics and the RSI are neutral to bearish signaling that sideways to lower prices are possible near-term. If September extends the decline off the March's high, the 87% retracement level of the 2022-2023 rally crossing at 0.070777 is the next downside target. Closes above the June 1st high crossing at 0.073430 would signal that a short-term low has been posted. First resistance is the June 1st high crossing at 0.073430. Second resistance is the 50-day moving average crossing at 0.074710. First support is the 75% retracement level of the 2022-2023 rally crossing at 0.072174. Second support is the 87% retracement level of the 2022-2023 rally crossing at 0.070777.
PRECIOUS METALS http://quotes.ino.com/ex changes/?c=metals"
Precious Metals: Augustgold was lower overnight and tests support marked by the 38% retracement level of the September-May rally crossing at $1941.90. Overnight trading sets the stage for a sharply lower opening when the day session begins trading later this morning. Stochastics and the RSI are neutral to bearish signaling that sideways to lower prices are possible near-term. If August extends the decline off May's high, the 50% retracement level of the September-May rally crossing at $1892.30 is the next downside target. Closes above the 50-day moving average crossing at $2011.80 would signal that a short-term low has been posted. First resistance is the 50-day moving average crossing at $2011.80. Second resistance is the May 4th high crossing at $2102.20. First support is the 38% retracement level of the September-May rally crossing at $1941.90. Second support is the 50% retracement level of the September-May rally crossing at $1892.30.
July silver was lower overnight and sets the stage for a lower opening when the day session begins trading later this morning. Stochastics and the RSI are turning neutral to bearish signaling that sideways to lower prices are possible near-term. Closes below last-Monday's low crossing at $23.320 would signal that a short-term top has been posted. If July renews the rally off May's low, the 50-day moving average crossing at $24.660 is the next upside target. First resistance is last-Friday's high crossing at $24.620. Second resistance is the 50-day moving average crossing at $24.660. First support is the 50% retracement level of the March-April rally crossing at 23.295. Second support is May's low crossing at $22.785.
July copper was slightly lower overnight and sets the stage for a slightly lower opening when the day session begins trading. Stochastics and the RSI are overbought but remain neutral to bullish signaling that sideways to higher prices are possible near-term. If July extends the rally off May's low, the May 8th high crossing at 3.9595 is the next upside target. Closes below the 20-day moving average crossing at 3.7258 would temper the near-term friendly outlook. First resistance is the May 8th high crossing at 3.9595. Second resistance is the May 1st high crossing at 4.0050. First support is the 20-day moving average crossing at 3.7258. Second support is May's low crossing at 3.5450.
GRAINS http://quotes.ino.com/ex changes/?c=grains
Grains: September corn was higher overnight as it extends the rally off May's low. Overnight trading sets the stage for a higher opening when the day sessions begins trading. Stochastics and the RSI are overbought but remain neutral to bullish signaling that sideways to higher prices are possible near-term. If September extends the rally off May's low, the 38% retracement level of the 2022-2023 decline crossing at $5.68 1/4 is the next upside target. Closes below last-Thursday's low crossing at $5.14 1/2 would signal that a short-term top has been posted.First resistance is the 38% retracement level of the 2022-2023 decline crossing at $5.68 1/4. Second resistance is the April 18th high crossing at $5.79. First support is last-Thursday's low crossing at $5.14 1/2. Second support is the May 31st low crossing at $5.05 3/4.
September wheat was higher overnight and sets the stage for a higher opening when the day session begins trading. Stochastics and the RSI are neutral to bullish signaling that sideways to higher prices are possible near-term. If September extends the rally off May's low, May's high crossing at $6.80 is the next upside target. Closes below the 20-day moving average crossing at $6.29 3/4 would signal that a short-term top has been posted. First resistance is the 50-day moving average crossing at $6.54 3/4. Second resistance is May's high crossing at $6.80. First support is last-Thursday's low crossing at $6.23 1/4. Second support is May's low crossing at $5.87 3/4.
September Kansas City wheat was higher overnight and sets the stage for a higher opening when the day session begins trading later this morning. Stochastics and the RSI are turning neutral to bearish signaling that sideways to lower prices are possible near-term. If September renews the decline off June's high, the May 31st low crossing at $7.61 3/4 is the next downside target. Closes above the 50-day moving average crossing at $8.17 1/2 would signal that a short-term low has been posted. First resistance is the 50-day moving average crossing at $8.17 1/2. Second resistance is June's high crossing at $8.41. First support is the May 31st low crossing at $7.61 3/4. Second support is May's low crossing at $7.33.
September Minneapolis wheat was higher overnight and sets the stage for a higher opening when the day session begins trading. Stochastics and the RSI are turning neutral signaling that sideways trading is possible near-term. Closes below the May 7th low crossing at $7.92 3/4 would renew the decline off decline off June's high. Closes above the 50-day moving average crossing at $8.31 would open the door for additional gains and a possible test of May's high crossing at $8.89 1/2. First resistance is the 50-day moving average crossing at $8.31. Second resistance is June's high crossing at $8.39 3/4. First support is the May 31st low crossing at $7.78 1/4. Second support is May's low crossing at $7.71 3/4.
SOYBEAN COMPLEX? http://quotes.ino.com/ex?changes/?c=grains "
July soybeans were sharply higher overnight as it extends the rally off May's low. Overnight trading sets the stage for a higher opening when the day session begins trading later this morning. Stochastics and the RSI are overbought but remain neutral to bullish signaling that sideways to higher prices are possible near-term. If July extends the aforementioned rally, May's high crossing at $14.46 3/4 is the next upside target. Closes below the 20-day moving average crossing at $13.47 1/4 would temper the near-term friendly outlook. First resistance is the 50-day moving average crossing at $13.99. Second resistance is May's high crossing at $14.46 3/4. First support is the 20-day moving average crossing at $13.47 1/4. Second support is May's low crossing at $12.70 3/4.
July soybean meal was higher overnight and sets the stage for a higher opening when the day session begins trading. Stochastics and the RSI are neutral to bearish signaling that sideways to lower prices are possible near-term. If July renews the decline off March's high, the 62% retracement level of the 2020-2023 rally crossing at $365.60 is the next downside target. Closes above last-Thursday's high crossing at $408.40 would signal that a short-term low has been posted while opening the door for additional gains near-term. First resistance is last-Thursday's high crossing at $408.40. Second resistance is the 50-day moving average crossing at $423.20. First support is the 50% retracement level of the 2020-2023 rally crossing at $388.80. Second support is the 62% retracement level of the 2020-2023 rally crossing at $365.60.
July soybean oil was higher overnight as it extends the rally off May's low. Overnight trading sets the stage for a higher opening when the day session begins trading. Stochastics and the RSI are overbought but remain neutral to bullish signaling that sideways to higher prices are possible near-term. If July extends the rally off May's low, the April 18th high crossing at 56.21 is the next upside target. Closes below the 20-day moving average crossing at 50.29 would signal that a short-term top has been posted. First resistance is April's high crossing at 57.51. Second resistance is the March 20th high crossing at 58.40. First support is the 50-day moving average crossing at 51.74. Second support is the 20-day moving average crossing at 50.29.
Thanks much, tallpine!
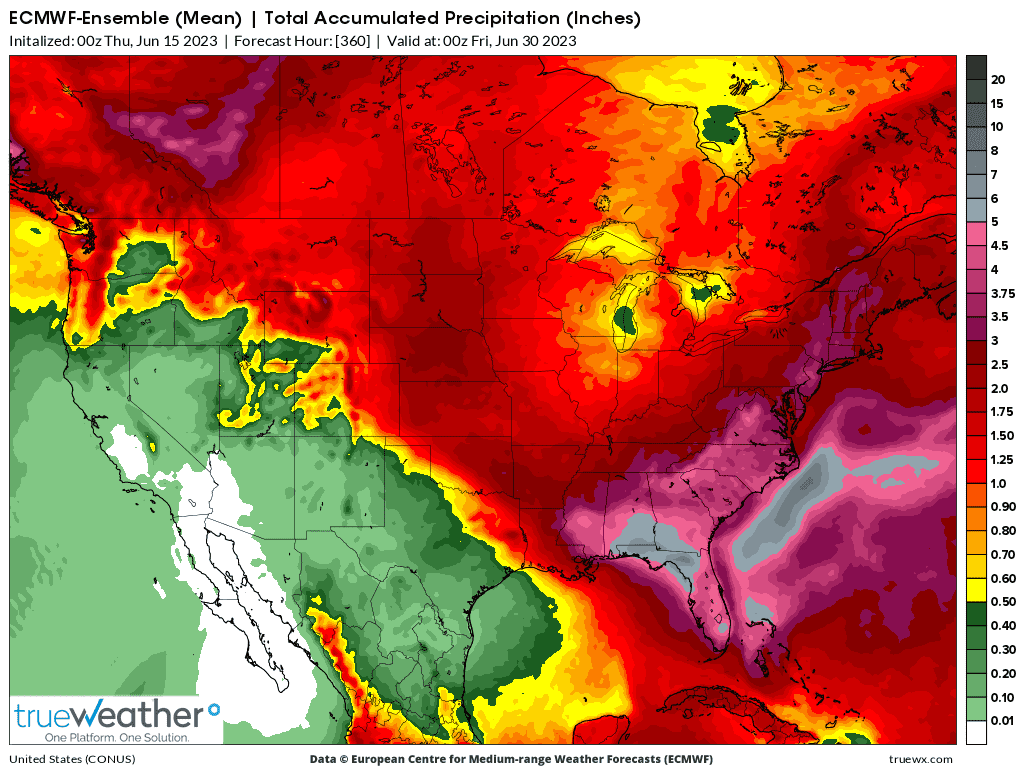
As mentioned yesterday afternoon, the EE took rain out of the forecast and that continued overnight.