KEY EVENTS TO WATCH FOR:
Friday, June 23, 2023
8:30 AM ET. U.S. Weekly Export Sales
9:45 AM ET. June US Flash Manufacturing PMI
PMI, Mfg (expected 49.0; previous 48.5)
9:45 AM ET. June US Flash Services PMI
PMI, Services (expected 53.8; previous 55.1)
The STOCK INDEXES? http://quotes.ino.com/ex?changes/?c=indexes
The Dow closed slightly lower on Thursday as it extends the decline off last-Friday's high. The high-range close sets the stage for a steady to higher opening when Friday's day session begins trading. Stochastics and the RSI have turned neutral to bearish signaling that sideways to lower prices are possible near-term. Closes below the 50-day moving average crossing at 33,617.65 would signal that a short-term top has been posted. If the Dow renews the rally off May's low, the December-2022 high crossing at 34,712.28 is the next upside target. First resistance is last-Friday's high crossing at 34,588.68. Second resistance is the December-2022 high crossing at 34,712.28. First support is the 50-day moving average crossing at 33,617.65. Second support is the June 6th low crossing at 33,399.69.
The September NASDAQ 100 closed higher on Thursday. The high-range close sets the stage for a steady to higher opening when Friday's night session begins trading. Stochastics and the RSI are turning neutral to bearish signaling sideways to lower prices are possible. Closes below the 20-day moving average crossing at 14,785.81 would signal that a short-term top has been posted. If September resumes this year's rally, the 87% retracement level of the 2021-2022-decline on the weekly continuation chart crossing at 15,957.86 is the next upside target. First resistance is last-Friday's high crossing at 15,475.50. Second resistance is the 87% retracement level of the 2020-2022-decline on the weekly continuation chart crossing at 15,957.86. First support is the 20-day moving average crossing at 14,785.81. Second support is June's low crossing at 14,420.00.
The September S&P 500 closed higher on Thursday. The high-range close sets the stage for a steady to higher opening when Friday's night session begins trading. Stochastics and the RSI are turning neutral to bearish signaling that sideways to lower prices are possible near-term. Closes below the 20-day moving average crossing at 4339.41 would signal that a short-term top has been posted. If September extends the rally off March's low, the 75% retracement level of the 2022 decline on the weekly chart crossing at 4505.40 is the next upside target. First resistance is last-Friday's high crossing at 4493.75. Second resistance is the 75% retracement level of the 2022 decline on the weekly chart crossing at 4505.40. First support is the 20-day moving average crossing at 4339.41. Second support is the June 8th low crossing at 4305.75.
INTEREST RATES? http://quotes.ino.com/ex?changes/?c=interest ""
September T-bonds closed down 1-03/32's at 127-02.
September T-bonds closed lower on Thursday as it extends June's trading range. The low-range close sets the stage for a steady to lower opening when Friday's day session begins trading. Stochastics and the RSI are turning neutral to bearish signaling that sideways to lower prices are possible near-term. If September renews the decline off April's high, the 87% retracement level of the March-April rally crossing at 124-19 is the next downside target. Closes above the 50-day moving average crossing at 129-06 would confirm that a short-term low has been posted while opening the door for additional gains near-term. First resistance is the 50-day moving average crossing at 129-06. Second resistance is the May 11th high crossing at 132-13. First support is the 75% retracement level of the March-April rally crossing at 125-30. Second support is the 87% retracement level of the March- April rally crossing at 124-19.
September T-notes closed down 170-pts. at 112.250.
September T-notes closed lower on Thursday. The low-range close sets the stage for a steady to lower opening when Friday's day session begins trading. Stochastics and the RSI are turning neutral to bearish signaling that sideways to lower prices are possible near-term. If September extends the decline off May's high, the 87% retracement level of March's rally crossing at 111.243 is the next downside target. Closes above last-Tuesday's high crossing at 114.000 would signal that a short-term low has been posted. First resistance is last-Tuesday's high crossing at 114.000. Second resistance is June's high crossing at 115.000. First support is the 75% retracement level of March's rally crossing at 112.190. Second support is the 87% retracement level of March's rally crossing at 111.243.
ENERGY MARKETS? http://quotes.ino.com/ex?changes/?c=energy ""
August crude oil closed sharply lower on Thursday as it consolidated some of the rally off June's low. The low-range close sets the stage for a steady to lower opening when Friday's day session begins. Stochastics and the RSI are turning neutral to bearish signaling that sideways to lower prices are possible near-term. Closes below last-Monday's low crossing at $66.96 would open the door for a possible test of May's low crossing at $63.90. Closes above the 50-day moving average crossing at $73.01 would signal that a short-term low has been posted while opening the door for additional short-term gains. First resistance is the 50-day moving average crossing at $73.01. Second resistance is June's high crossing at $75.70. First support is last-Monday's low crossing at $66.96. Second support is May's low crossing at $64.41.
August heating oil closed lower on Thursday. The low-range close sets the stage for a steady to lower opening when Friday's day trading session begins. Stochastics and the RSI are overbought but remain neutral to bullish signaling that sideways to higher prices are possible near-term. If August extends the rally off May's low, the 38% retracement level of the 2022-2023 decline crossing at 2.6107 is the next upside target. Closes below last-Monday's low crossing at 2.2876 would signal that a short-term top has been posted. First resistance is the April 24th high crossing at 2.5349. Second resistance is the 38% retracement level of the 2022-2023 decline crossing at 2.6107. First support is last-Monday's low crossing at $2.2876. Second support is the May 31st low crossing at $2.2301.
August unleaded gas closed lower on Thursday. The low-range close sets the stage for a steady to lower opening when Friday's day session begins trading. Stochastics and the RSI are turning neutral to bearish signaling that sideways to lower prices are possible near-term. Closes below last-Thursday's low crossing at 2.4415 would signal that a short-term top has been posted. If August renews the rally off May's low, the 87% retracement level of the April-May decline crossing at 2.5766 is the next upside target. First resistance last-Friday's high crossing at 2.5905. Second resistance is the 87% retracement level of the April-May decline crossing at 2.6394. First support is last-Monday's low crossing at 2.3901. Second support is June's low crossing at 2.3394.
August Henry natural gas closed higher on Thursday. The high-range close sets the stage for a steady to higher opening when Friday's day session begins trading. Stochastics and the RSI are overbought and are turning neutral signaling that sideways to higher prices are possible near-term. If August extends this month's rally, the May 19th high crossing at 2.885 is the next upside target. If August renews the decline off March's high, the September-2020 low on the monthly continuation chart crossing at 1.795 is the next downside target.First resistance is Tuesday's high crossing at 2.783. Second resistance is the May 19th high crossing at 2.885. First support is the June 1st low crossing at 2.244. Second support is the September-2020 low on the monthly continuation chart crossing at 1.795.
CURRENCIES? http://quotes.ino.com/ex?changes/?c=currencies ""
The September Dollar closed higher on Thursday. The high-range close sets the stage for a steady to higher opening when Friday's session begins trading. Stochastics and the RSI are oversold but remain neutral to bearish signaling that sideways to lower prices are possible near-term. If September extends the decline off May's high, May's low crossing at 100.340 is the next downside target. Closes above the 20-day moving average crossing at 102.920 would signal that a short-term low has been posted. First resistance is the 20-day moving average crossing at 102.920. Second resistance is May's high crossing at 104.205. First support is today's low crossing at 101.485. Second support is May's low crossing at 100.340.
The September Euro closed lower on Thursday as it consolidated some of the rally off May's low. The low-range close sets the stage for a steady to lower opening when Friday's day session begins trading. Stochastics and the RSI are overbought but remain neutral to bullish signaling that sideways to higher prices is possible near-term. If September extends the rally off May's low, May's high crossing at 1.11710. Closes below the 20-day moving average crossing at $1.08520 would signal that a short-term top has been posted. First resistance is today's high crossing at $1.10615. Second resistance is May's high crossing at 1.11710. First support is the 50-day moving average crossing at 1.09575. Second support is the 10-day moving average crossing at $1.09207.
The September British Pound closed slightly lower on Thursday. The low-range close sets the stage for a steady to lower opening when Friday's day session begins trading. Stochastics and the RSI are overbought and are turning neutral to bearish signaling sideways to lower prices are possible near-term. Closes below the 50-day moving average crossing at 1.2537 is the next downside target. If September extends the rally off May's low, the 75% retracement level of the 2022-2023 decline crossing at 1.3253 is the next upside target. First resistance is today's high crossing at 1.2874. Second resistance is the 75% retracement level of the 2022-2023 decline crossing at 1.3253. First support is the 50-day moving average crossing at 1.2537. Second support is May's low crossing at 1.2333.
The September Swiss Franc closed lower on Thursday. The low-range close sets the stage for a steady to lower opening when Friday's day session begins trading. Stochastics and the RSI are turning neutral to bearish signaling that sideways to lower prices are possible near-term. If September extends the rally off May's low, May's high crossing at 1.14920 is the next upside target. If September resumes the decline off May's high, the 38% retracement level of 2022-2023 rally crossing at 1.10197 is the next downside target. First resistance is last-Friday's high crossing at 1.13410. Second resistance is May's high crossing at 1.14920. First support is the 20-day moving average crossing at 1.11960. Second support is May's low crossing at 1.10700. Third support is the 38% retracement level of 2022-2023 rally crossing at 1.010197.
The September Canadian Dollar closed higher on Thursday as it extends the rally off May's low. The high-range close sets the stage for a steady to higher opening when Friday's day session begins trading. Stochastics and the RSI are overbought but remain neutral to bullish signaling that sideways to higher prices are possible near-term. If September extends the rally off May's low, the 38% retracement level of the 2021-2022 decline crossing at 76.28 is the next upside target. Closes below the 20-day moving average crossing at 74.75 would signal that a short-term top has been posted. First resistance is today's high crossing at 76.22. Second resistance is the 38% retracement level of the 2021-2022 decline crossing at 76.28. First support is the 10-day moving average crossing at 75.51. Second support is the 20-day moving average crossing at 74.85.
The September Japanese Yen closed lower on Thursday as it extends this year's decline. The low-range close sets the stage for a steady to lower opening when Friday’s day session begins trading. Stochastics and the RSI are oversold but remain neutral to bearish signaling that sideways to lower prices are possible near-term. If September extends the decline off March's high, the October-2022 low crossing at 0.069270 is the next downside target. Closes above the 20-day moving average crossing at 0.073483 would signal that a short-term low has been posted. First resistance is the 20-day moving average crossing at 0.073483. Second resistance is the June 1st high crossing at 0.073430. First support is the 87% retracement level of the October-January rally crossing at 0.070777. Second support is the October-2022 low crossing at 0.069270.
PRECIOUS METALS? http://quotes.ino.com/ex?changes/?c=metals ""
August gold closed lower on Thursday as it extends the decline off May's high. The low-range close sets the stage for a steady to lower opening when Friday's day session begins trading. Stochastics and the RSI are neutral to bearish signaling that sideways to lower prices are possible near-term. If August extends the decline off May's high, the 50% retracement level of the 2022-2023 rally crossing at $1892.30. Closes above the 20-day moving average crossing at $1967.90 would signal that a short-term low has been posted. First resistance is the 20-day moving average crossing at $1967.90. Second resistance is the 50-day moving average crossing at $2004.90. First support is today's low crossing at $1922.60. Second support is the 50% retracement level of the 2022-2023 rally crossing at $1892.30.
July silver closed lower for the third day in a row on Thursday. The low-range close sets the stage for a steady to lower opening when Friday's day session begins trading. Stochastics and the RSI are oversold but remain neutral to bearish signaling that sideways to lower prices are possible near-term. If July renews the decline off May's high, the 75% retracement level of the March-May rally crossing at 21.708 is the next downside target. Closes above the 50-day moving average crossing at 24.500 would confirm that a low has been posted. First resistance is the 50-day moving average crossing at 24.500. Second resistance is the May 10th high crossing at 26,200. First support is the 62% retracement level of the March-May rally crossing at 22.546. Second support is the 75% retracement level of the March-May rally crossing at 21.708.
July copper closed lower on Thursday. The low-range close sets the stage for a steady to lower opening when Friday's day session begins trading. Stochastics and the RSI are overbought but remain neutral to bullish signaling that sideways to higher prices are possible near-term. If July extends the rally off May's low, May's high crossing at 4.0050 is the next upside target. Closes below the 20-day moving average crossing at 3.7688 would signal that a short-term top has been posted. First resistance is today's high crossing at 3.9670. Second resistance is May's high crossing at 4.0050. First support is the 20-day moving average crossing at 3.7688. Second support is May's low crossing at 3.5450.
GRAINS? http://quotes.ino.com/ex?changes/?c=grains "
September Corn closed down $0.06 1/2-cents at $6.17.
September corn posted an inside day with a lower close on Thursday as it consolidates some of the rally off May's low. The mid-range close sets the stage for a steady to lower opening when Friday's night session begins trading. Stochastics and the RSI are overbought but remain neutral to bullish signaling that sideways to higher prices are possible near-term. If September extends the rally off May's low, the 75% retracement level of the 2022-2023-decline crossing at $6.47 1/2 is the next upside target. Closes below the 20-day moving average crossing at $5.46 1/4 would signal that a short-term top has been posted. First resistance is the December 26th high crossing at $6.31 1/4. Second resistance is the 75% retracement level of the 2022-2023 decline crossing at $6.47 1/2. First support is the 10-day moving average crossing at $5.68 1/4. Second support is the 20-day moving average crossing at $5.46 1/4.
September wheat closed up $0.04 1/2-cents at $7.52 3/4.
September wheat closed higher for the fifth-day in a row on Thursday as it extends the rally off May's low. The high-range close sets the stage for a steady to higher opening when Friday's day session begins trading. Stochastics and the RSI are overbought but remain neutral to bullish signaling signaling that sideways to higher prices are possible near-term. If September extends the rally off May's low, the 38% retracement level of the 2022-2023 crossing at $7.95 1/4 is the next upside target. Closes below the 20-day moving average crossing at $6.52 would signal that a short-term top has been posted. First resistance is today's high crossing at $7.60 3/4. Second resistance is the 38% retracement level of the 2022-2023 crossing at $7.95 1/4. First support is the 10-day moving average crossing at $6.80. Second support is the 20-day moving average crossing at $6.52.
September Kansas City Wheat closed up a $0.00 1/2-cent at $8.72 1/2.
September Kansas City wheat closed fractionally higher on Thursday as it extends the rally off the May 31st low. The mid-range close sets the stage for a steady to fractionally higher opening when Friday's day session begins trading. Stochastics and the RSI are overbought but remain neutral to bullish signaling that sideways to higher prices are possible near-term. If September extends the aforementioned rally, May's high crossing at $9.02 is the next upside target. Closes below the 20-day moving average crossing at $8.10 1/2 would signal that a short-term top has been posted.First resistance is today's high crossing at $8.89 1/2. Second resistance is May's high crossing at $9.02. First support is the 50-day moving average crossing at $8.18 1/2. Second support is the 20-day moving average crossing at $8.10 1/2.
September Minneapolis wheat closed up $0.02 3/4-cents crossing at $8.84 1/2.
September Minneapolis wheat closed higher on Thursday. The mid-range close sets the stage for a steady to higher opening when Friday's day session begins trading. Stochastics and the RSI are overbought but remain neutral to bullish signaling that sideways to higher prices are possible near-term. If September extends last-week's rally, April's high crossing at $9.10 1/2 is the next upside target. Closes below the 20-day moving average crossing at $8.20 1/2 would signal that a short-term top has been posted. First resistance is today's high crossing at $8.94 1/2. Second resistance is April's high crossing at $9.10 1/2. First support is the 50-day moving average crossing at $8.31 1/4. Second support is the 20-day moving average crossing at $8.20 1/2.
SOYBEAN COMPLEX? http://quotes.ino.com/ex?changes/?c=grains "
November soybeans closed down $0.37 1/4-cents at $13.39 1/2.
November soybeans close sharply lower on Thursday as it consolidated some of the rally off May's low. The low-range close sets the stage for a steady to lower opening when Friday's day session begins trading. Stochastics and the RSI are overbought but remain neutral to bullish signaling that sideways to higher prices are possible near-term. If November extends the rally off May's low, February's high crossing at $14.02 is the next upside target. Closes below the 10-day moving average crossing at $12.77 1/2 would signal that a short-term top has been posted. First resistance is Wednesday's high crossing at $13.78. Second resistance is February's high crossing at $14.02. First support is the 10-day moving average crossing at $12.77 1/2. Second support is the 50-day moving average crossing at $12.45 1/2.
August soybean meal closed down $15.50 at $421.80.
August soybean meal posted an inside day with a sharply lower close on Thursday as it consolidated some of the rally off May's low. The low-range close sets the stage for a steady to lower opening when Friday's day session begins trading. Stochastics and the RSI are overbought but remain neutral to bearish signaling that sideways to lower prices are possible near-term. Closes below the 50-day moving average crossing at $414.30 would signal that a short-term top has been posted. If August extends this month's rally, April's high crossing at $456.00 is the next upside target. First resistance is Wednesday's high crossing at $438.90. Second resistance is April's high crossing at $456.00. First support is the 50-day moving average crossing at $414.30. Second support is the 20-day moving average crossing at $397.80.
August soybean oil closed up 10-pts. at 54.83.
August soybean oil closed slightly higher on Thursday as it consolidates some of Wednesday's decline.The high-range close sets the stage for a steady to higher opening when Friday's day session begins trading. Stochastics and the RSI are turning neutral to bearish signaling that sideways to lower prices are possible near-term. Closes below the 50-day moving average crossing at 51.68 would signal that a short-term top has been posted. If August resumes the rally off May's low, March's high crossing at 61.83 is the next upside target. First resistance is last-Friday's high crossing at 60.24. Second resistance is March's high crossing at 61.83. First support is the 50-day moving average crossing at 51.68. Second support is May's low crossing at 44.68.
LIVESTOCKhttp://quotes.ino.com/exchanges/?c=livestock
August hogs closed down $2.80 at $89.98.
August hogs closed sharply lower on Thursday as it consolidates some of the rally off May's low. The low-range close sets the stage for a steady to lower opening when Friday's day session begins trading. Stochastics and the RSI are overbought but remain neutral to bullish signaling that sideways to higher prices are possible near-term. If August extends the rally off May's low, the 62% retracement level of the 2022-2023 decline crossing at $95.45 is the next upside target. Closes below the 20-day moving average crossing at $84.58 would signal that a short-term top has been posted. First resistance is the 62% retracement level of the 2022-2023 decline crossing at $95.45. Second resistance is the 75% retracement level of the 2022-2023 decline crossing at $100.14. First support is the 10-day moving average crossing at $88.79. Second support is the 20-day moving average crossing at $84.58.
August cattle closed up $1.40 at $171.15.
August cattle closed higher on Thursday. The high-range close sets the stage for a steady to slightly lower opening on Friday. Stochastics and the RSI are neutral to bearish signaling that sideways to lower prices are possible near-term. If August extends the decline off June's high, the 50-day moving average crossing at $165.75 is the next downside target. If August renews this year's rally unto uncharted territory, upside targets will be hard to project. First resistance is the June 14th high crossing at $174.40. Second resistance is June's high crossing at $178.10. First support is Wednesday's low crossing at $168.10. Second support is the 50-day moving average crossing at $165.75.
August Feeder cattle closed up $2.95 at $230.68.
August Feeder cattle closed higher on Thursday as it consolidates some of Wednesday's rally but remains below yesterday's gap crossing at $231.88. The high-range close sets the stage for a steady to higher opening when Friday's day session begins trading. Stochastics and the RSI are oversold but remain neutral to bearish signaling that sideways to lower prices are possible near-term. If August extends the decline off June's high, May's low crossing at $221.15 is the next downside target. Closes above the 20-day moving average crossing at $237.06 would signal that a short-term low has been posted. First resistance is Wednesday's gap crossing at $231.88. Second resistance is the June 14th high crossing at $241.90. First support is Wednesday's low crossing at $226.70. Second support is May's low crossing at $221.15.
FOOD & FIBERhttp://quotes.ino.com/ex changes/?c=food
September coffee closed lower on Thursday as it extends the decline off June's high. The low-range close sets the stage for a steady to lower opening on Friday. Stochastics and the RSI are oversold but remain neutral to bearish signaling sideways to lower prices are possible near-term. If September extends the decline off June's high, March's low crossing at $16.44 is the next downside target. Closes above last-Friday's high crossing at $18.42 would signal that a short-term low has been posted. First resistance is last-Friday's high crossing at $18.42. Second resistance is June's high crossing at $19.17. First support is today's low crossing at $16.87. Second support is March's low crossing at $16.44.
September cocoa closed lower on Thursday. The low-range close sets the stage for a steady to lower opening on Friday. Stochastics and the RSI are overbought but remain neutral to bullish signaling that sideways to higher prices are possible near-term. If September extends the rally off March's low, monthly resistance crossing at 34.29 is the next upside target. Closes below the 20-day moving average crossing at 31.16 would signal that a short-term top has been posted.
October sugar closed sharply lower on Thursday. The low-range close sets the stage for a steady to lower opening on Friday. Stochastics and the RSI are overbought but are turning neutral to bearish signaling that sideways to lower prices are possible near-term. Closes below last-Tuesday's low crossing at 24.69 would signal that a short-term top has been posted while opening the door for a possible test of June's low crossing at 24.01. If October resumes this month's rally, the May 11th high crossing at 26.39 is the next upside target.
December cotton closed lower on Thursday. The mid-range close sets the stage for a steady to lower opening on Friday. Stochastics and the RSI are turning neutral signaling sideways trading is possible near-term. Closes above the 50-day moving average crossing at 81.33 would signal that a low has been posted. If December extends the decline off May's high, the May 25th low crossing at 78.45 is the next upside target.
Thanks much, tallpine!
https://www.marketforum.com/forum/topic/96481/#96573
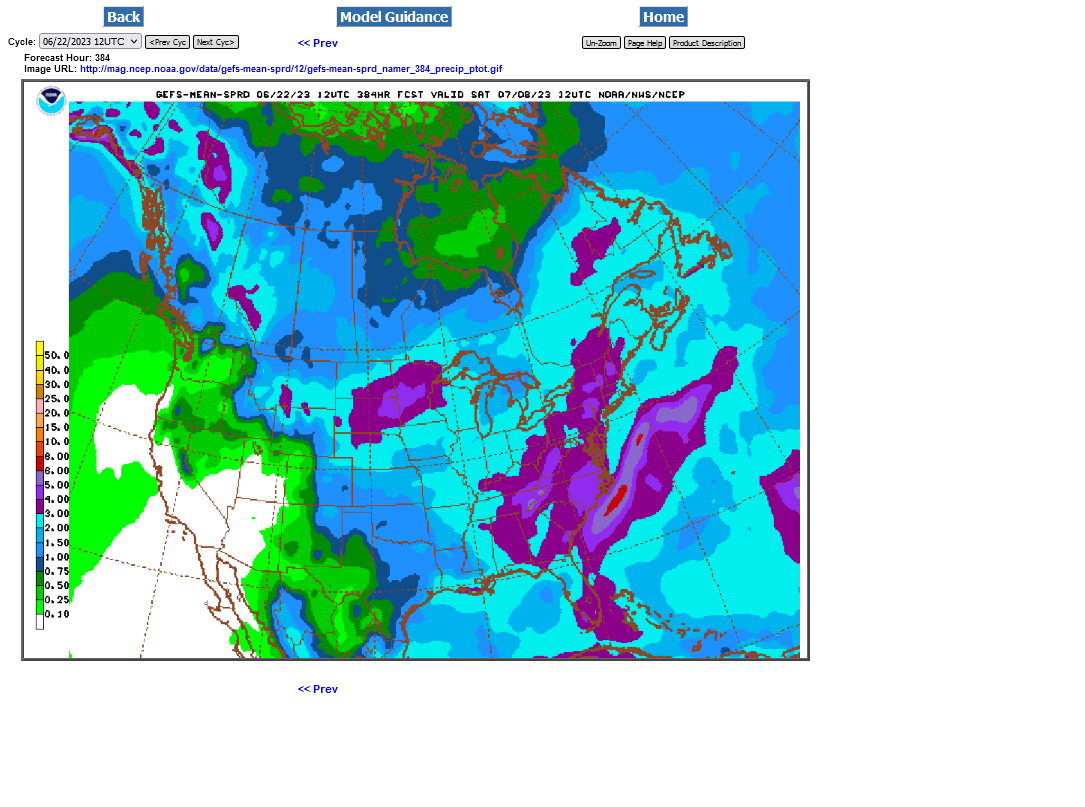
Rains continue to increase as expected with this NON dome flash drought. This was the last 12z GEFS. It's extremely difficult to stay short in this environment with the markets being so volatile and spiking in both directions. And you need to pick he right month and grain, which during this last trading session was new crop beans.
Old crop beans went up 40c between 10:30 am-Noon. No way that a day trader can be short during that period or even know those 90 minutes would be when that would happen. It ended -14c.
SX only went up 20c then and ended -37c for the day.
CN and CZ moved much closer to each other. They had about a +12c pop/correction to the upside during that same 90 minute period.
However, the CN at -12c was WEAKER than the CZ, -8c.
So a person selling on wetter weather would have done best by far in the SX new crop and 2nd best with the CN old crop.
All the weather is here:
https://www.marketforum.com/forum/topic/83844/
Week 2 guidance WET!
https://www.marketforum.com/forum/topic/83844/#83852
Extended weather.
https://www.cpc.ncep.noaa.gov/products/predictions/610day/ | |||||||||
| 6 to 10 day outlooks | |||||||||
| Click below for information about how to read 6-10 day outlook maps Temperature Precipitation | |||||||||
| Click below for archives of past outlooks (data & graphics), historical analogs to todays forecast, and other formats of the 6-10 day outlooks ArchivesAnalogsLines-Only FormatGIS Data | |||||||||
Temperature Probability | |||||||||
Precipitation Probability | |||||||||

