KEY EVENTS TO WATCH FOR:
Monday, June 26, 2023
10:30 AM ET. June Texas Manufacturing Outlook Survey
Business Activity (previous -29.1)
Mfg Production Idx (previous -1.3)
Tuesday, June 27, 2023
8:30 AM ET. May Advance Report on Durable Goods
Durable Goods-SA, M/M% (previous +1.1%)
Dur Goods, Ex-Defense, M/M% (previous -0.6%)
Dur Goods, Ex-Transport, M/M% (previous -0.2%)
Orders: Cap Gds, Non-Def, Ex-Air, M/M% (previous +1.4%)
Shipmnts: Cap Gds, Non-Def, Ex-Air, M/M% (previous +0.5%)
8:55 AM ET. Johnson Redbook Retail Sales Index
Ret Sales Mo-to-Date, Y/Y% (previous +0.7%)
Latest Wk, Y/Y% (previous +0.9%)
9:00 AM ET. April U.S. Monthly House Price Index
9:00 AM ET. April S&P CoreLogic Case-Shiller Indices
10-City Idx, M/M% (previous +1.6%)
10-City Idx, Y/Y% (previous -0.8%)
20-City Idx, M/M% (previous +1.5%)
20-City Idx, Y/Y% (previous -1.1%)
National Idx, M/M% (previous +1.3%)
National Idx, Y/Y% (previous +0.7%)
10:00 AM ET. June Richmond Fed Business Activity Survey
Mfg Idx (previous -15)
Shipments Idx (previous -13)
10:00 AM ET. June Consumer Confidence Index
Cons Conf Idx (previous 102.3)
Expectation Idx (previous 71.5)
Present Situation Idx (previous 148.6)
10:00 AM ET. May New Residential Sales
New Home Sales (previous 683K)
New Home Sales, M/M% (previous +4.1%)
New Home Sales Months Supply (previous 7.6)
1:00 PM ET. May Money Stock Measures
4:30 PM ET. API Weekly Statistical Bulletin
Crude Stocks, Net Chg (Bbls) (previous -1.2M)
Gasoline Stocks, Net Chg (Bbls) (previous +2.9M)
Distillate Stocks, Net Chg (Bbls) (previous -0.3M)
Wednesday, June 28, 2023
7:00 AM ET. MBA Weekly Mortgage Applications Survey
Composite Idx (previous 209.8)
Composite Idx, W/W% (previous +0.5%)
Purchase Idx-SA (previous 165.6)
Purchase Idx-SA, W/W% (previous +1.5%)
Refinance Idx (previous 425.1)
Refinance Idx, W/W% (previous -2.1%)
8:30 AM ET. Annual U.S. International Investment Position
8:30 AM ET. May Advance Economic Indicators Report
10:00 AM ET. May Metropolitan Area Employment and Unemployment
10:30 AM ET. EIA Weekly Petroleum Status Report
Crude Oil Stocks (Bbl) (previous 463.293M)
Crude Oil Stocks, Net Chg (Bbl) (previous -3.831M)
Gasoline Stocks (Bbl) (previous 221.402M)
Gasoline Stocks, Net Chg (Bbl) (previous +0.479M)
Distillate Stocks (Bbl) (previous 114.288M)
Distillate Stocks, Net Chg (Bbl) (previous +0.434M)
Refinery Usage (previous 93.1%)
Total Prod Supplied (Bbl/day) (previous 20.925M)
Total Prod Supplied, Net Chg (Bbl/day) (previous +0.517M)
Thursday, June 29, 2023
8:30 AM ET. 1st Quarter Revised Corporate Profits
8:30 AM ET. 1st Quarter 3rd estimate GDP
Annual Rate, Q/Q% (previous +1.3%)
Chain-Weighted Price Idx, Q/Q% (previous +4.2%)
Corporate Profits, Q/Q%
PCE Price Idx, Q/Q% (previous +4.2%)
Purchase Price Idx, Q/Q%
Real Final Sales, Q/Q%
Core PCE Price Idx, Ex
Food/Energy, Q/Q%
Personal Consumption, Q/Q% (previous +3.8%)
8:30 AM ET. Unemployment Insurance Weekly Claims Report - Initial Claims
Jobless Claims (previous 264K)
Jobless Claims, Net Chg (previous +0K)
Continuing Claims (previous 1759000)
Continuing Claims, Net Chg (previous -13K)
8:30 AM ET. U.S. Weekly Export Sales
10:00 AM ET. May Pending Home Sales Index
Pending Home Sales (previous 78.9)
Pending Home Sales Idx, M/M% (previous +0%)
Pending Home Sales Idx , Y/Y% (previous -20.3%)
10:30 AM ET. EIA Weekly Natural Gas Storage Report
Working Gas In Storage (Cbf) (previous 2729B)
Working Gas In Storage, Net Chg (Cbf) (previous +95B)
4:30 PM ET. Foreign Central Bank Holdings
4:30 PM ET. Federal Discount Window Borrowings
Friday, June 30, 2023
8:30 AM ET. May Personal Income and Outlays
Personal Income, M/M% (previous +0.4%)
Consumer Spending, M/M% (previous +0.8%)
PCE Price Idx, M/M% (previous +0.4%)
PCE Price Idx, Y/Y% (previous +4.4%)
PCE Core Price Idx, M/M% (previous +0.4%)
PCE Core Price Idx, Y/Y% (previous +4.7%)
9:45 AM ET. June Chicago Business Barometer - ISM-Chicago Business Survey -
Chicago PMI
PMI-Adj (previous 40.4)
10:00 AM ET. 1st Quarter GDP by State
10:00 AM ET. 1st Quarter State Quarterly Personal Income
10:00 AM ET. June University of Michigan Survey of Consumers - final
End-Mo Sentiment Idx (previous 59.2)
End-Mo Expectations Idx (previous 55.4)
12-Month Inflation Forecast (previous 4.2%)
5-Year Inflation Forecast (previous 3.1%)
End-Mo Current Idx (previous 64.9)
3:00 PM ET. May Agricultural Prices
Farm Prices, M/M% (previous +1.9%)
The STOCK INDEXES? http://quotes.ino.com/ex?changes/?c=indexes
The STOCK INDEXES: The September NASDAQ 100 was lower overnight and set the stage for a lower opening when the day session begins trading. Stochastics and the RSI are neutral to bearish signaling that sideways to lower prices are possible near-term. Closes below the 20-day moving average crossing at 14,895.08 would signal that a short-term top has been posted. If September renews this year's rally, the 87% retracement level of the 2021-2022-decline on the weekly continuation chart crossing at 15,957.86 is the next upside target. First resistance is the June 16th high crossing at 15,475.50. Second resistance is the 87% retracement level of the 2021-2022-decline on the weekly continuation chart crossing at 15,957.86. First support is the 20-day moving average crossing at 14,895.08. Second support is the June 1st low crossing at 14,420.00.
The September S&P 500 was lower overnight as it extends the decline off June's high. Overnight trading sets the stage for a lower opening when the day session begins trading. Stochastics and the RSI are bearish signaling that sideways to lower prices are possible near-term. Closes below the 20-day moving average crossing at 4359.91 would signal that a short-term top has been posted. If June renews the rally off March's low, the 75% retracement level of the 2022 decline crossing at 4505.40 is the next upside target. First resistance is June's high crossing at 4493.75. Second resistance is the 75% retracement level of the 2022 decline crossing at 4505.40. First support is the 20-day moving average crossing at 4359.91. Second support is the June 8th low crossing at 4305.75.
INTEREST RATES http://quotes.ino.com/ex changes/?c=interest"
INTEREST RATES: September T-bonds was higher overnight. Overnight trading sets the stage for a higher opening when the day session begins trading. Stochastics and the RSI are neutral to bullish signaling that sideways to higher prices are possible near-term. Closes above 50-day moving average crossing at 129-01 would signal that a short-term low has been posted while opening the door for additional gains near-term. If September renews the decline off April's high, the 87% retracement level of the March-April rally crossing at 124-19 is the next downside target. First resistance is the 50-day moving average crossing at 129-01. Second resistance is the June 1st high crossing at 129-16. First support is the 75% retracement level of the March-April rally crossing at 125-30. Second support is the 87% retracement level of the March-April rally crossing at 124-19.
September T-notes were higher overnight and sets the stage for a higher opening when the day session begins trading. Stochastics and the RSI are neutral to bullish signaling that sideways to higher prices are possible near-term. Closes above the 20-day moving average crossing at 113.154 would signal that a short-term low has been posted. If September renews the decline off May's high, the 87% retracement level of the March rally crossing at 111.243 is the next downside target. First resistance is the 20-day moving average crossing at 113.154. Second resistance is the June 1st high crossing at 115.000. First support is the 75% retracement level of the March-May rally crossing at 112.190. Second support is the 87% retracement level of the 2022-2023 rally crossing at 111.243.
ENERGY MARKETS? http://quotes.ino.com/ex?changes/?c=energy ""
ENERGIES:Augustcrude oil was steady to slightly higher overnight. Overnight trading sets the stage for a slightly higher opening when the day session begins trading. Stochastics and the RSI are neutral to bearish signaling that sideways to lower prices are possible near-term. Closes below the June 12th low crossing at $66.96 would open the door for a possible test of May's low crossing at $64.41. Closes above the 50-day moving average crossing at $72.52 would signal that a short-term low has been posted. First resistance is the 50-day moving average crossing at $72.52. Second resistance is the June 5th high crossing at $75.50. First support is the June 12th low crossing at $66.96. Second support is the May low crossing at $64.41.
August heating oil was slightly higher overnight and set sets the stage for a slightly higher opening when the day session begins trading. Stochastics and the RSI are neutral to bearish signaling that sideways to lower prices are possible near-term. Closes below the 20-day moving average crossing at 2.3756 would signal that a short-term top has been posted. If August renews the rally off May's low, April's high crossing at 2.6616 is the next upside target. First resistance is last-Tuesday's high crossing at 2.5069. Second resistance is April's high crossing at 2.6616. First support is the June 12th low crossing at 2.2876. Second support is the May 31st low crossing at 2.2301.
August unleaded gas was steady to slightly higher overnight and sets the stage for a slightly higher opening when the day session begins trading. Stochastics and the RSI are bearish signaling that sideways to lower prices are possible near-term. If August extends the decline off June's high, the June 12th low crossing at $2.3901 is the next downside target. If August renews the rally off May's low, the 87% retracement level of the April-May decline crossing at $2.6394 is the next upside target. First resistance is the 87% retracement level of the April-May decline crossing at $2.6394. Second resistance is April's high crossing at $2.7047. First support is the June 12th low crossing at $2.3901. Second support is the May 31st low crossing at 2.3394.
August natural gas was steady to slightly higher overnight. Overnight trading sets the stage for a slightly higher opening when the day session begins trading. Stochastics and the RSI are overbought but remain neutral to bullish signaling that sideways to higher prices are possible near-term. If August extends the rally off June's low, the 25% retracement level of the 2022-2023 decline crossing at 3.193 is the next upside target. Closes below the 20-day moving average crossing at 2.496 would signal that a short-term low has been posted. First resistance is the May 19th high crossing at 2.885. Second resistance is the 25% retracement level of the 2022-2023 decline crossing at 3.193. First support is the June 1st low crossing at 2.244. Second support is the September-2020 low on the monthly continuation chart crossing at 1.795.
CURRENCIEShttp://quotes.ino.com/ex changes/?c=currencies"
CURRENCIES:The September Dollar was slightly lower overnight and sets the stage for a lower opening when the day session begins trading later this morning. Stochastics and the RSI have turned neutral to bullish signaling that sideways to higher prices are possible near-term. Closes above the 20-day moving average crossing at $102.793 would signal that a short-term low has been posted. If September renews the decline off May's high, May's low crossing at $100.340 is the next downside target. First resistance is the May 31st high crossing at $104.250. Second resistance is the 38% retracement level of the 2022-2023 decline crossing at $104.932.First support is last-Thursday's low crossing at $101.485. Second support is May's low crossing at $100.340.
The September Euro was slightly higher overnight and sets the stage for a slightly higher opening when the day session begins trading. However, stochastics and the RSI are overbought and are turning neutral to bearish signaling that sideways to lower prices are possible near-term. Closes below the 20-day moving average crossing at 1.08660 would signal that a short-term top has been posted while opening the door for additional weakness near-term. If September resumes the rally off May's low, May's high crossing at $1.11710 is the next upside target. First resistance is last-Thursday's high crossing at $1.10615. Second resistance is May's high crossing at $1.11710. First support is the 20-day moving average crossing at 1.08660. Second support is May's low crossing at 1.07025.
The September British Pound was steady to slightly higher overnight. Overnight trading and sets the stage for a slightly higher opening when the day session begins trading. Stochastics and the RSI are turning neutral to bearish signaling that sideways to lower prices near-term. Closes below the 50-day moving average crossing at 1.2544 would confirm that a short-term top has been posted while opening the door for additional weakness near-term. If September renews the rally off May's low, the 75% retracement level of the 2022-2023 decline crossing at 1.3253 is the next upside target. First resistance is last-Thursday's high crossing at 1.2874. Second resistance is the 75% retracement level of the 2022-2023 decline crossing at 1.3253. First support is the 10-day moving average crossing at 1.2721. Second support is the 20-day moving average crossing at 1.2600.
The September Swiss Franc was higher overnight and sets the stage for a higher opening when the day session begins trading. Stochastics and the RSI are neutral signaling that sideways to higher prices are possible near-term. If September renews the rally off May's low, May's high crossing at 1.14920 is the next upside target. Closes below the 20-day moving average crossing at 1.12047 would signal that a short-term top has been posted. First resistance is the June 16th high crossing at 1.13410. Second resistance is May's high crossing at 1.14920. First support is the 20-day moving average crossing at 1.12047. Second support is June's low crossing at 1.10920. Third support is May's low crossing at 1.10700.
The September Canadian Dollar was higher overnight and sets the stage for a higher opening when the day session begins trading. Stochastics and the RSI are overbought but remain neutral to bullish signaling that sideways to higher prices are possible near-term. If September extends the rally off the May 26th low, the 38% retracement level of the 2022-2023 decline crossing at $76.28 is the next upside target. Closes below the 20-day moving average crossing at $75.09 would signal that a short-term top has been posted. First resistance is last-Thursday's high crossing at $76.22. Second resistance is the 38% retracement level of the 2022-2023 decline crossing at $76.28. First support is the 10-day moving average crossing at $75.71. Second support is 20-day moving average crossing at $75.09.
The September Japanese Yen was slightly higher in overnight trading as it consolidates some of this month's decline. Overnight trading sets the stage for a higher opening when the day session begins trading. Stochastics and the RSI are oversold but remain neutral to bearish signaling that sideways to lower prices are possible near-term. If September extends the decline off the March's high, the October 21st -2022 low crossing at 0.069270 is the next downside target. Closes above the 20-day moving average crossing at 0.072251 would signal that a short-term low has been posted. First resistance is the June 1st high crossing at 0.073430. Second resistance is the 50-day moving average crossing at 0.074009. First support is the 87% retracement level of the 2022-2023 rally crossing at 0.070777. Second support is the October 21st -2022 low crossing at 0.069270.
PRECIOUS METALS http://quotes.ino.com/ex changes/?c=metals"
Precious Metals: Augustgold was higher overnight as it consolidates some of last-Thursday's downside breakout of the May-June trading range. Overnight trading sets the stage for a higher opening when the day session begins trading later this morning. Stochastics and the RSI are oversold but remain neutral to bearish signaling that sideways to lower prices are possible near-term. If August extends the decline off May's high, the 50% retracement level of the September-May rally crossing at $1892.30 is the next downside target. Closes above the 20-day moving average crossing at $1964.20 would signal that a short-term low has been posted. First resistance is the 20-day moving average crossing at $1964.20. Second resistance is the 50-day moving average crossing at $2000.00. First support is the 50% retracement level of the September-May rally crossing at $1892.30. Second support is the 62% retracement level of the September-May rally crossing at $1842.60.
July silver was higher overnight and sets the stage for a higher opening when the day session begins trading later this morning. Stochastics and the RSI are oversold but remain neutral to bearish signaling that sideways to lower prices are possible near-term. If July extends this month's decline, the 75% retracement level of the March-April rally crossing at $21.708 is the next downside target. Closes above the 20-day moving average crossing at $23.565 would signal that a short-term low has likely been posted. First resistance is the 20-day moving average crossing at $23.565. Second resistance is the 50-day moving average crossing at $24.368. First support is the 75% retracement level of the March-April rally crossing at 21.708. Second support is the 87% retracement level of the March-April rally crossing at 20.946.
July copper was steady to slightly higher overnight and sets the stage for a slightly higher opening when the day session begins trading. Stochastics and the RSI are bearish signaling that sideways to lower prices are possible near-term. Closes below the 20-day moving average crossing at 3.7917 would signal that a short-term top has been posted. If July renews the rally off May's low, May's high crossing at 4.0050 is the next upside target. First resistance is last-Thursday's high crossing at 3.9670. Second resistance is May's high crossing at 4.0050. First support is the 20-day moving average crossing at 3.7917. Second support is May's low crossing at 3.5450.
GRAINS http://quotes.ino.com/ex changes/?c=grains
Grains: December corn was steady to fractionally lower overnight as it consolidates some of its recent gains. Overnight trading sets the stage for a steady to fractionally lower opening when the day sessions begins trading. Stochastics and the RSI are overbought and are turning neutral to bearish signaling that sideways to lower prices are possible near-term. Closes below the 20-day moving average crossing at $5.58 1/4 would signal that a short-term top has been posted.If December renews the rally off May's low, the 75% retracement level of the 2022-2023 decline crossing at $6.32 1/2 is the next upside target. First resistance is last-Wednesday's high crossing at $6.29 3/4. Second resistance is the 75% retracement level of the 2022-2023 decline crossing at $6.32 1/2. First support is the 10-day moving average crossing at $5.84 1/4. Second support is the 20-day moving average crossing at $5.58 1/4.
September wheat was higher overnight as it extends the rally off June's low. Overnight trading sets the stage for a higher opening when the day session begins trading. Stochastics and the RSI are overbought but remain neutral to bullish signaling that sideways to higher prices are possible near-term. If September extends the rally off May's low, the 38% retracement level of the 2022-2023 decline crossing at $7.95 1/4 is the next upside target. Closes below the 20-day moving average crossing at $6.65 3/4 would signal that a short-term top has been posted. First resistance is the overnight high crossing at $7.70 1/4. Second resistance is the 38% retracement level of the 2022-2023 decline crossing at $7.95 1/4. First support is the 10-day moving average crossing at $7.03. Second support is the 20-day moving average crossing at $6.65 3/4.
September Kansas City wheat was higher overnight and is poised to extend the rally off the May 31st low. Overnight trading sets the stage for a higher opening when the day session begins trading later this morning. Stochastics and the RSI are overbought but remain neutral to bullish signaling that sideways to higher prices are possible near-term. If September extends this month's rally, May's high crossing at $9.02 is the next upside target. Closes below the 20-day moving average crossing at $8.16 1/2 would signal that a short-term top has been posted. First resistance is last-Thursday's high crossing at $8.89 1/2. Second resistance is May's high crossing at $9.02. First support is the 10-day moving average crossing at $8.33 1/4. Second support is the 20-day moving average crossing at $8.16 1/2.
September Minneapolis wheat was higher overnight and is poised to resume the rally off the May 31st low. Overnight trading sets the stage for a higher opening when the day session begins trading. Stochastics and the RSI are overbought but remain neutral to bullish signaling that sideways to higher prices are possible near-term. If September extends the rally off the May 31st low, April's high crossing at $9.10 1/2 is the next upside target. Closes below the 20-day moving average crossing at $8.28 would signal that a short-term top has been posted. First resistance is last-Thursday's high crossing at $8.94 1/2. Second resistance is April's high crossing at $9.10 1/2. First support is the 10-day moving average crossing at $8.50. Second support is the 20-day moving average crossing at $8.28.
SOYBEAN COMPLEX? http://quotes.ino.com/ex?changes/?c=grains "
November soybeans were higher overnight and sets the stage for a higher opening when the day session begins trading later this morning. Stochastics and the RSI are overbought and are turning neutral to bearish signaling that sideways to lower prices are possible near-term. Closes below the 20-day moving average crossing at $12.39 1/2 would signal that a short-term low has been posted. If November extends the rally off June's low, the 87% retracement level of the 2022-2023 decline crossing at $14.07 1/2 is the next upside target. First resistance is the 75% retracement level of the 2022-2023 decline crossing at $13.69 1/4. Second resistance 87% retracement level of the 2022-2023 decline crossing at $14.07 1/2. First support is the 10-day moving average crossing at $13.01. Second support is the 50-day moving average crossing at $12.45 3/4.
December soybean meal was higher overnight as it consolidates some of the decline off last-Wednesday's high. Overnight trading sets the stage for a higher opening when the day session begins trading. Stochastics and the RSI have turned neutral to bearish signaling that sideways to lower prices are possible near-term. Closes below the 50-day moving average crossing at $391.40 would signal that a short-term top has been posted. If December renews the rally off May's low, March's high crossing at $437.70 is the next upside target. First resistance is last-Wednesday's high crossing at $432.60. Second resistance is March's high crossing at $437.70. First support is the 50-day moving average crossing at $391.40. Second support is the 20-day moving average crossing at $382.00.
December soybean oil was higher overnight as it consolidates some of the decline off the June 16th high. Overnight trading sets the stage for a higher opening when the day session begins trading. Stochastics and the RSI are turning neutral to bullish signaling that sideways to higher prices are possible near-term. If December renews the rally off May's low, the February 22nd high crossing at 60.52 is the next upside target. Closes below the 50-day moving average crossing at 50.86 would signal that a short-term top has been posted. First resistance is February 22nd high crossing at 60.52. Second resistance is the December 30th high crossing at 63.57. First support is the 50-day moving average crossing at 50.86. Second support is May's low crossing at 44.47.
Thanks, tallpine!
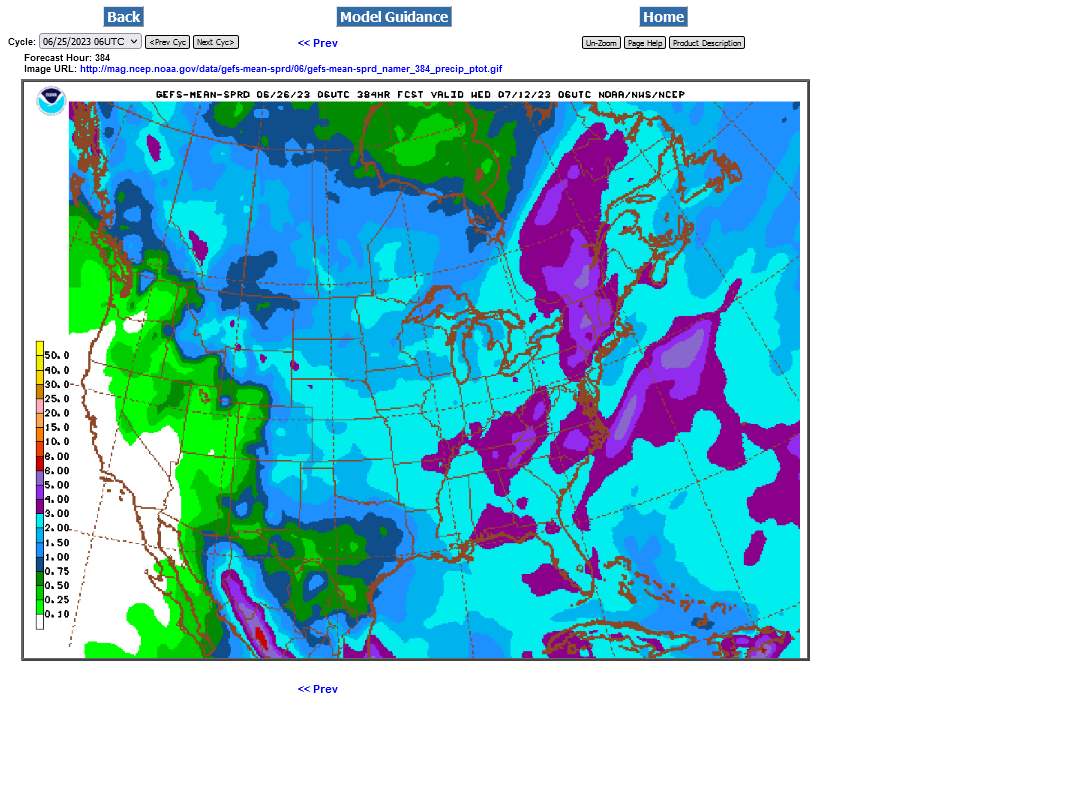
lots of uncertainty with the upcoming weather. The gefs is still the wettest model.
crop ratings should drop again this afternoon.
extended rains may stabilize the crop but not eliminate the flash drought in many places.
last 6z GEFS