Crop ratings should fall this afternoon.
This was last week's report and discussions:
https://www.marketforum.com/forum/topic/96481/
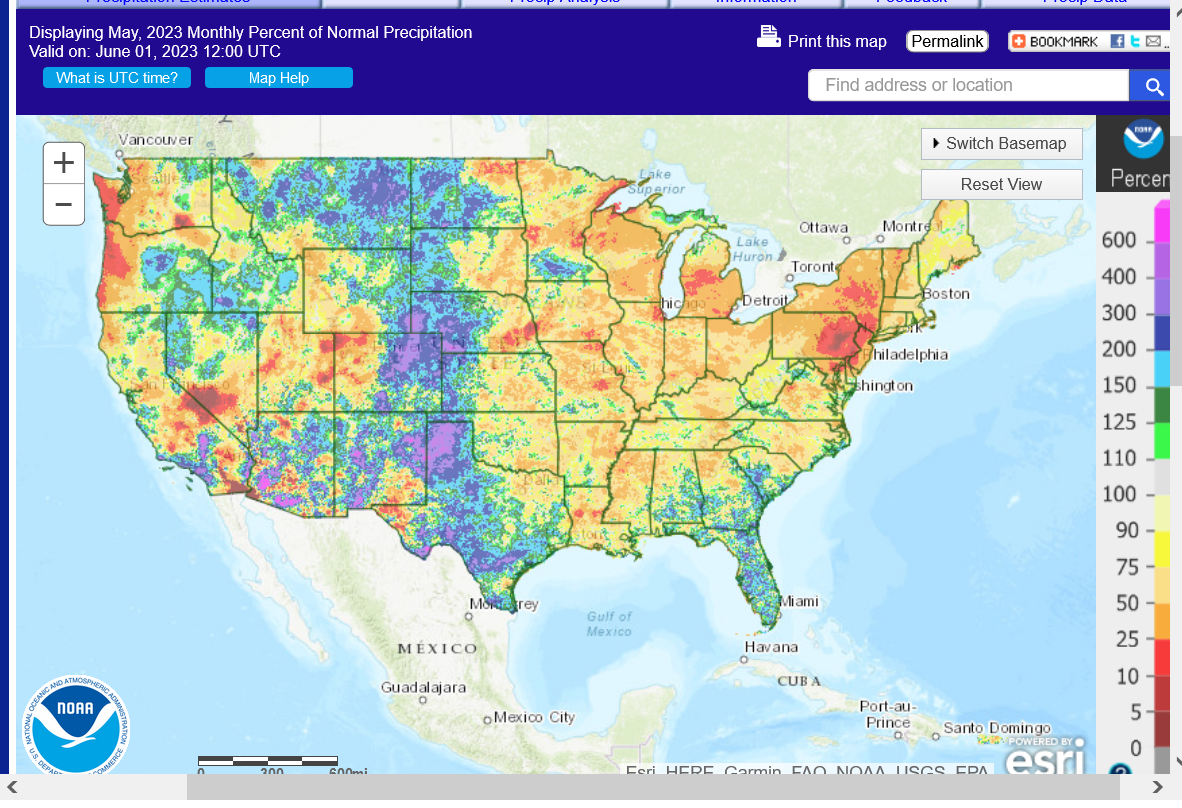
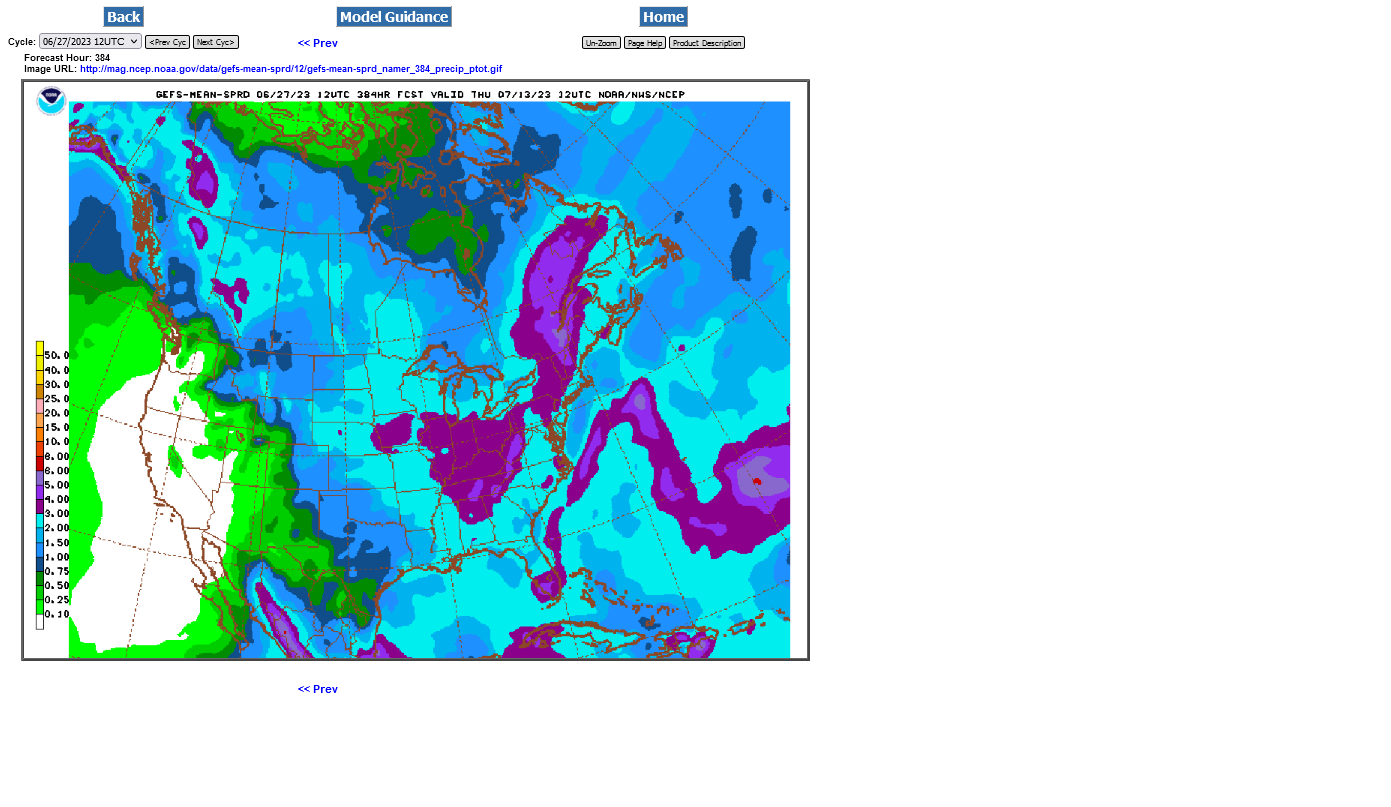
Note the % of average rain map below. The driest areas will have the biggest drops today.
A few states (N.Plains/Southeast) that got nice rains will stabilize or improve. There was rain in much of MN.
Rains in small parts of n.IA/IL/IN but those states should deteriorate. MO had heat and no rain and will likely have the LOWEST ratings, with IL being pretty low also.

++++++++++
https://www.spc.noaa.gov/climo/reports/230625_rpts.html

The dry areas below are also the highest producing C and S belt. Much of that area will have lower crop ratings this afternoon.
https://www.marketforum.com/forum/topic/83844/#83853
Soilmoisture anomaly:
These maps sometimes take a day to catch up to incorporate the latest data(the bottom map is only updated once a week).
https://www.cpc.ncep.noaa.gov/products/Soilmst_Monitoring/US/Soilmst/Soilmst.shtml#
![]()


++++++++++++++++++++++++++++
Final May precip map below
https://water.weather.gov/precip/
Updated daily below:
https://mrcc.purdue.edu/cliwatch/watch.htm#curMonths

Most of the severe drought in the West has been wiped out!
https://droughtmonitor.unl.edu/
Last week, June 22, 2023
Huge expansion of drought in the Midwest!!

Drought monitor previous years: You can see the natural La Niña, (cold water-in the tropical Pacific)causing the drought! Starting in 2020, then worsening for 2+ years!
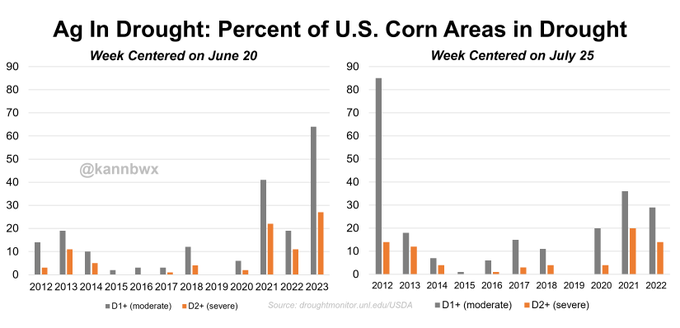
64% of U.S. #corn areas were in drought as of Tuesday, up from 57% a week earlier and the most ever for the week (records date to and include 2012). Severe drought coverage jumped to 27% from 19% in the prior week.
Temperatures heated up a bit in these locations:
https://www.cpc.ncep.noaa.gov/products/tanal/temp_analyses.php
As I've been saying all month, this is NOT a dome of death heat ridge like the ones we normally have causing Summer droughts. NOT like 2012 at all.......unless the weather models do an abrupt shift!
·
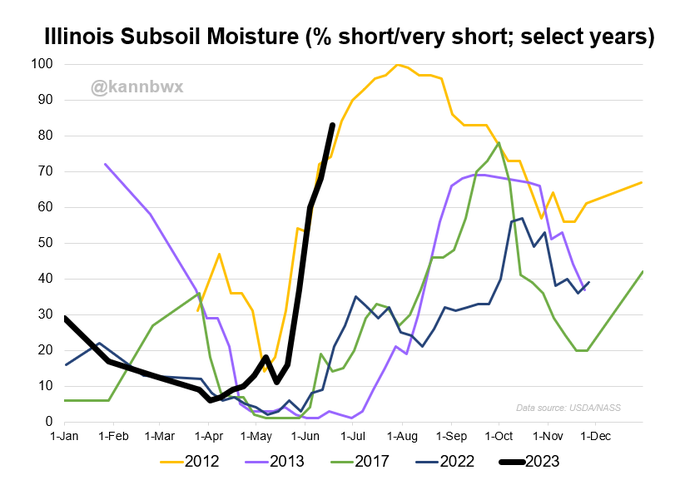
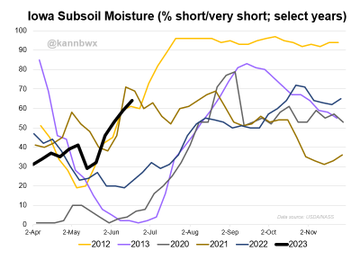
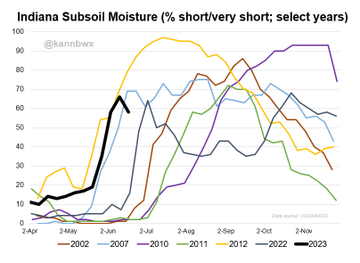
I-state subsoil moisture, June 18. Illinois subsoil was 83% short or very short versus 37% three weeks earlier. The progression is identical to 2012 so far. Iowa was up 5pts on the week to 64%, but Indiana improved 8pts to 58%.
IN MY NECCO-DA-WOODS ~ THE CROPS DON'T LOOK ANY WORSE FOR WEAR, THAN THEY DID, LAST WEEK.
THEY SHOULD REALLY BENEFIT FROM THE 1.29" OF RAIN, YESTERDAY & THE 0.52" WE'BE GOTTEN THROUGHOUT, TODAY.
THE HUMIDITY & DEW POINT LEVELS ARE HIGH OVERNIGHT & MORNINGS
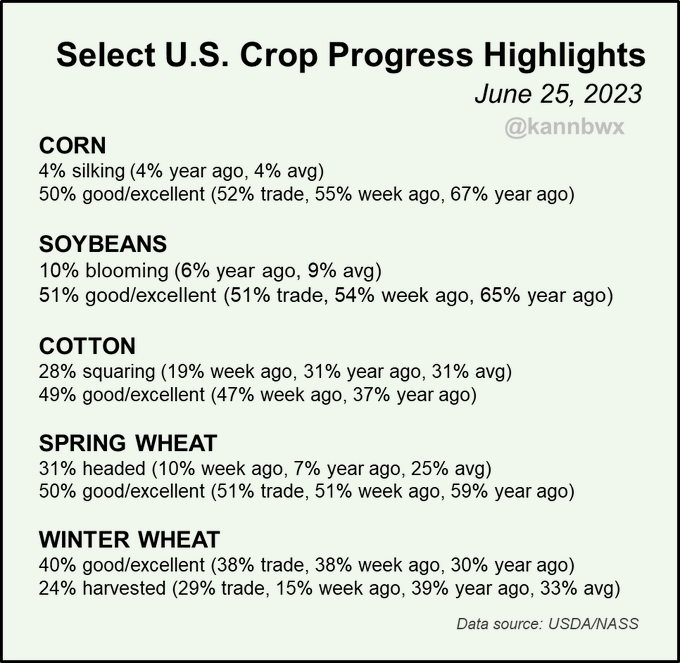
https://release.nass.usda.gov/reports/prog2523.txt
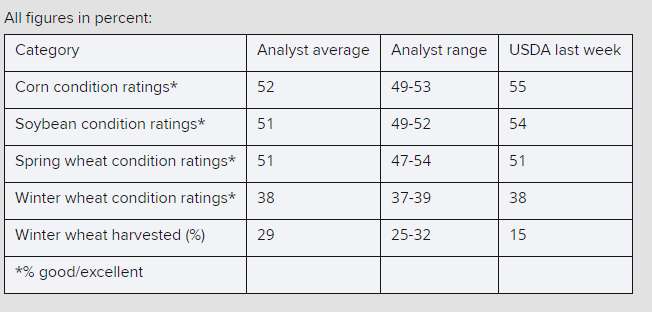
Corn -5%
Beans -3%
Spring wheat -1%
Cotton +2%
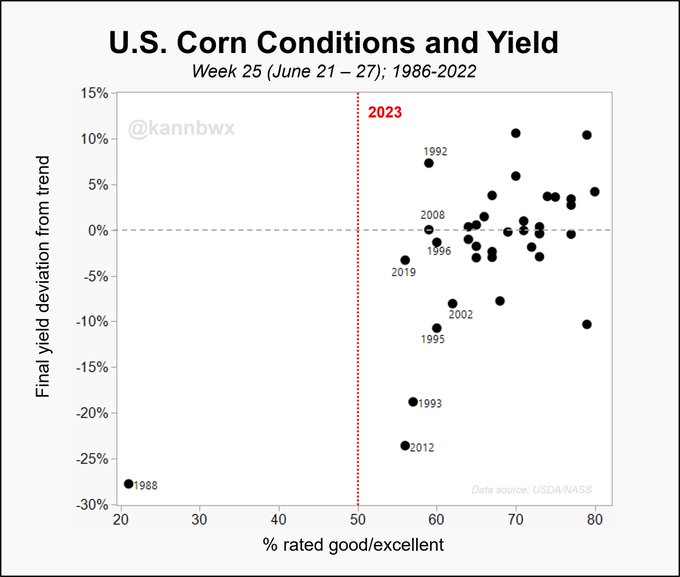
U.S. #corn is rated just 50% good/excellent, the week's lowest since 1988. Conditions for #soybeans fell by the expected degree, but winter #wheat harvest is decently slower than predicted.
This is why I found it a bit odd that new crop, December corn was the weakest link today.
However, this was likely dialed in by the spike higher earlier this month and the weather models keep promising an increase in rains, which were the most yet on the 12z runs.
This was the last 12z GEFS. The EE matches up with this and actually has MORE rain in IA than the previously wetter GEFS. This is bearish weather.
Again, this is NOT a dome of death, blocking high which is almost always the case for long lasting Cornbelt droughts of the past.
However, so far, the models have been OVERpredicting rains, so I will be skeptical of this much rain coming because the pattern doesn't change enough to strongly convince me they are coming.
 Below is the upper level/500 mb pattern in 2 weeks from the EE.
Northwest flow! The hope is that El Nino perturbations will come over the ridge and track southeast into the Midwest.
An upper level ridge in the Plains and trough along the East Coast is NOT the best pattern for delivering good rains to the Midwest. It's not likely to end drought, only to stabilize conditions unless it morphs into being unusually active for northwest flow. …which can happen.
Also, areas close to that NON blocking ridge will have bouts of heat and above average temperatures.
El Nino seasonals and global warming are very favorable for weather and we are in an El Niño but could be getting trumped by forcing from unusually warm temps in the Atlantic. 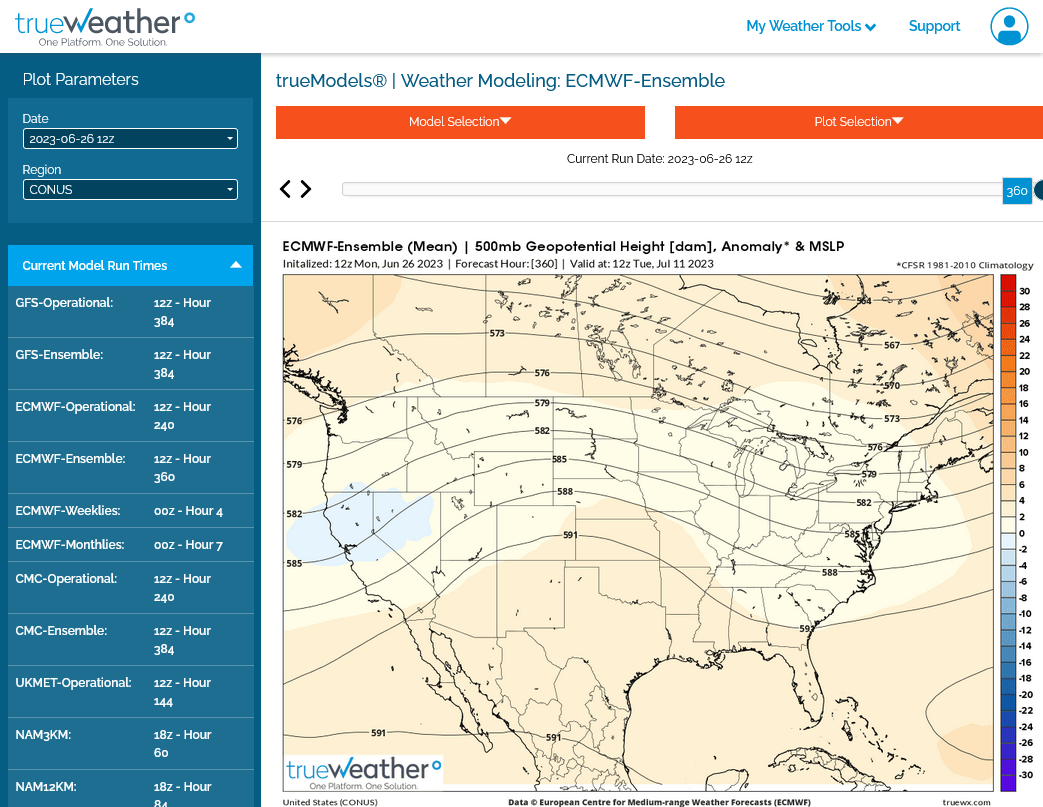
I would think with -5% on the corn condition, CZ will open higher but the models have all added rains in the last runs.
IF they are on the right track, corn has limited upside. We need to take rain out to be off to the races and resuming the bull run. At least that's how I'm playing it from the sidelines.
CZ opened up around +6c and that was the highs as expected. Off 8c from those highs and -2c from the Monday close.
SX -13c at the moment.
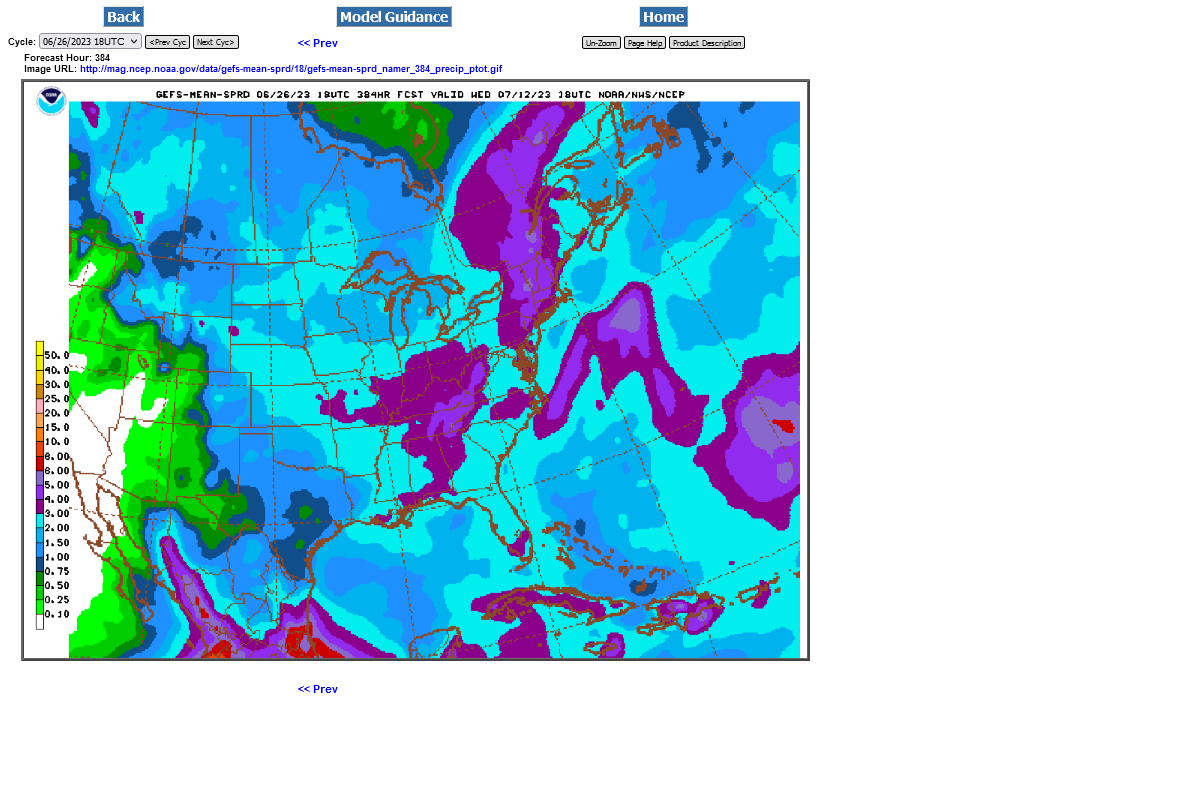
This is the last 18z GEFS and the reason for the weakness. 2+ inches most places, 3+ inches in purple. Way too much rain to be bullish.
Old crop CN is bucking the trend at +5c with only 10% of the volume(2,300) of the CZ(23,000).
tjc,
If you're still interested in buying CZ at 568, I would be careful. You'll need alot of this rain to be taken out for that trade to work.
That can happen, especially with this type of pattern with an upper level ridge in the Plains just needing to build more than models are forecasting But it’s going the other way.
We've lost a lot of yield potential already so the market might be hesitant to drop too far If rains don’t continue to increase.
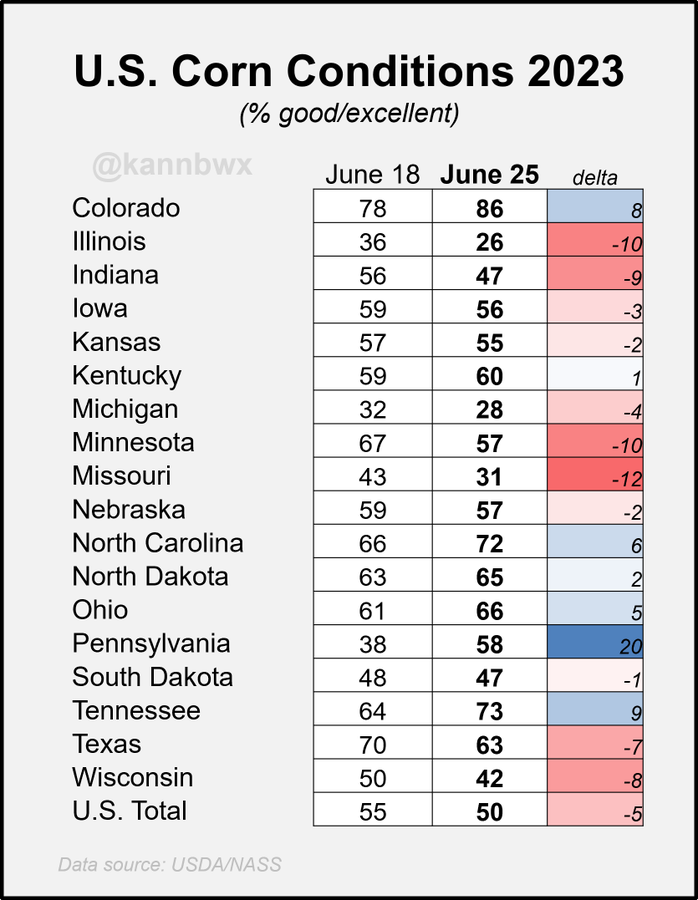
U.S. #corn was 50% good/excellent and 15% poor/very poor as of Sunday, down from 55% and 12% a week earlier. Sizable declines out of key states. Illinois at 26% G/E and 27% P/VP is VERY troubling. IL grew 16.5% of the 2022 U.S. crop.
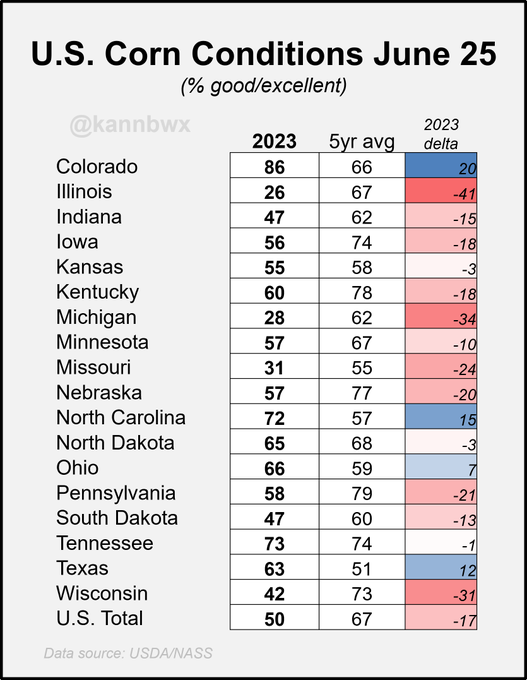
U.S. #corn condition at 50% good/excellent is 17 points below the week's 5-year average. Ohio is the only core state beating its average, but that can't offset huge departures in other top states, including 41 points in Illinois.
I usually exclude 1988 from this chart to better display the yearly variation, but that no longer makes sense. U.S. #corn conditions are migrating to an island of their own with no comparable years. But that 56-62% G/E range is interesting: 6 of 8 w/ sub trend yield.
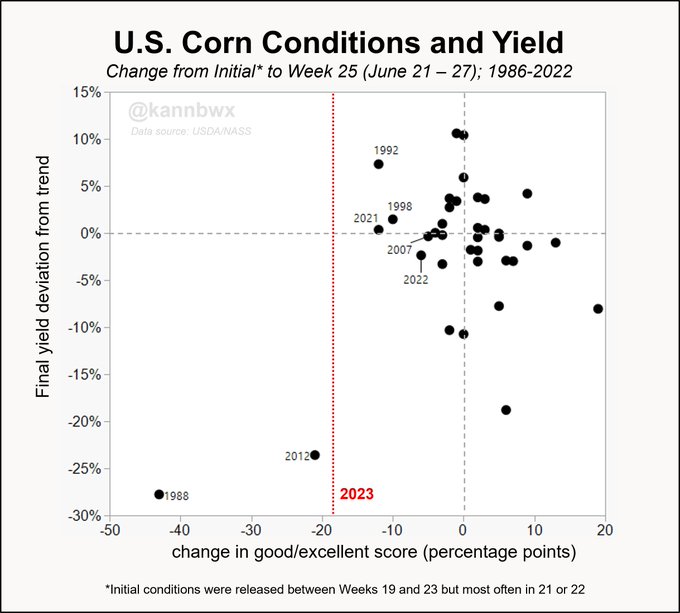
Exact same chart as above, but now labeling years where #corn ratings fell 5 points or more from initial to week 25. Including 2023, that has happened in only 8 of 38 years, and it is now three straight. 6 of 38 were -10 or more. Scatterplots are the true MVP of analysis
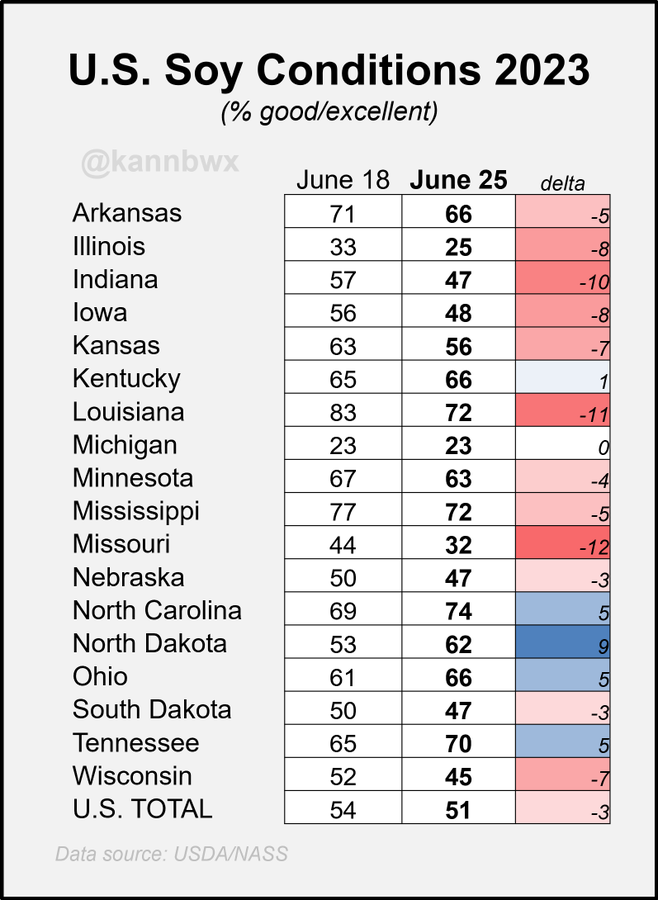
U.S. #soybeans at 51% good/excellent is the week's worst condition since 1988 (same stat as corn). Poor/very poor stands at 14%. Top producer Illinois (16% of 2022 crop) is 25% G/E and 23% P/VP. Iowa, Indiana & Nebraska (combined 28% of 2022 crop) are all sub-50% G/E.
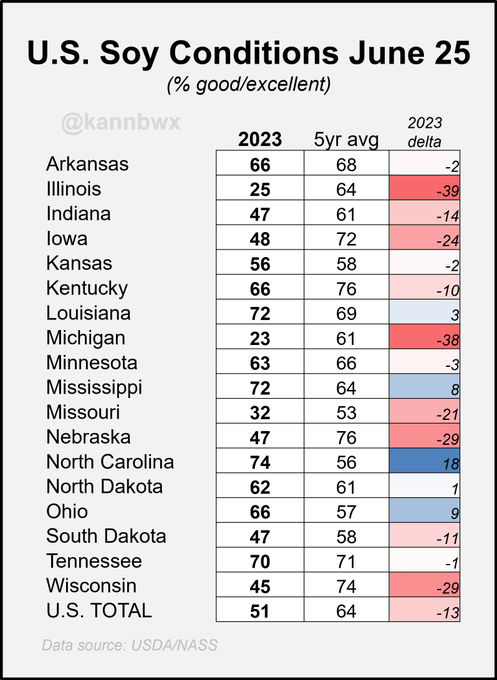
Nationally, 51% G/E is 13 points below average, though the I-state departures are particularly unsettling. Does sub-50% G/E still hold the potential for trendline yield in these states? (Honestly I don't know, I'll have to investigate).
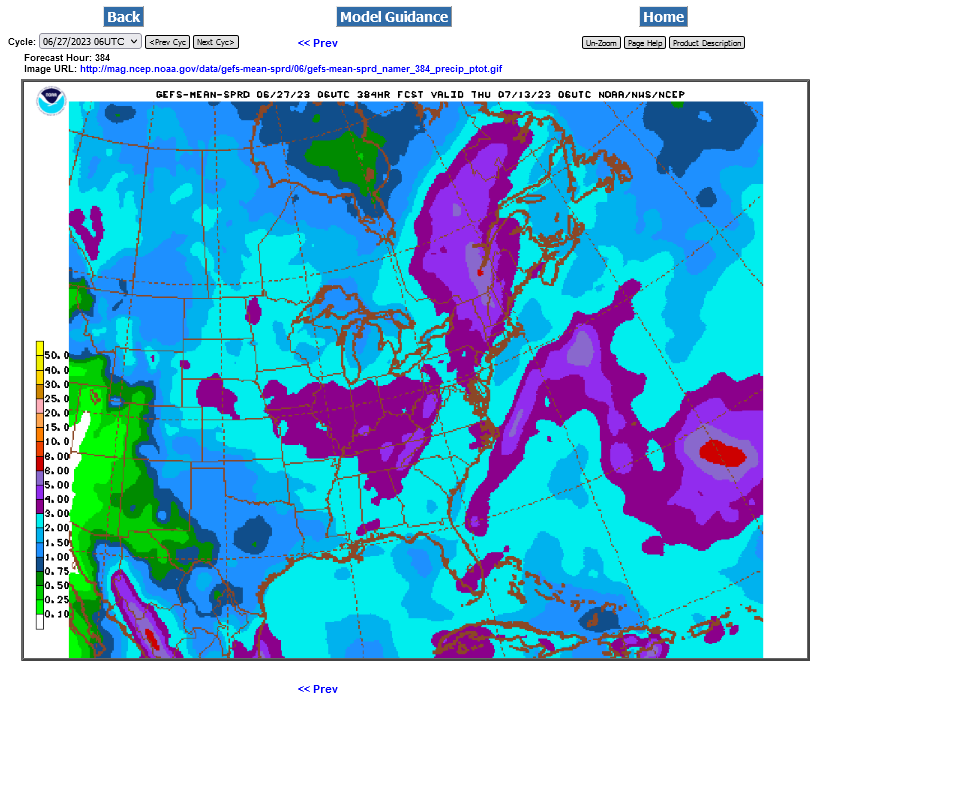
Rains continued to increase overnight.
models now have 3+ inches in most places the next 2 weeks.
the EE looks especially wet with the southwest cornbelt getting 4+ inches.
This was the last 6z GEFS
This morning break has taken CZ to the 50% retracement. Will now sell 595 the 25% level and 612 the 87% level
Thanks much, tjc,
If we get back up to those levels, its likely because alot of rain is taken out, in which case I would want to be long and not selling.
What happened to your buying 568 and buying new lows advice from yesterday's session?
https://www.marketforum.com/forum/topic/96653/#96745
long 564
Did not initiate trade until after the reopen, but "should" have calculated the 50% retracement
3 inches? really? Don't think that is gonna happen but time will tell. Seems Snodgrass thinks a front will block these predicted rains and force them further south toward ARK and the rain for the parched areas would then get shorted again. We sure got shorted in the predicted rains for May and June and the pattern continued over the weekend and again yesterday, except for a tornado and some hail damage
I guess the market seems to see something that may not be there come Friday. Down heavy
Thanks, tjc!
mcfarm,
yes, the models and the forecasters that use them have over predicted rain the last 2 months.
that usually happens in a drought.
The driest model has big rains this time (EE).
I can see exactly what Eric is noting as storms in a pattern like this, coming around the periphery of a heat ridge will often like to curve farther south towards the warmer more humid air.
that might happen and cause the northern half of the Cornbelt to miss.
Future rain makes grain on steroids today. I totally get how big the increase in rains are on the models and how much good they will do the crop in those places in July but have been surprised at how much risk premium was sucked out so fast with the worst crop ratings since 1988.
Buy the rumor sell the fact. The crop ratings yesterday were dialed in earlier this month when the market saw it coming weeks beforehand.
We trade FUTURES not Pastures (-:
Last 12z GEFS.
The EE has much less rain than this in the Upper Midwest.
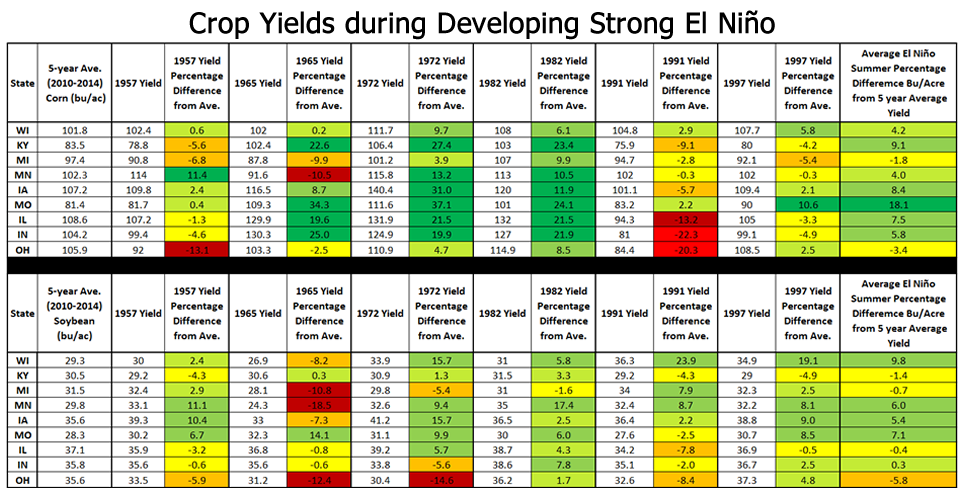
We are looking at the actual Summer weather features and patterns in real time and they completely trump any other analogs from decades ago. Each year is different and this one will be different than the ones below. This helped us to guesstimate 2 months ago but we've already experienced the first part of the growing season and it was NOT GOOD!
Models right now show some active ring of fired type storms coming around the periphery of the heat dome in the S.Plains that's been baking TX in June.
I have a concern that this might evolve into a weather pattern similar to the Summer of 1980, despite the current strengthening El Nino. The heat dome that year was centered in TX, like it is now but it was able to expand into the Midwest at times.
The current teleconnection pattern: upper trough-West Coast, upper trouph-East Coast, upper ridge-Plains is in the right place for the TX heat dome to expand northward.
As long as we get active perturbations coming over the top of the dome and northern stream energy continuing to contain it...........it stays down there. However, 1980 has similarities that didn't go so well for our July/August growing season.
but for now, the models show tons of rain, especially for the southern cornbelt, enough even to make a dent in the flash drought, so rain makes grain mentality until based on the most important thing to the models NOT analogs but instead the latest weather models.
++++++++++++++++++++++++++++
https://www.marketforum.com/forum/topic/96190/#96227
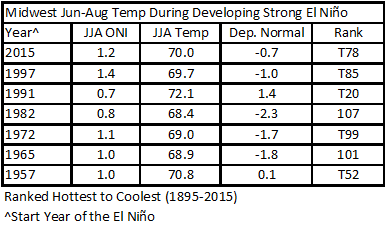
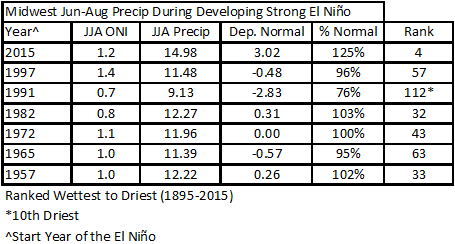
Only 1 year, 1991 featured notably hotter and drier than average growing season weather when there was a strong El Nino developing!!!
This greatly increases the odds for above trend yields this Summer for all crops in the Midwest and potential for RECORD yields.
https://mrcc.purdue.edu/mw_climate/elNino/impacts.jsp
Weather models still wet overnight. enough to make a huge dent in the flash drought for the southern Cornbelt.
EE not as much rain for upper Midwest.
You guys that are long with no risk protection or not telling us anything are not doing anybody any favors.
what experience tells me on a public forum is that often, people wait to see what happens with the market.
If their position turns into a huge loss, they post later that they already got out.
or for some reason, we find out that they didn’t take the losing position they advised Earlier.
or they wait until it turns in their favor, then they start posting about their profits.
ill move this post to the thread on December corn when back in my office later today.
Stopped out 649.5 at 6:34 am cst. Did not want a breach of 650. Apparently "too much rain coming".
(Stop was placed BEFORE your post, not because of it)
Thanks much for being honest and your usually very insiteful posts, tjc.
even the best traders take losses and having a plan along with being disciplined like you were is what preserves capital so we can live to trade again with a higher probability trade.
I almost never post trades because I often fail to be disciplined and will trade impulsively and without stops and will enter or exit on a weather model Or be afraid to take my own advice.
I like it that you guys post your trades. This forum is for traders to do exactly that.
please don’t take it personal when I give you a hard time.
your positive trading ideas are a great contribution.
ps, this last 6z gefs had the most rain yet. I’ll have the maps later. 3+ inches in much of the Midwest, with only the upper Midwest being leSS than that.

The mega dollar 2023 grain rally is OVER. Basis and bids being pulled or at least discounted.
Look for unspectacular bounces (to sell) UNTIL Fall when results come in less than anticipated.
50%, and now .62% retracements have failed.
MM, you ever read jerry gulke. A market advisor/trader/producer from Ill. He is famous for posting a change in his position right after a big move like today. Covered, shorted, spread, did something tricky and came out on top. Looks easy when you post the next day
Summary from earlier on tallpine's page:
https://www.marketforum.com/forum/topic/96817/#96818
We got 1.5 inches here in the southwest corner of IN earlier. More than the last 2 months added up! Yippeee!
Another round hitting in a few minutes. From not enough to too much )-:
https://www.marketforum.com/forum/topic/83844/
https://www.iweathernet.com/total-rainfall-map-24-hours-to-72-hours
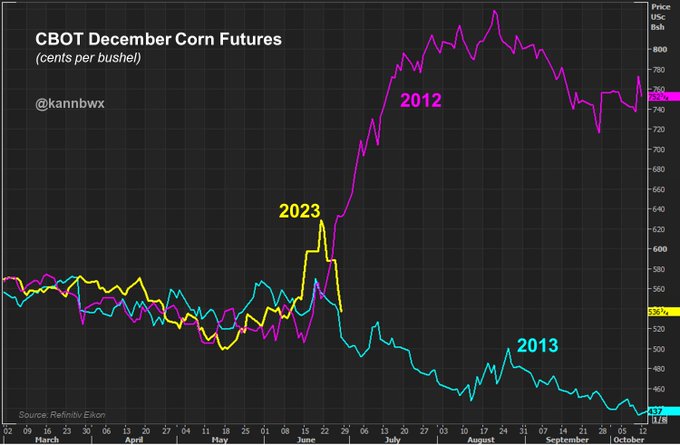
December #corn wanted to be 2012 last week but more like 2013 this week. Perhaps 2023 just wants an identity of its own. Futures are still up 15 cents/bu this month with two trading days left, though they closed Wed 93 cents off last week's high.
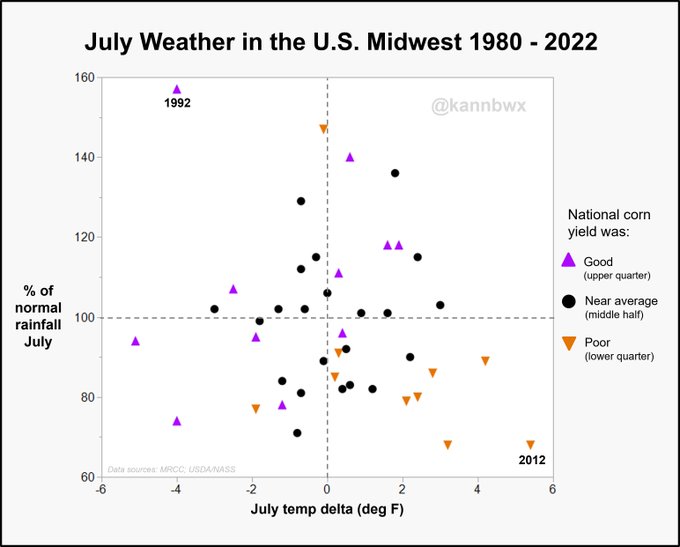
July weather in the U.S. Midwest vs #corn yields Of these 43 years, the two *most* extreme Julys, 1992 & 2012, have been among favorite analogs for 2023. 1992 is even more isolated than 2012 - don't forget how cool it was, also. Is a middle-ground compromise perhaps better?
We got 3 huge rains on Thursday That totaled 3.6 inches. The forecast is still the same With a lot more on the way. I’ll have the forecast maps later today.
the usda report is coming up and that could be part of why grains bounced from the get go overnight but it might be from too much rain in the southern Cornbelt coming up For some,places.
i think quite a few spots in the southern cornbelt might get 8 inches in a pattern like this if it continues.
Corn will do great with that. "Beans don't like wet feet"
This was the 0z EE solution. Very heavy rains southern 60% of the cornbelt, close to 5 inches but a sharp cutoff with much rain in the Upper Midwest.
The GEFS has MORE rain this this. 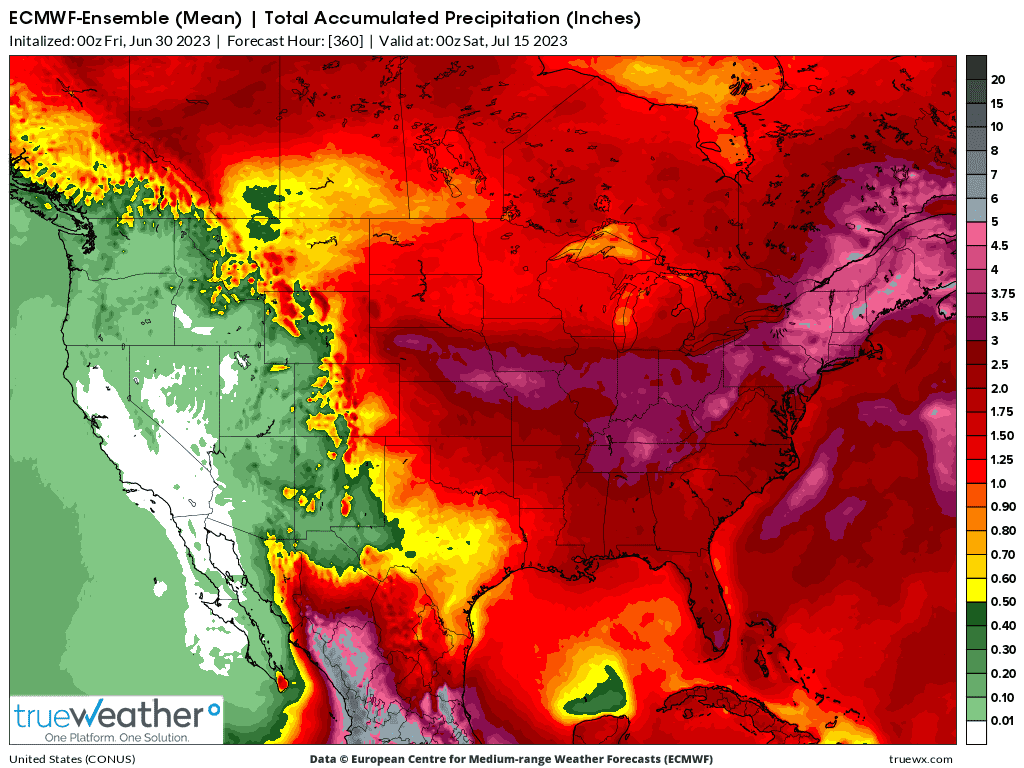
I'll have a version that copies borders later today but we were on the western edge of this band that had 6 inches in the epi center yesterday.
https://www.iweathernet.com/total-rainfall-map-24-hours-to-72-hours

Even the updated weeks 3-4 has turned MEGA bearish:
https://www.cpc.ncep.noaa.gov/products/predictions/WK34/