I'll be on again, this time to talk about the exaggerated heat in the Midwest.
If you miss it on your radio, they have archives.
Drew Mariani Show at 2:15pm
https://relevantradio.com/listen/our-shows/the-drew-mariani-show/
I told Drew that the crop improved 20% in the last month for some reason, instead of the actual number of 10% )-:
Whoops, that's what happens when you're over the hill in the broadcasting business (-:
Interesting that I will also be on this tv program, at 1:20m this afternoon, taping tomorrow's show.
https://www.bek.news/ladiesofanotherview
They tell me we that should be done by 2pm, in time for Relevant Radio.
These were some of the maps that I used for Ladies Of Another View.
They should look familiar to readers here!
Graphic #1
Global surface temperatures

Image(s) #2 Phoenix population and temperatures-both of these together on the same page-heat island effect


Image #3 North Dakota top 10 hottest daily temperatures-same page for both dates/all the data please
Wednesday, July 26
| Top 10 Record Daily High Temperatures for Bismarck | ||
|---|---|---|
| Value | Date | |
| 1 | 106 | 07/26/1929 |
| 2 | 102 | 07/26/2021 |
| 3 | 101 | 07/26/1988 |
| - | 101 | 07/26/1933 |
| - | 101 | 07/26/1930 |
| 6 | 99 | 07/26/1941 |
| - | 99 | 07/26/1931 |
| 8 | 98 | 07/26/1914 |
| 9 | 97 | 07/26/1952 |
| - | 97 | 07/26/1900 |
Thursday July 27
| Top 10 Record Daily High Temperatures for Bismarck | ||
|---|---|---|
| Value | Date | |
| 1 | 107 | 07/27/1931 |
| 2 | 106 | 07/27/1988 |
| 3 | 104 | 07/27/1959 |
| 4 | 101 | 07/27/1960 |
| 5 | 99 | 07/27/2006 |
| - | 99 | 07/27/1933 |
| - | 99 | 07/27/1917 |
| 8 | 98 | 07/27/1952 |
| - | 98 | 07/27/1890 |
| 10 | 97 | 07/27/1941 |
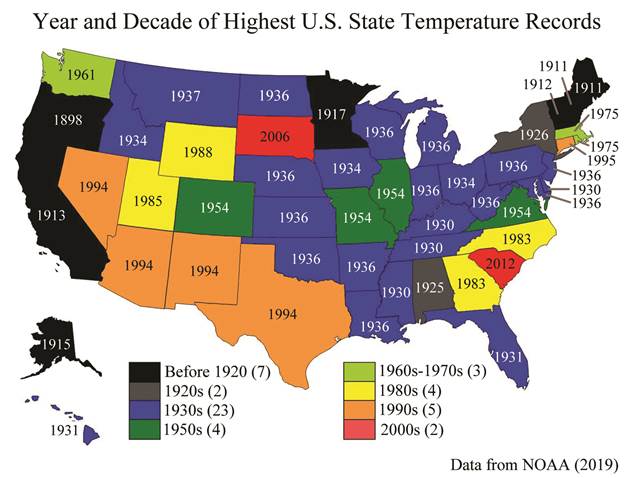
| Image #4 Year of the Record high temperature for every state | ||||
 | ||||
Image(s) #5. Heat waves and drought in the 1930s. Can we have both of these images on the same page, please. 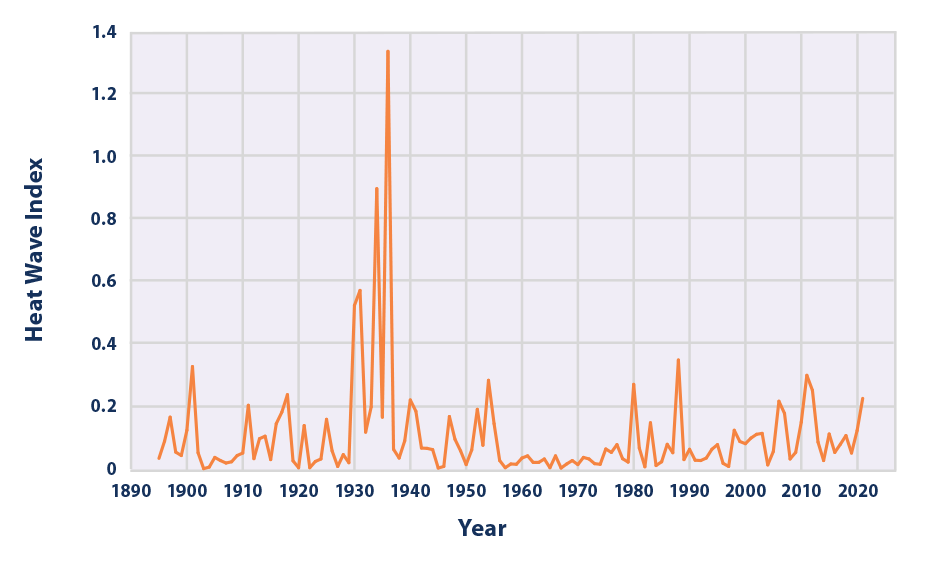 | ||||
Image #6. Climate deaths  | ||||
7. Greatest climate crisis in history 1876-1878. 50 million died, 3% of the global population.  I'm thinking this may be more than enough for the first 8 minutes but could be off by a couple of minutes and can just adjust accordingly. So the graphics below are tentatively for the 2nd segment but I could move them up or actually finish the last ones above in the 2nd segment. ++++++++++++++++++++++++++ | ||||
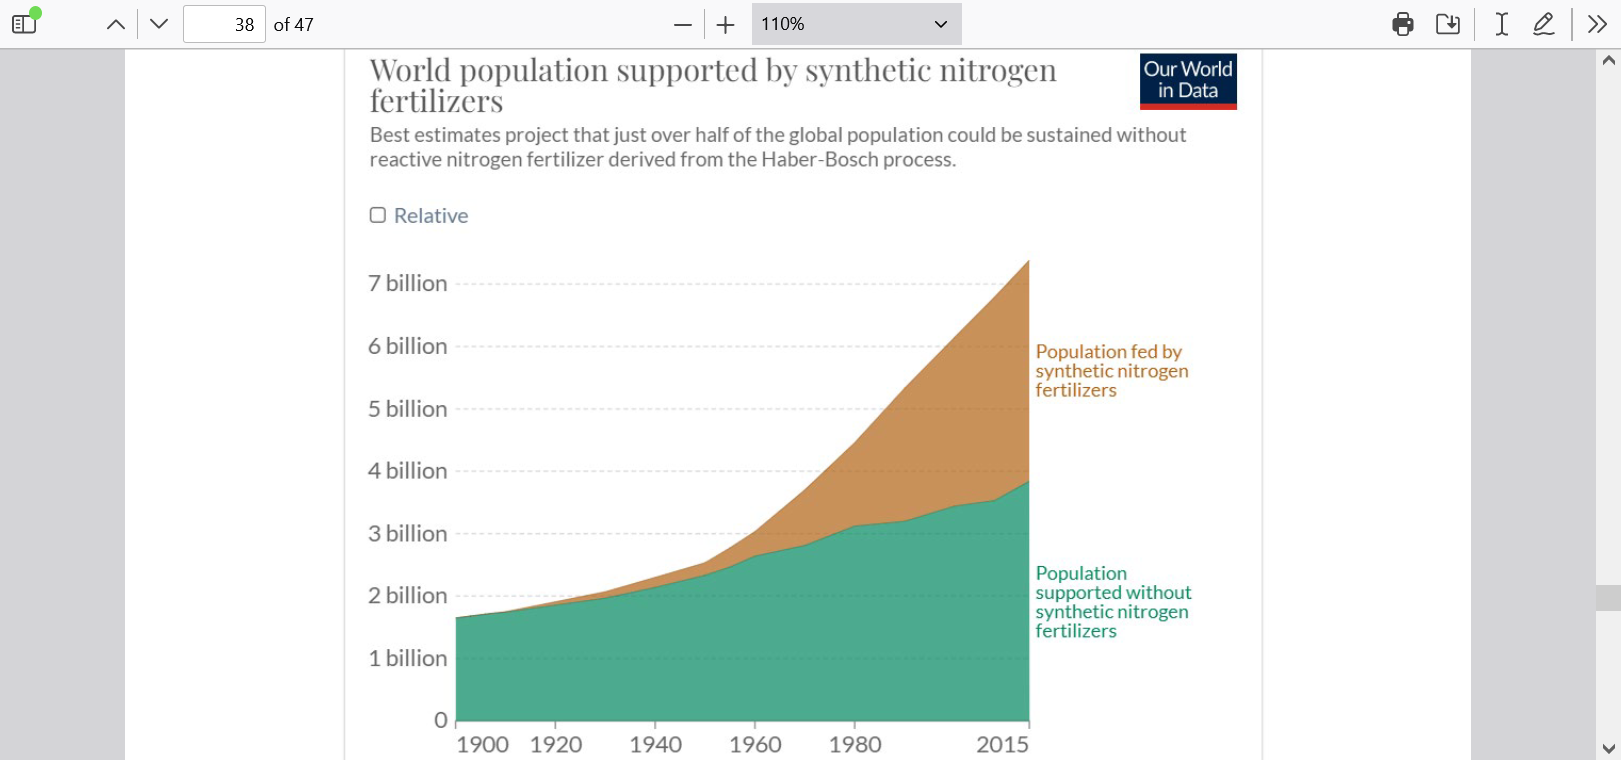
8. Crop Yields and fossil fuel synthetic nitrogen fertilizer. Can we get both images on the same page? If not, let me know

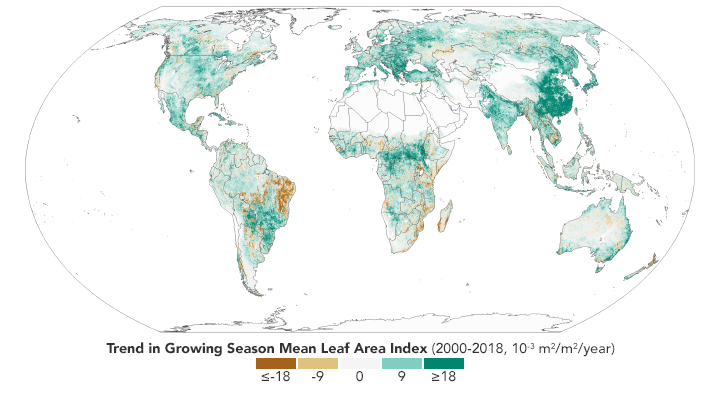
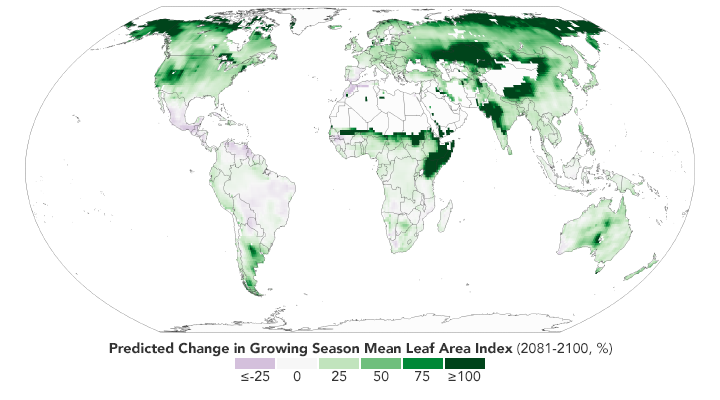
9. The Planet is greening up from CO2 fertilization and the climate optimum. Can you get both these on the same page, please?
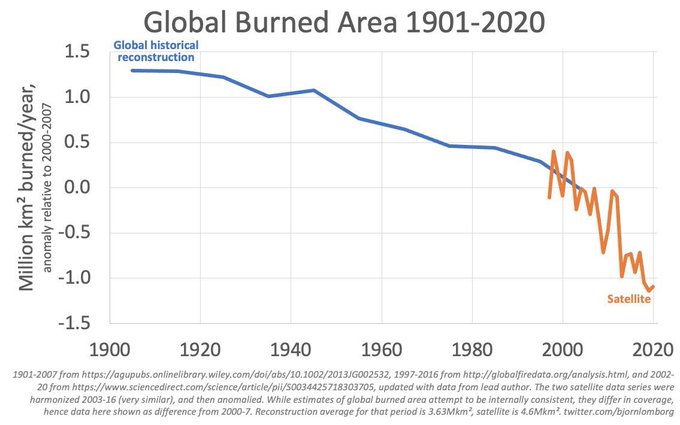
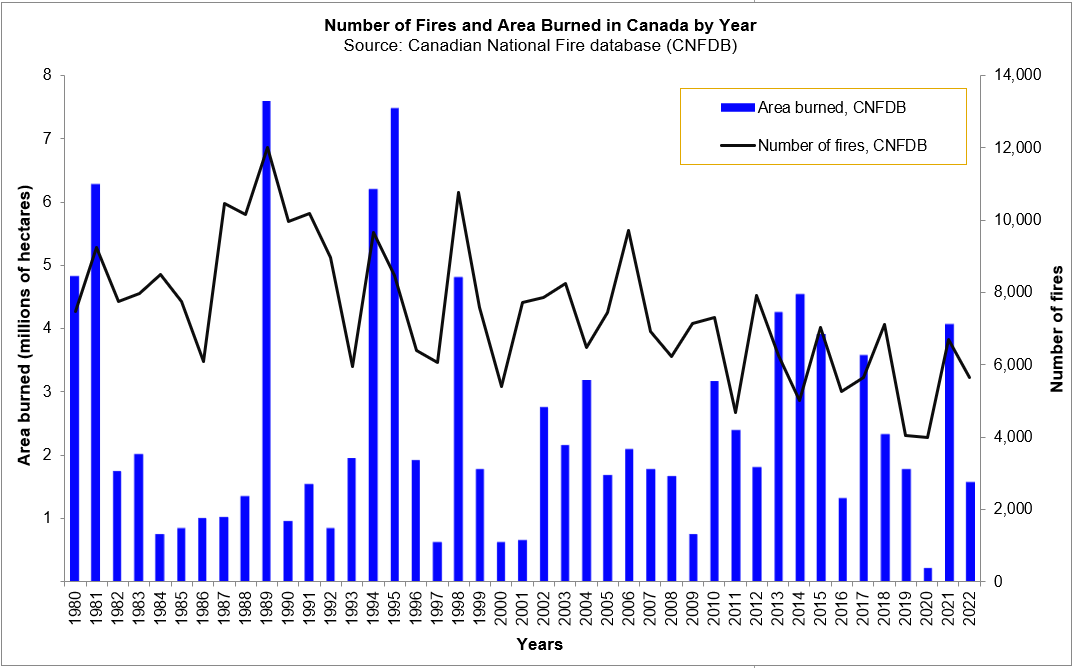
10. Canadian Wildfires
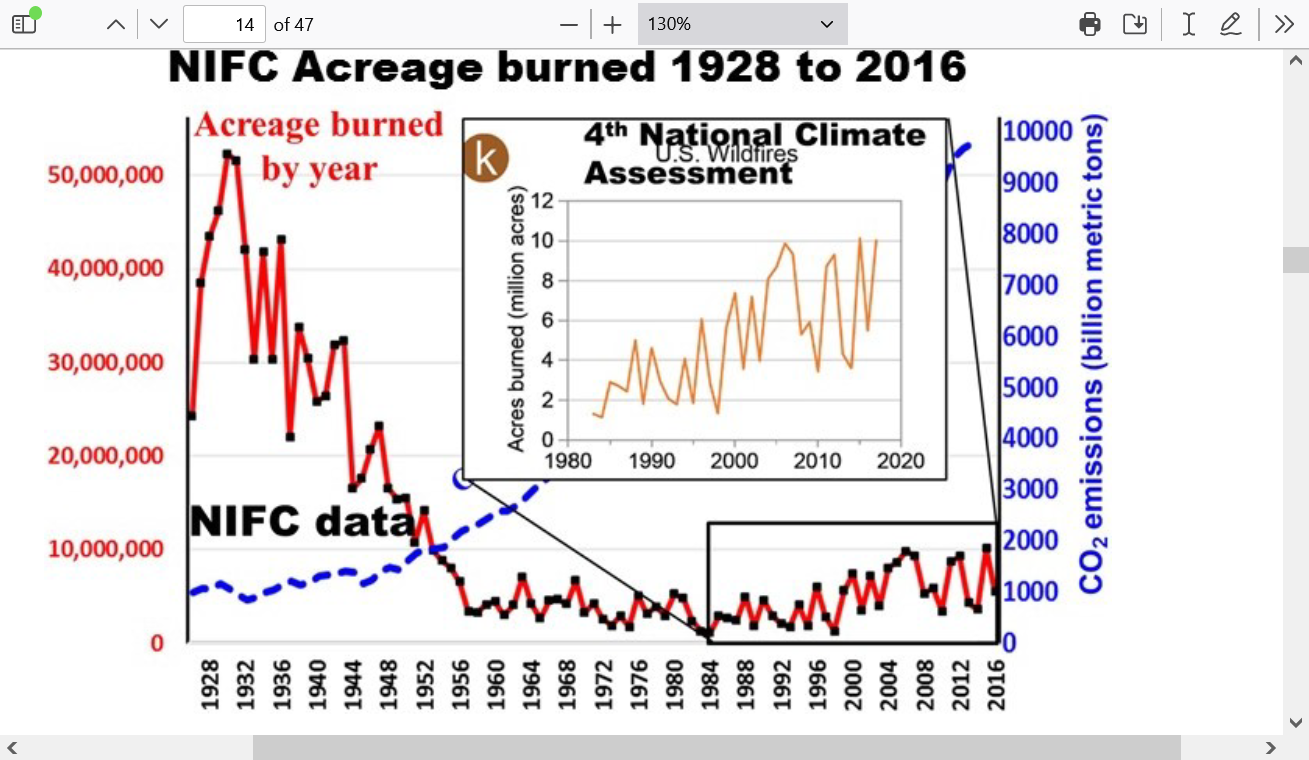
11. US wildfires and global wildfires. Can you get them on the same page?
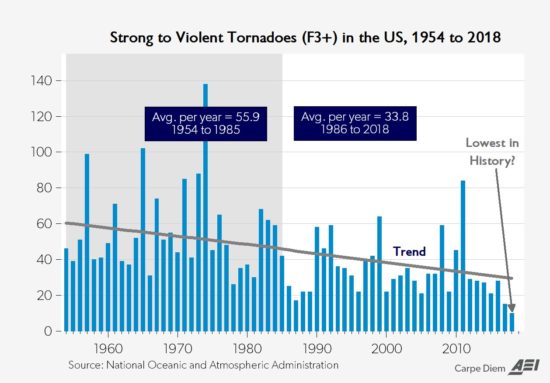
12. Strong to violent tornadoes
13. Hurricanes

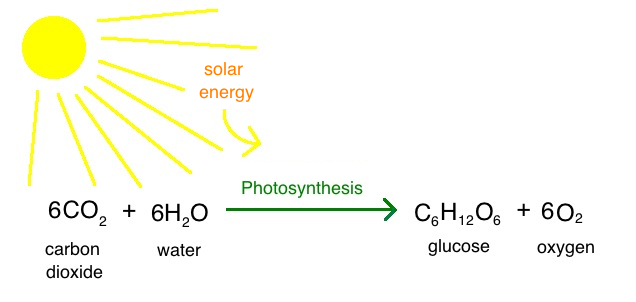
14. Photosynthesis. I can conclude with this and elaborate on many beneficial elements for several minutes if we are short for some reason.
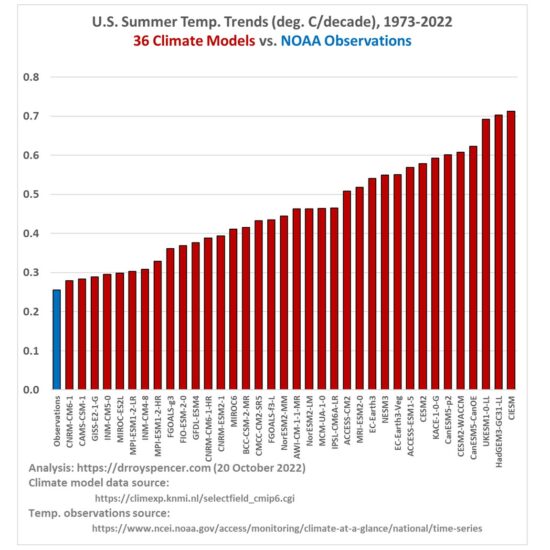
#15. Climate models are all too warm.
Here's more good use of the information to help inform people:
https://wattsupwiththat.com/2023/07/25/james-hansen-on-fire/
Mike Maguire
July 25, 2023 2:21 pm
“The world is shifting towards a superheated climate not seen in the past 1m years, prior to human existence, because “we are damned fools” for not acting upon warnings over the climate crisis, according to James Hansen, the US scientist who alerted the world to the greenhouse effect in the 1980s”
We’ve been hearing this month that this is the hottest in 125,000 years. Now its headed to the hottest in the past 1m years.
These people don’t actually look at the data.
We still aren’t above the 2016 peak yet from the El Nino. That should happen in the next year by a small margin.
Most of the hottest temperatures ever for each U.S. state have not been broken during this climate crisis. Just in the 1930’s, 23 of the 50 states had their hottest ever temperature that still stands today.
July 1936 was almost 5 degrees hotter than July 2023.
OK, that just 1 country but most of the decade of the 1930’s was like that in the U.S. with widespread droughts, year after year.
So let’s expand the horizon slightly back to 1876-1878, shortly after the Little Ice Age ended with the global temperature 1 deg. C cooler than this and CO2 at 130 parts per million less than this.
Climate and the Global Famine of 1876–78
https://journals.ametsoc.org/view/journals/clim/31/23/jcli-d-18-0159.1.xml
During the late nineteenth century, a series of famines affected vast parts of Asia, causing mortality on a scale that would be unthinkable today (Davis 2001). Of these, the so-called Global Famine lasting from 1876 to 1878 was the most severe and widespread in at least the past 150 years (Hasell and Roser 2018; Gráda 2009; Davis 2001). The Global Famine inflicted acute distress upon populations in diverse parts of South and East Asia, Brazil, and Africa, with total human fatalities likely exceeding 50 million. These famines were associated with prolonged droughts in India, China, Egypt, Morocco, Ethiopia, southern Africa, Brazil, Colombia, and Venezuela (Davis 2001; Clarke 1878; Hunter 1877). Historical documentation indicates famine-related mortality between 12.2 and 29.3 million in India, between 19.5 and 30 million in China, and ~2 million in Brazil (Davis 2001), amounting to ~3% of the global population at the time. It was arguably the worst environmental disaster to ever befall humanity
++++++++++++++++++++++
These people continue to be completely denying that the current regime is a climate OPTIMUM for life and climate change is PROTECTING US.
They cherry pick every extreme and call it a climate crisis.
In June, it was cool in Phoenix but hot in Texas………..so all the reporters went to Texas to tell us about how hot it was and impossible without the climate crisis.
In July, the heat moved to Phoenix………so all the reporters moved to Phoenix.
Wherever the heat goes, that’s where they report from and they use it to tell us the planet is on fire.
No……….just the usual natural variations in weather that have always happened, while they cherry pick the expected extremes and call them a crisis.
Today’s fake climate crisis is a picnic compared to much worse weather/climate events in the past BEFORE CO2 went up.
Speaking of picnics.
It was warmer than this in the higher latitudes of North America between 9,000 to 5,000 years ago (that’s a bit less than Hansen’s 1 million years). There was less Arctic sea ice. CO2 levels were lower. Thousands of years before the Industrial Age.
That’s why it’s called the Holocene climate OPTIMUM……BECAUSE it was so warm…..the way most life prefers it.
https://en.wikipedia.org/wiki/Holocene_climatic_optimum
We're being told that this is the hottest Summer ever in the US.
These were the temperatures thru yesterday:
https://www.marketforum.com/forum/reply_post/97589/
https://www.wunderground.com/cat6/North-Americas-Most-Intense-Heat-Wave-July-and-August-1936
These were the temperature anomalies for July 1936.

Making it even worse, it was followed by August 1936.

https://wattsupwiththat.com/2023/07/25/james-hansen-on-fire/
Been watching the radars in for our Relevant Radio friends in MN/WI today and happy with the results.
The storms may die out overnight, however before getting too far south.
MSP
+++++++++++++++++
Green Bay
Day 1 below:
http://www.wpc.ncep.noaa.gov/qpf/fill_94qwbg.gif?1526306199054
Severe Storm Risk......updated daily(days 1 and 2 twice daily).
https://www.spc.noaa.gov/products/outlook/
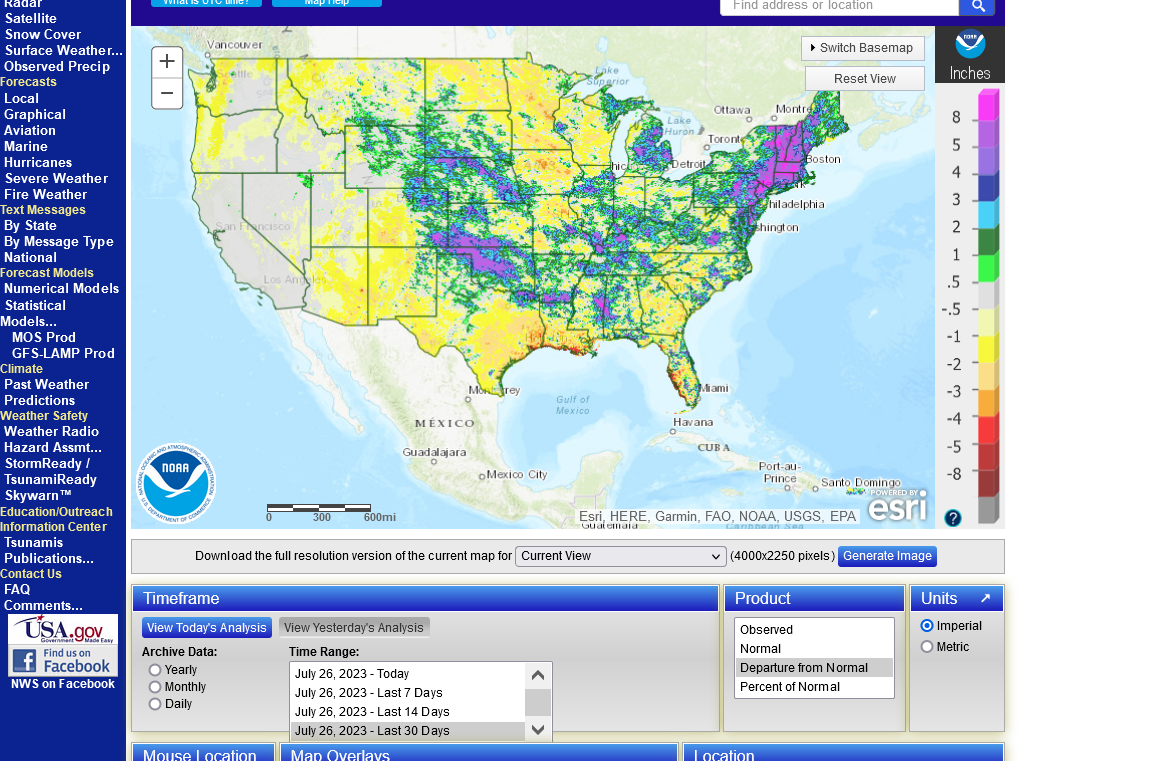
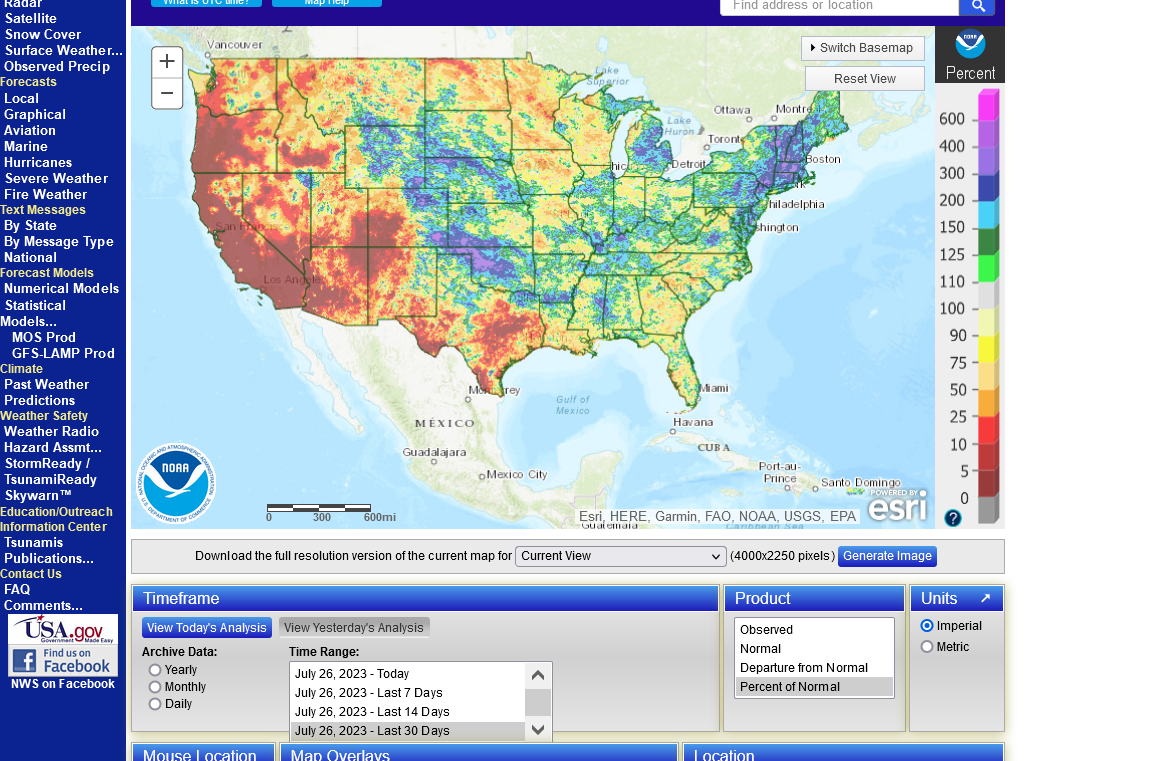
Soilmoisture anomaly:
These maps sometimes take a day to catch up to incorporate the latest data(the bottom map is only updated once a week).
https://www.cpc.ncep.noaa.gov/products/Soilmst_Monitoring/US/Soilmst/Soilmst.shtml#
![]()


++++++++++++++++++++++++++++
Updated daily below:
https://mrcc.purdue.edu/cliwatch/watch.htm#curMonths

Here's the tv show that aired on Wednesday.
It was posted on July 27, so I think you may need to scroll down to July 27.
The 2 segments featuring me start just before the 22 minute mark.