KEY EVENTS TO WATCH FOR:
Thursday, July 27, 2023
8:30 AM ET. U.S. Weekly Export Sales
8:30 AM ET. Unemployment Insurance Weekly Claims Report - Initial Claims
Jobless Claims
Jobless Claims, Net Chg
Continuing Claims
Continuing Claims, Net Chg
8:30 AM ET. June Advance Report on Durable Goods
Durable Goods-SA, M/M% (previous +1.7%)
Dur Goods, Ex-Defense, M/M% (previous +3%)
Dur Goods, Ex-Transport, M/M% (previous +0.6%)
Orders: Cap Gds, Non-Def, Ex-Air, M/M% (previous +0.7%)
Shipmnts: Cap Gds, Non-Def, Ex-Air, M/M% (previous +0.2%)
8:30 AM ET. 2nd Quarter Advance estimate GDP
Annual Rate, Q/Q% (previous +2.0%)
Chain-Weighted Price Idx, Q/Q% (previous +4.1%)
PCE Price Idx, Q/Q% (previous +4.1%)
Purchase Price Idx, Q/Q%
Real Final Sales 1st Est, Q/Q%
Core PCE Price Idx, Q/Q%
Personal Consumption, Q/Q% (previous +4.2%)
8:30 AM ET. June Advance Economic Indicators Report
10:00 AM ET. June Pending Home Sales Index
Pending Home Sales (previous 76.5)
Pending Home Sales Idx, M/M% (previous -2.7%)
Pending Home Sales Idx , Y/Y% (previous -22.2%)
10:30 AM ET. EIA Weekly Natural Gas Storage Report
Working Gas In Storage (Cbf)
Working Gas In Storage, Net Chg (Cbf)
11:00 AM ET. July Federal Reserve Bank of Kansas City Survey of Tenth District Manufacturing
Mfg Activity Idx (previous -10)
6-Mo Exp Prod Idx (previous 15)
Mfg Composite Idx (previous -12)
6-Mo Exp Composite Idx (previous -2)
4:30 PM ET. Federal Discount Window Borrowings
4:30 PM ET. Foreign Central Bank Holdings
Friday, July 28, 2023
8:30 AM ET. June Personal Income and Outlays
Personal Income, M/M% (previous +0.4%)
Consumer Spending, M/M% (previous +0.1%)
PCE Price Idx, M/M% (previous +0.1%)
PCE Price Idx, Y/Y% (previous +3.8%)
PCE Core Price Idx, M/M% (previous +0.3%)
PCE Core Price Idx, Y/Y% (previous +4.6%)
8:30 AM ET. 2nd Quarter Employment Cost Index
ECI, Q/Q% (previous +1.2%)
ECI, Y/Y% (previous +4.8%)
10:00 AM ET. July University of Michigan Survey of Consumers - final
End-Mo Sentiment Idx (previous 64.4)
End-Mo Expectations Idx (previous 61.5)
12-Month Inflation Forecast (previous 3.3%)
5-Year Inflation Forecast (previous 3.0%)
End-Mo Current Idx (previous 69.0)
3:00 PM ET. June Agricultural Prices
Farm Prices, M/M% (previous -2.8%)
The STOCK INDEXES? http://quotes.ino.com/ex?changes/?c=indexes
The Dow closed slightly higher on Wednesday as it extends the rally off July's low. The high-range close sets the stage for a slightly higher opening when Thursday's day session begins trading. Stochastics and the RSI are overbought but remain neutral to bullish signaling that sideways to higher prices are possible near-term. If the Dow extends the rally off July's low, the February-2022 high crossing at 35,824.28 is the next upside target. Closes below the 20-day moving average crossing at 34,577.44 would signal that a short-term top has been posted. First resistance is the April - 2022 high crossing at 35,492.22. Second resistance is the February-2022 high crossing at 35,824.28. First support is the 10-day moving average crossing at 35,024.87. Second support is the 20-day moving average crossing at 34,577.44.
The September NASDAQ 100 closed lower on Wednesday. The low-range close sets the stage for a steady to lower opening when Thursday's night session begins trading. Stochastics and the RSI are neutral to bearish signaling sideways to lower prices are possible. Closes below the 20-day moving average crossing at 15,486.34 would confirm that a short-term top has been posted while opening the door for additional weakness. If September renews this year's rally, the December-2021 high on the weekly continuation chart crossing at 16,659.50 is the next upside target. First resistance is last-Wednesday's high crossing at 16,062.75. Second resistance is the December-2021 high on the weekly continuation chart crossing at 16,659.50. First support is the 20-day moving average crossing at 15,486.34. Second support is the 50-day moving average crossing at 14,951.58.
The September S&P 500 closed slightly lower on Wednesday. The low-range close sets the stage for a steady to lower opening when Thursday's night session begins trading. Stochastics and the RSI are overbought, diverging but remain neutral to bullish signaling that sideways to higher prices are possible near-term. If September extends the rally off March's low, the 87% retracement level of the 2022 decline on the weekly chart crossing at 4639.07 is the next upside target. Closes below the 20-day moving average crossing at 4516.95 would confirm that a short-term top has been posted. First resistance is last-Wednesday's high crossing at 4609.25. Second resistance is the 87% retracement level of the 2022 decline on the weekly chart crossing at 4639.07. First support is the 10-day moving average crossing at 4571.40. Second support is the 20-day moving average crossing at 4516.95.
INTEREST RATES? http://quotes.ino.com/ex?changes/?c=interest ""
September T-bonds closed up 17/32's at 126-02.
September T-bonds closed higher on Wednesday. The high-range close sets the stage for a steady to higher opening when Thursday's day session begins trading. Stochastics and the RSI are neutral to bearish signaling that sideways to lower prices are possible near-term. If September extends the decline off last-Wednesday's high, July's low crossing at 122-30 is the next downside target.If September renews the rally off July's low, the 50% retracement level of the April-July decline crossing at 128-21 is the next upside target. First resistance is the 50% retracement level of the April-July decline crossing at 128-21. Second resistance is the June high crossing at 129-16. First support is Tuesday's low crossing at 125-10. Second support is July's low crossing at 122-30.
September T-notes closed up 140-pts. at 112.015.
September T-notes closed higher on Wednesday. The low-range close sets the stage for a steady to slightly higher opening when Thursday's day session begins trading. Stochastics and the RSI are neutral to bearish signaling that sideways to lower prices are possible near-term. If September extends this week's decline, July's low crossing at 110.050 is the next downside target. If September renews the rally off the July 6th low, the 50-day moving average crossing at 113.038 would signal that a short-term low has been posted. First resistance is the 50-day moving average crossing at 113.038. Second resistance is the 50% retracement level of the May-July decline crossing at 113.313. First support is Tuesday's low crossing at 111.175. Second support is July's low crossing at 110.050.
ENERGY MARKETS? http://quotes.ino.com/ex?changes/?c=energy ""
September crude oil posted an inside day with a lower close on Wednesday as it consolidates some of the rally off June's low. The low-range close sets the stage for a steady to lower opening when Thursday's day session begins. Stochastics and the RSI are overbought but remain neutral to bullish signaling that sideways to higher prices are possible near-term. If September extends the rally off June's low, April's high crossing at $81.44 is the next upside target. Closes below the 20-day moving average crossing at $74.41 would signal that a short-term top has been posted. First resistance the 87% retracement level of the April-May decline crossing at $79.23. Second resistance is April's high crossing at $81.44. First support is the 20-day moving average crossing at $74.41. Second support is the 50-day moving average crossing at $72.25.
September heating oil closed higher on Wednesday as it extended the rally off May's low. The high-range close sets the stage for a steady to higher opening when Thursday's day trading session begins. Stochastics and the RSI are overbought but remain neutral to bullish signaling that sideways to higher prices are possible near-term. If September extends the rally off May's low, the 62% retracement level of the 2022-2023 decline crossing at 2.8561 is the next upside target. Closes below the 20-day moving average crossing at 2.5778 would signal that a short-term top has been posted. First resistance is the 62% retracement level of the 2022-2023 decline crossing at 2.8561. Second resistance is the 75% retracement level of the 2022-2023 decline crossing at 3.0002. First support is the 10-day moving average crossing at 2.6747. Second support the 20-day moving average crossing at 2.5778.
September unleaded gas closed higher on Wednesday. The high-range close sets the stage for a steady to higher opening when Thursday's day session begins trading. Stochastics and the RSI are overbought but remain neutral to bullish signaling that sideways to higher prices are possible near-term. If September extends the rally off the June 23rd low, the October-2022 high on the weekly continuation chart crossing at 3.0221 is the next upside target. Closes below the 20-day moving average crossing at 2.5864 would confirm that a short-term top has been posted. First resistance is Monday's high crossing at 2.8867. Second resistance is the October-2022 high on the weekly continuation chart crossing at 3.0221. First support is the 10-day moving average crossing at 2.6996. Second support is the 20-day moving average crossing at 2.5864.
September Henry natural gas closed lower on Wednesday as it consolidates above the 20-day moving average crossing at 2.644. The low-range close sets the stage for a steady to lower opening when Thursday's day session begins trading. Stochastics and the RSI are neutral to bullish signaling that sideways to higher prices are possible near-term.If September extends the rally off the July 17th low, June's high crossing at 2.911 is the next upside target. First resistance is the June high crossing at 2.911. Second resistance is the 25% retracement level of the 2022-2023 decline crossing at 3.193. First support is the July 17th low crossing at 2.477. Second support is the June 1st low crossing at 2.249.
CURRENCIES? http://quotes.ino.com/ex?changes/?c=currencies ""
The September Dollar closed lower on Wednesday as it consolidates some of the rally off July's low. The low-range close sets the stage for a steady to lower opening when Thursday's session begins trading. Stochastics and the RSI are neutral to bullish signaling that sideways to higher prices are possible near-term. Closes above the 20-day moving average crossing at 101.237 would confirm that a short-term low has been posted. Closes below the 10-day moving average crossing at 100.276 would signal that a short-term top has been posted. First resistance is Tuesday's high crossing at 101.395. Second resistance is the 50-day moving average crossing at 102.229. First support is the 10-day moving average crossing at 100.276. Second support is July's low crossing at 99.220.
The September Euro closed slightly higher on Wednesday as it consolidates some of the decline off last-Tuesday's high. The mid-range close sets the stage for a steady to higher opening when Thursday's day session begins trading. Stochastics and the RSI remain neutral to bearish signaling that sideways to lower prices are possible near-term. If September extends the decline off July's high, the 50-day moving average crossing at $1.09586 is the next downside target. Closes above the 10-day moving average crossing at 1.11889 would temper the near-term bearish outlook. First resistance is July's high crossing at $1.13105. Second resistance is the March 30th high crossing at 1.15190. First support is Tuesday's low crossing at 1.10510 Second support is the 50-day moving average crossing at $1.09586.
The September British Pound closed slightly higher on Thursday as it consolidates some of the decline off the July 14th high. The mid-range close sets the stage for a steady to higher opening when Thursday's day session begins trading. Stochastics and the RSI are neutral to bearish signaling sideways to lower prices are possible near-term. If September extends the aforementioned decline, the 50-day moving average crossing at 1.2685 is the next downside target. Closes above the 10-day moving average crossing at 1.2966 would signal that a short-term low has been posted. First resistance is the 10-day moving average crossing at 1.2966. Second resistance is the July 14th high crossing at 1.3146. First support is Monday's low crossing at 1.2801. Second support is the 50-day moving average crossing at 1.2686.
The September Swiss Franc closed slightly higher on Wednesday as it consolidated some of the decline off July's high. The mid-range close sets the stage for a steady to higher opening when Thursday's day session begins trading. Stochastics and the RSI are neutral to bearish signaling that sideways to lower prices are possible near-term. If September extends the decline off last-week's high. the 20-day moving average crossing at 1.14928 is the next downside target. If September renews the rally off May's low, the January 2019 high crossing at 1.18680 is the next upside target. First resistance is the July 18th high crossing at 1.17650. Second resistance is the January 2019 high crossing at 1.18680. First support is Tuesday's low crossing at 1.15605. Second support is the 20-day moving average crossing at 1.14927.
The September Canadian Dollar closed lower on Wednesday. The low-range close sets the stage for a steady to lower opening when Thursday's day session begins trading. Stochastics and the RSI are turning neutral to bearish signaling that sideways to lower prices are possible near-term. Closes below last-Tuesday's low crossing at 75.57 would confirm that a short-term top has been posted while opening the door for additional weakness near-term. If September renews the rally off the January 7th low, the September 12th 2022 high crossing at 77.11 is the next upside target. First resistance is the 38% retracement level of the 2021-2022 decline crossing at 76.28. Second resistance is the September 12th high crossing at 77.11. First support is last-Tuesday's low crossing at 75.57. Second support is the 50-day moving average crossing at 75.19.
The September Japanese Yen closed higher on Wednesday as it consolidated some of the decline off July's high. The high-range close sets the stage for a steady to higher opening when Thursday’s day session begins trading. Stochastics and the RSI are turning neutral to bullish signaling that sideways to higher prices are possible near-term. If September resumes the rally off June's low, the 38% retracement level of the January-June decline crossing at 0.074017 is the next upside target. If September extends the decline off July's high, June's low crossing at 0.069755 is the next downside target. First resistance is July's high crossing at 0.073585. Second resistance is the 38% retracement level of the January-June decline crossing at 0.074017 is the next upside target. First support is last-Friday's low crossing at 0.071065. Second support is June's low crossing at 0.069755.
PRECIOUS METALS? http://quotes.ino.com/ex?changes/?c=metals ""
August gold closed higher on Wednesday as it consolidates some of the rally off June's low. The high-range close sets the stage for a steady to higher opening when Thursday's day session begins trading. Stochastics and the RSI are turning neutral to bullish signaling that sideways to higher prices are possible near-term. If August renews the rally off June's low, June's high crossing at $2000.70 is the next upside target. Closes below the 20-day moving average crossing at $1949.40 would signal that a short-term top has been posted. First resistance is June's high crossing at $2000.70. Second resistance is the 62% retracement level of the May-June decline crossing at $2025.20. First support is the 20-day moving average crossing at $1949.40. Second support is June's low crossing at $1911.40.
September silver closed higher on Wednesday and the high-range close sets the stage for a steady to higher opening when Thursday's day session begins trading. Stochastics and the RSI are turning neutral to bullish signaling that sideways to higher prices are possible near-term. If July renews the rally off June's low, the 75% retracement level of the April-June decline crossing at 25.561 is the next upside target. Closes below the 50-day moving average crossing at 23.932 would signal that a short-term top has been posted. First resistance is last-Thursday's high crossing at 25.475. Second resistance is the 75% retracement level of the April-June decline crossing at 25.561. First support is the 20-day moving average crossing at 24.129. Second support is the 50-day moving average crossing at 23.932.
September copper posted an inside day with a lower close on Wednesday. The mid-range close sets the stage for a steady to lower opening when Thursday's day session begins trading. Stochastics and the RSI have turned neutral to bullish signaling that sideways to higher prices are possible near-term. If September extends this week's rally, July's high crossing at 3.9540 is the next upside target. Closes below the 50-day moving average crossing at 3.7880 would signal that a short-term top has been posted. First resistance is July's high crossing at 3.9540. Second resistance is June's high crossing at 3.9640. First support is the 50-day moving average crossing at 3.7880. Second support is the June 29th low crossing at 3.6830.
GRAINS? http://quotes.ino.com/ex?changes/?c=grains "
December Corn closed down $0.17-cents at $5.48 1/4.
December corn closed sharply lower on Wednesday due in large part to today's sharp sell off in the wheat market. The low-range close sets the stage for a steady to lower opening when Thursday's night session begins trading. Stochastics and the RSI are overbought but remain neutral to bullish signaling that sideways to higher prices are possible near-term. If December extends the rally off July's low, the 75% retracement level of the June-July decline crossing at $5.92 3/4 is the next upside target. Closes below last-Friday's low crossing at $5.31 1/4 would confirm that a short-term top has been posted. First resistance is the 62% retracement level of the June-July decline crossing at $5.73. Second resistance is the 75% retracement level of the June-July decline crossing at $5.92 3/4. First support is last-Friday's low crossing at $5.31 1/4. Second support is the 20-day moving average crossing at $5.20 1/4.
September wheat closed down $0.40 1/4-cents at $7.20.
September wheat closed sharply lower on Wednesday as it consolidated some of the rally off July's low. The low-range close sets the stage for a steady to lower opening when Thursday's day session begins trading. Stochastics and the RSI are overbought but remain neutral to bullish signaling that sideways to lower prices are possible near-term. If September extends the rally off July's low, the 38% retracement level of the 2022-2023 decline crossing at $7.95 1/4 is the next upside target. Closes below the 50-day moving average crossing at $6.65 would confirm that a short-term top has been posted. First resistance is Tuesday's high crossing at $7.77 1/4. Second resistance is 38% retracement level of the 2022-2023 decline crossing at $7.95 1/4. First support is the 10-day moving average crossing at $7.01 1/2. Second support is the 20-day moving average crossing at $6.78 1/4.
September Kansas City Wheat closed down $0.47 1/2-cents at $8.65 1/4.
September Kansas City wheat closed sharply lower on Wednesday as it erased most of Monday's rally. The low-range close sets the stage for a steady to lower opening when Thursday's day session begins trading. Stochastics and the RSI are overbought and are turning neutral to bearish signaling that sideways to lower prices are possible near-term. Closes below the 50-day moving average crossing at $8.29 would confirm that a short-term top has been posted. If September extends the rally off July's low, the 50% retracement level of the 2022-2023 decline crossing at $9.46 3/4 is the next upside target. First resistance is Tuesday's high crossing at $9.29 3/4. Second resistance is the 50% retracement level of the 2022-2023 decline crossing at $9.46 3/4. First support is the 10-day moving average crossing at $8.57 1/4. Second support is the 20-day moving average crossing at $8.35 3/4.
September Minneapolis wheat closed down $0.36 1/4-cents crossing at $8.95 3/4.
September Minneapolis wheat closed sharply lower on Wednesday. The low-range close sets the stage for a steady to lower opening when Thursday's day session begins trading. Stochastics and the RSI are overbought and are turning neutral to bearish signaling that sideways to lower prices are possible near-term. Closes below the 20-day moving average crossing at $8.67 1/2 would confirm that a short-term top has been posted. If September extends the rally off July's low, the 50% retracement level of the 2022-2023 decline crossing at $9.60 3/4 is the next upside target. First resistance is the 50% retracement level of the 2022-2023 decline crossing at $9.60 3/4. Second resistance is the 62% retracement level of the 2022-2023 decline crossing at $10.05 1/2 is the next upside target. First support is the 20-day moving average crossing at $8.67 1/2. Second support is the 50-day moving average crossing at $8.44 3/4.
SOYBEAN COMPLEX? http://quotes.ino.com/ex?changes/?c=grains "
November soybeans closed unchanged at $14.20.
November soybeans posted an inside day with a steady close on Wednesday as it consolidated some of the rally off May's low. The high-range close sets the stage for a steady to higher opening when Thursday's day session begins trading. Stochastics and the RSI are overbought, diverging but remain neutral to bullish signaling that sideways to higher prices are possible near-term. If November extends the rally off May's low, the April-2022 high crossing at $14.48 1/4 is the next upside target. Closes below the 20-day moving average crossing at $13.63 1/4 would signal that a short-term top has been posted. First resistance is Monday's high crossing at $14.35. Second resistance is the April-2022 high crossing at $14.48 1/4. First support is the 10-day moving average crossing at $13.99 1/4. Second support is the 20-day moving average crossing at $13.63 1/4.
December soybean meal closed up $2.50 at $418.60.
December soybean meal closed higher on Wednesday. The mid-range close sets the stage for a steady to higher opening when Thursday's day session begins trading. Stochastics and the RSI have turned neutral to bullish signaling that sideways to higher prices are possible near-term. If December extends this month's rally, the 87% retracement level of the March-May decline crossing at $428.00 is the next upside target. Closes below the 20-day moving average crossing at $400.40 would signal that a short-term top has been posted. First resistance is the 75% retracement level of the March-May decline crossing at $418.80. Second resistance is the 87% retracement level of the March-May decline crossing at $428.00. First support is the 20-day moving average crossing at $400.40. Second support is the July 7th low crossing at $384.70.
December soybean oil closed down 107-pts. at 63.19.
December soybean oil closed lower on Wednesday as it consolidated some of the rally off May's low.The low-range close sets the stage for a steady to lower opening when Thursday's day session begins trading. Stochastics and the RSI are overbought and are turning neutral to bearish signaling that sideways to lower prices are possible near-term. Closes below the 20-day moving average crossing at 60.49 would signal that a short-term top has been posted. If December extends the rally off May's low, the 87% retracement level of the 2022-2023 decline crossing at 68.81 is the next upside target. First resistance is Monday's high crossing at 65.58. Second resistance is the 87% retracement level of the 2022-2023 decline crossing at 68.81. First support is the 20-day moving average crossing at 60.49. Second support is the June 29th low crossing at 54.67.
LIVESTOCKhttp://quotes.ino.com/exchanges/?c=livestock
August hogs closed down $0.13 at $101.53.
August hogs closed slightly lower on Wednesday as it extends this week's trading range. The high-range close sets the stage for a steady to slightly higher opening when Thursday's day session begins trading. Stochastics and the RSI are overbought but remain neutral to bullish signaling that sideways to higher prices are possible near-term. If August extends the rally off May's low, the 87% retracement level of the 2022-2023 decline crossing at $104.40 is the next upside target. Closes below the 20-day moving average crossing at $96.67 would signal that a short-term top has been posted. First resistance is today's high crossing at $102.00. Second resistance is the 87% retracement level of the 2022-2023 decline crossing at $104.40. First support is the 10-day moving average crossing at $98.63. Second support is the 20-day moving average crossing at $96.67.
August cattle closed up $0.15 at $178.45.
August cattle closed slightly higher on Wednesday. The mid-range close sets the stage for a steady to slightly higher opening on Thursday. Stochastics and the RSI are neutral to bearish signaling that sideways to lower prices are possible near-term. Closes below the 20-day moving average crossing at $175.24 would signal that a short-term top has been posted. If August renews this year's rally into uncharted territory, upside targets will be hard to project. First resistance is last-Thursday's high crossing at $183.98. Second resistance is unknown. First support is the 20-day moving average crossing at $175.24. Second support is the 50-day moving average crossing at $172.51.
August Feeder cattle closed up $0.68 at $243.90.
August Feeder cattle posted an inside day with a higher close on Wednesday as it extends the trading range of the past three-weeks. The mid-range close sets the stage for a steady to higher opening when Thursday's day session begins trading. Stochastics and the RSI remain neutral to bearish signaling that sideways to lower prices are possible near-term. Closes below the July 6th low crossing at $240.80 would mark a downside breakout of the aforementioned trading range. If August renews the rally off June's low into uncharted territory, upside targets will be hard to project. First resistance is July's high crossing at $251.30. Second resistance is unknown. First support is the July 6th low crossing at $240.80. Second support is the 50-day moving average crossing at $239.73.
FOOD & FIBERhttp://quotes.ino.com/ex changes/?c=food
September coffee closed higher on Wednesday. The high-range close sets the stage for a steady to higher opening on Thursday. Stochastics and the RSI are neutral to bullish signaling sideways to higher prices are possible near-term. Closes above Monday's high crossing at $16.55 would signal that a short-term low has been posted. If September resumes the decline off June's high, the 87% retracement level of the January-April rally crossing at $15.20 is the next downside target. First resistance is Monday's high crossing at $16.55. Second resistance is the June 27th high crossing at $16.79. First support is last-Monday's low crossing at $15.51. Second support is the 87% retracement level of the January-April rally crossing at $15.20.
September cocoa closed sharply higher on Wednesday as it extends this year's rally. The high-range close sets the stage for a steady to higher opening on Thursday. Stochastics and the RSI are overbought but remain neutral to bullish signaling that sideways to higher prices are possible near-term. If September extends the rally off March's low, monthly resistance crossing at 37.75 is the next upside target. Closes below the July 13th low crossing at 32.60 would confirm that a short-term top has been posted.
October sugar closed lower on Wednesday as it consolidates some of the rally off June's low. The low-range close sets the stage for a steady to lower opening on Thursday. Stochastics and the RSI are overbought and are turning neutral to bearish signaling that sideways to lower prices are possible near-term. Closes below the 20-day moving average crossing at 23.79 would signal that a short-term top has been posted. If October extends the rally off June's low, June's high crossing at 26.19 is the next upside target.
December cotton closed higher for the eighth-day in a row on Wednesday as it extends the rally off June's low. The high-range close sets the stage for a steady to higher opening on Thursday. Stochastics and the RSI are overbought but remain neutral to bullish signaling sideways to higher prices are possible near-term. If December extends the rally off June's low, the 75% retracement level of the May-July decline crossing at 91.29 is the next upside target. Closes below the 20-day moving average crossing at 82.12 would signal that a short-term top has been posted.
Thanks, tallpine!
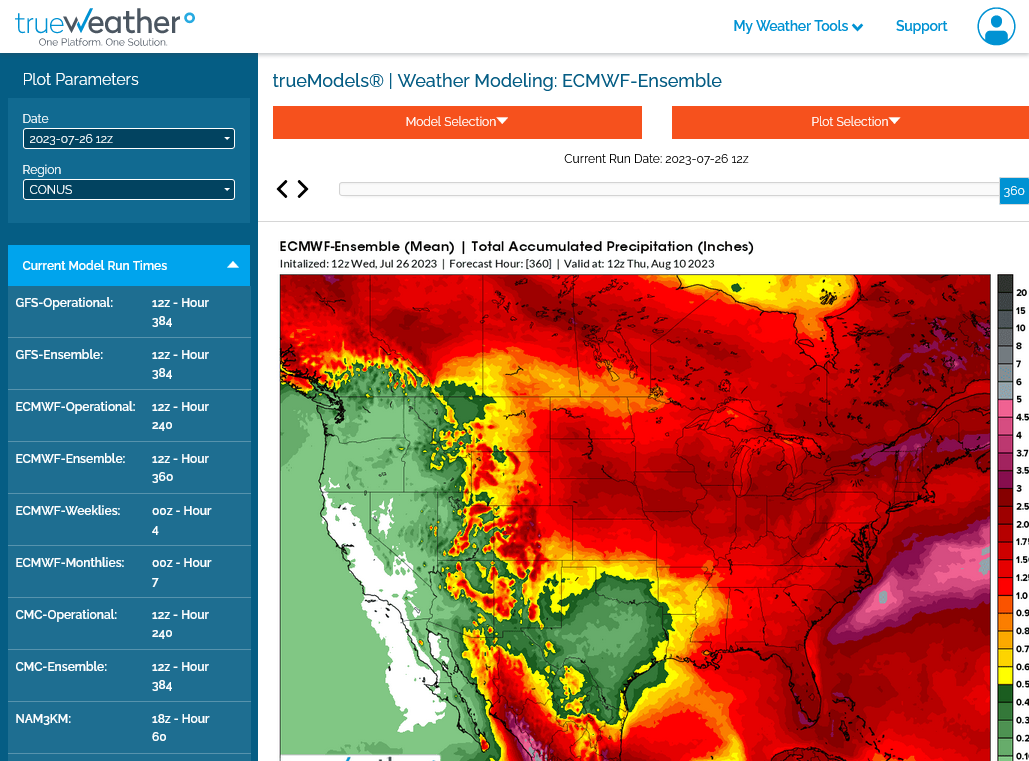
The difference in rain between the wet EE and dry GEFS is the greatest I ever remember for this time of year. Usually they converge but this week, they've been diverging.
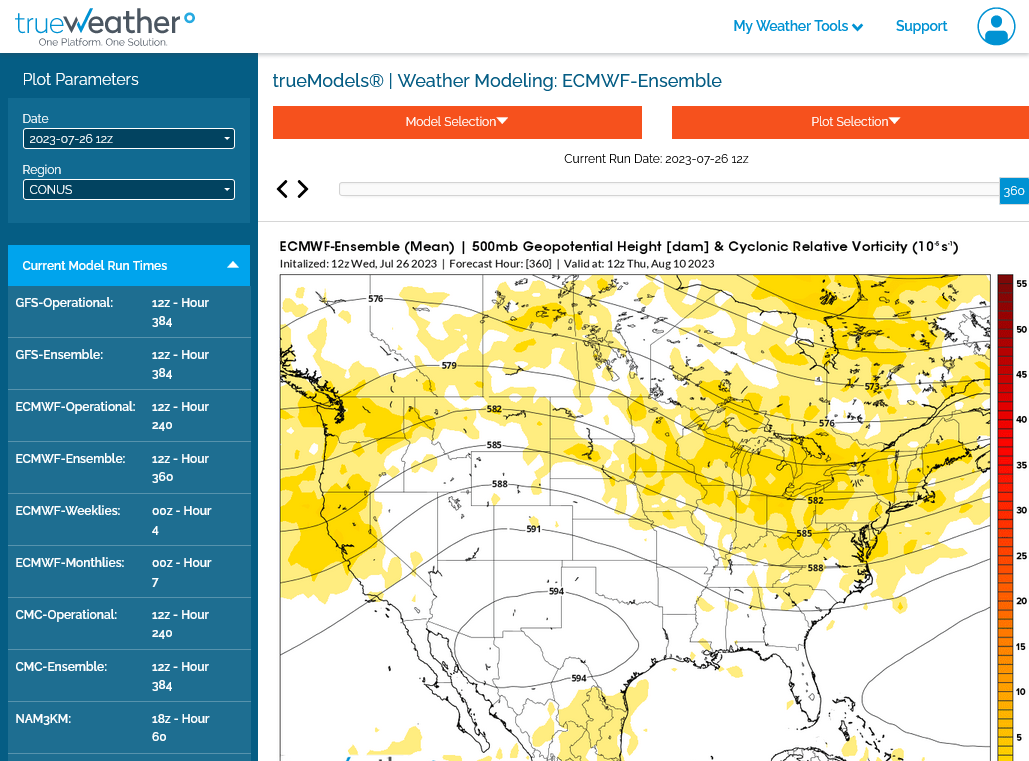
They do agree with troughing and the EE has a ton of vorticity in the northwest flow so I'm leaning in that direction now but point out again that northwest flow is very tricky.
It disappoints a bit more often than it overperforms when it comes to rains but each year is different and you'll bust alot of forecasts if you expect the same thing to happen that you remembered happening before.
1. 12z GEFS drier forecast for 15 days-less than 1 inch northwest belt.
2. 12z EE much wetter forecast- 2 inches of wonderful rains across almost the entire, highest producing areas of the belt-let's hope this is correct
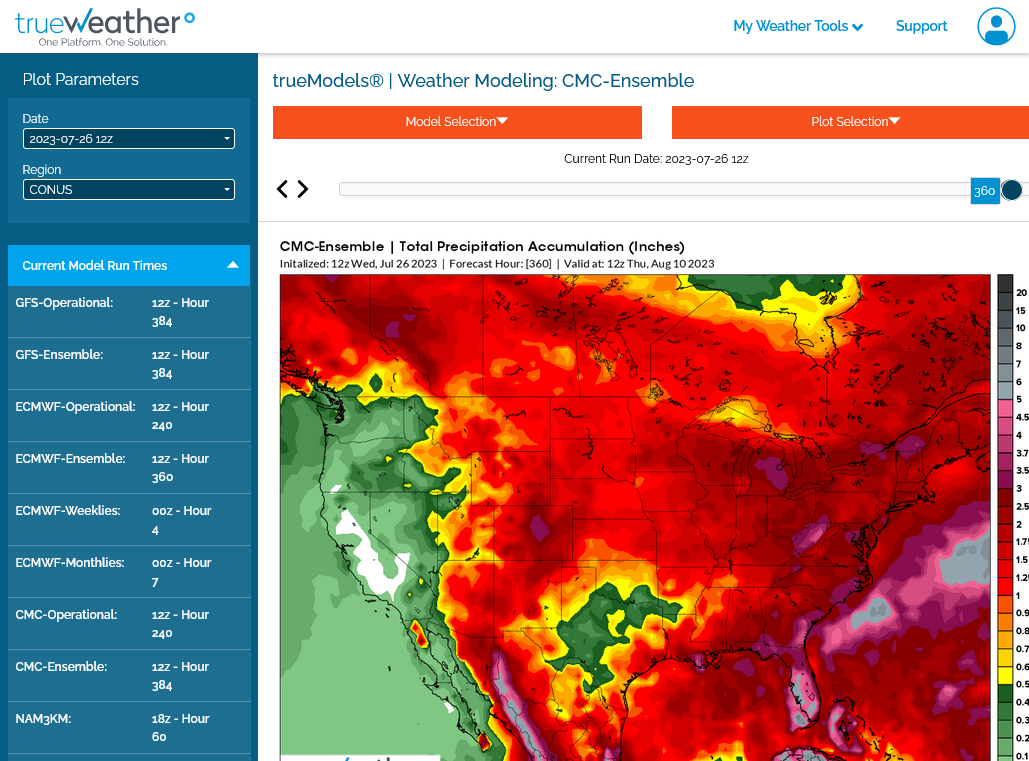
3. Canadian model in the middle but closer to the wetter EE
4. Upper levels EE. All that vorticity would result in numerous perturbations and fronts in the northwest flow......if it verified.

The NWS have the right idea with temps, maybe not cool enough farther west from the Northeast chilly trough.
With regards to rains.............take it with a grain of salt. You saw the models. Extreme uncertainty.
Extended weather.
https://www.cpc.ncep.noaa.gov/products/predictions/610day/ | ||||||||
| 6 to 10 day outlooks | ||||||||
| Click below for information about how to read 6-10 day outlook maps Temperature Precipitation | ||||||||
| Click below for archives of past outlooks (data & graphics), historical analogs to todays forecast, and other formats of the 6-10 day outlooks ArchivesAnalogsLines-Only FormatGIS Data | ||||||||
Temperature Probability | ||||||||
Precipitation Probability | ||||||||
The latest 7 day precip forecasts are below.
Day 1 below:
http://www.wpc.ncep.noaa.gov/qpf/fill_94qwbg.gif?1526306199054

Day 2 below:
http://www.wpc.ncep.noaa.gov/qpf/fill_98qwbg.gif?1528293750112

Day 3 below:
http://www.wpc.ncep.noaa.gov/qpf/fill_99qwbg.gif?1528293842764

Days 4-5 below:
http://www.wpc.ncep.noaa.gov/qpf/95ep48iwbg_fill.gif?1526306162

Days 6-7 below:
http://www.wpc.ncep.noaa.gov/qpf/97ep48iwbg_fill.gif?1526306162

7 Day Total precipitation below:
http://www.wpc.ncep.noaa.govcdx /qpf/p168i.gif?1530796126

All the weather:

