Recent rains. This can help us to guess about crop ratings on Monday. The spots that didn't get much rain last week WILL drop because of the heat. The market dialed that into the price, well BEFORE it happened. Now we dial in upcoming rains.
ADDED: The gap lower last night was a daily AND weekly chart gap lower. Especially powerful technical signal/formation.
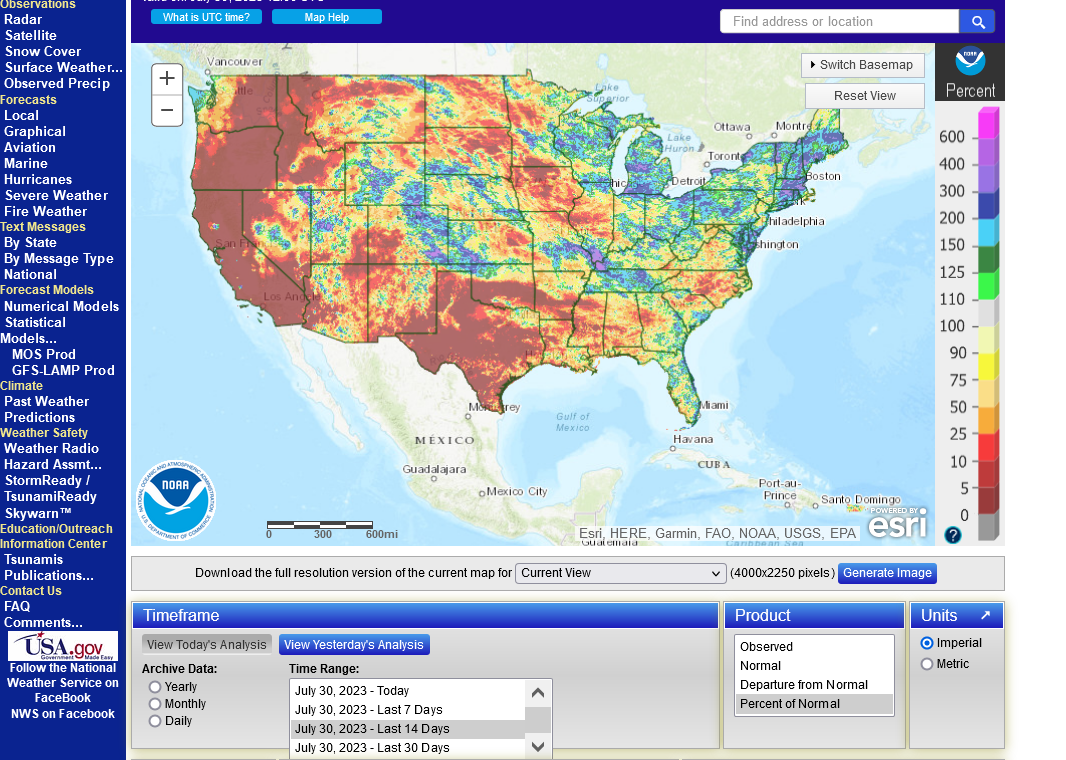
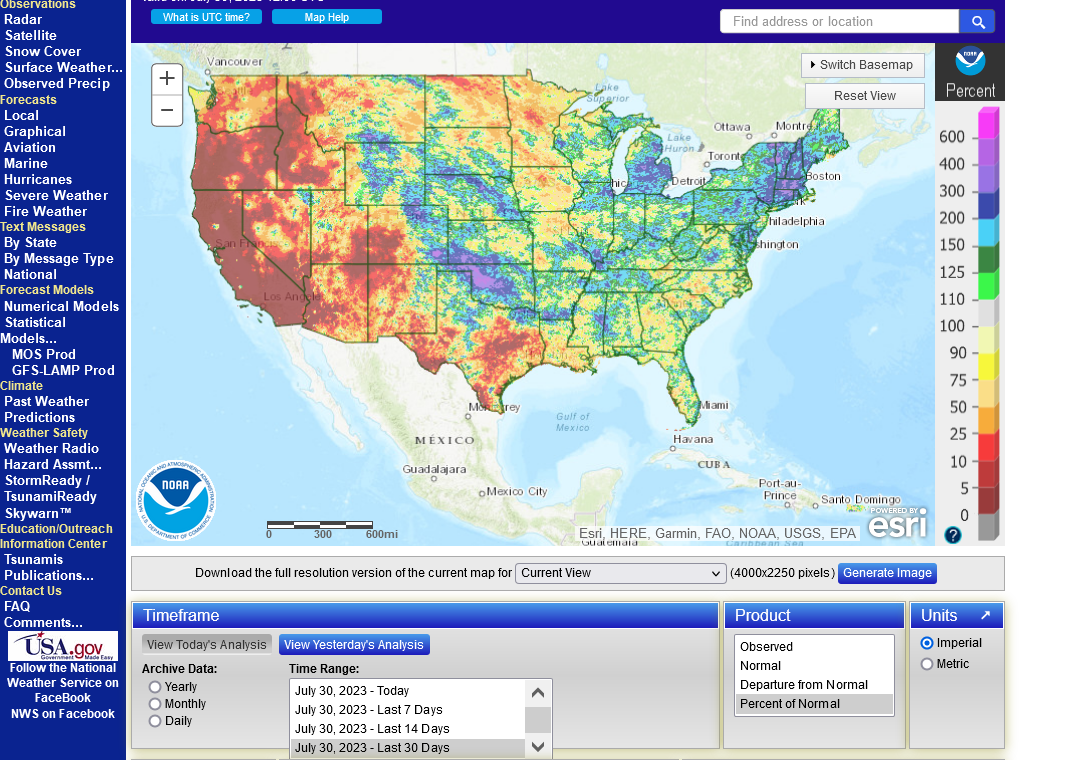
1. The last 7 days vs average
2. The last 14 days vs average
3. The last 30 days vs average
4. Temps vs average last week-HOT! Climatologically, last week is the hottest of the year and we were 2-4+ Deg F. above the average across the entire Midwest. With the dry soils in many places, those spots got worse.

Good thing there's a lot of rain in the forecast for most places.
Soilmoisture anomaly:
These maps sometimes take a day to catch up to incorporate the latest data(the bottom map is only updated once a week).
https://www.cpc.ncep.noaa.gov/products/Soilmst_Monitoring/US/Soilmst/Soilmst.shtml#
![]()


++++++++++++++++++++++++++++
Updated daily below:
https://mrcc.purdue.edu/cliwatch/watch.htm#curMonths

Most of the severe drought in the West has been wiped out!
https://droughtmonitor.unl.edu/
Last week, July 25, 2023
Previous weeks, July 18th and 11th below that.
Drought in the West was mostly wiped out earlier this year.
Huge expansion of drought in the Midwest May/June got better, especially the ECB but still very dry subsurface moisture west of that.


You can get ALL the weather maps, here:
https://www.marketforum.com/forum/topic/83844/
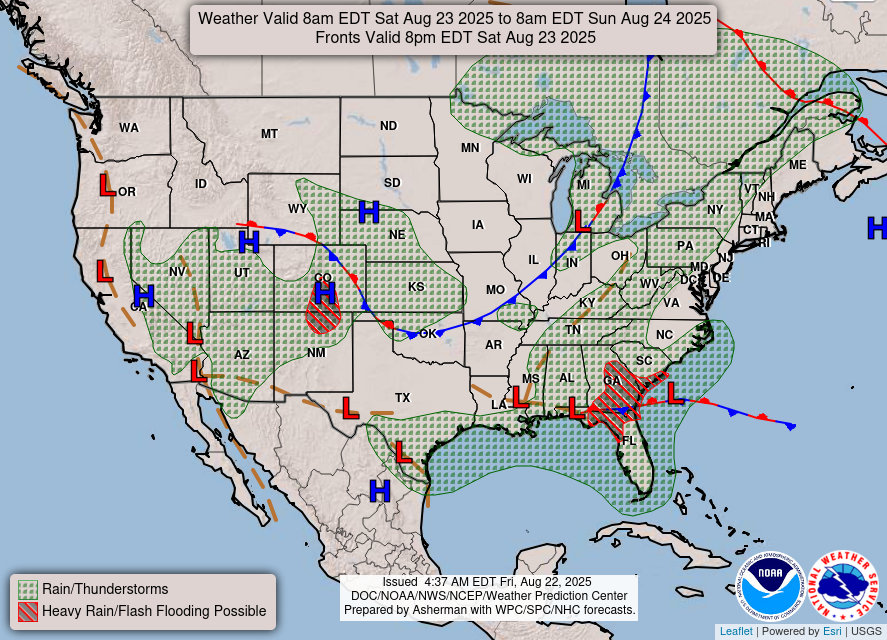
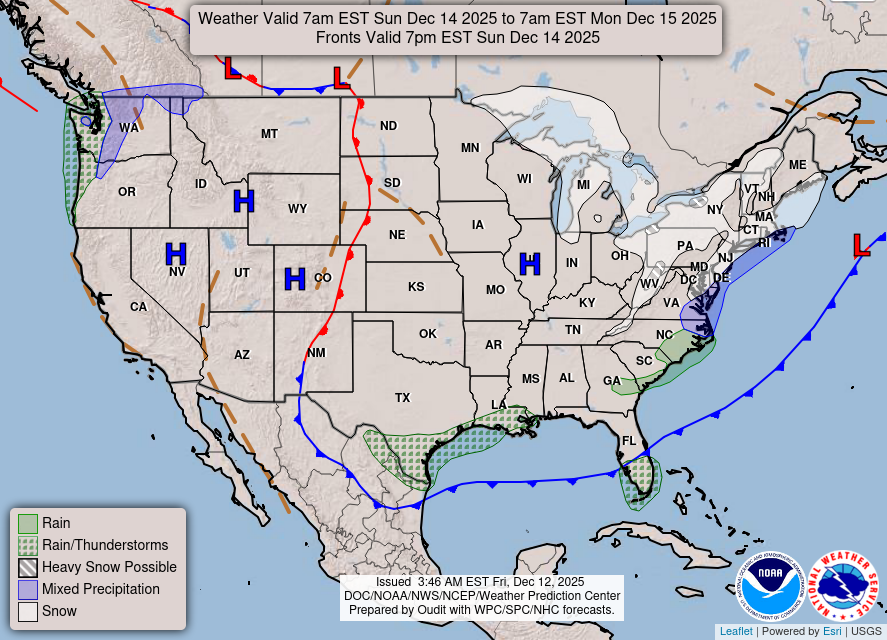
This week. Best rains in the Southern Midwest.
Weather maps now.
In 24 hours and
In 48 hours.
https://www.wpc.ncep.noaa.gov/#

+++++++++++++++++++++++++++++++++++++++++++++++++
Surface Weather maps for days 3-7 below:
https://www.wpc.ncep.noaa.gov/medr/medr.shtml

+++++++++++++++++++++++++++++++++++++++++++
The latest 7 day precip forecasts are below.
Day 1 below:
http://www.wpc.ncep.noaa.gov/qpf/fill_94qwbg.gif?1526306199054

Day 2 below:
http://www.wpc.ncep.noaa.gov/qpf/fill_98qwbg.gif?1528293750112

Day 3 below:
http://www.wpc.ncep.noaa.gov/qpf/fill_99qwbg.gif?1528293842764

Days 4-5 below:
http://www.wpc.ncep.noaa.gov/qpf/95ep48iwbg_fill.gif?1526306162

Days 6-7 below:
http://www.wpc.ncep.noaa.gov/qpf/97ep48iwbg_fill.gif?1526306162

7 Day Total precipitation below:
http://www.wpc.ncep.noaa.govcdx /qpf/p168i.gif?1530796126

NWS extended is extremely bearish:
https://www.cpc.ncep.noaa.gov/products/predictions/610day/ | |||||||||
| 6 to 10 day outlooks | |||||||||
| Click below for information about how to read 6-10 day outlook maps Temperature Precipitation | |||||||||
| Click below for archives of past outlooks (data & graphics), historical analogs to todays forecast, and other formats of the 6-10 day outlooks ArchivesAnalogsLines-Only FormatGIS Data | |||||||||
Temperature Probability | |||||||||
Precipitation Probability | |||||||||
MetMike
Thank you (I think) for the bearish weather update.
The maps do not look that bearish oats and canola. Any thoughts?
tjc,
Why do you think its not bearish for oats?
Canada
Grains continue under pressure from bearish weather after the gap lower last evening.
https://www.marketforum.com/forum/topic/97726/
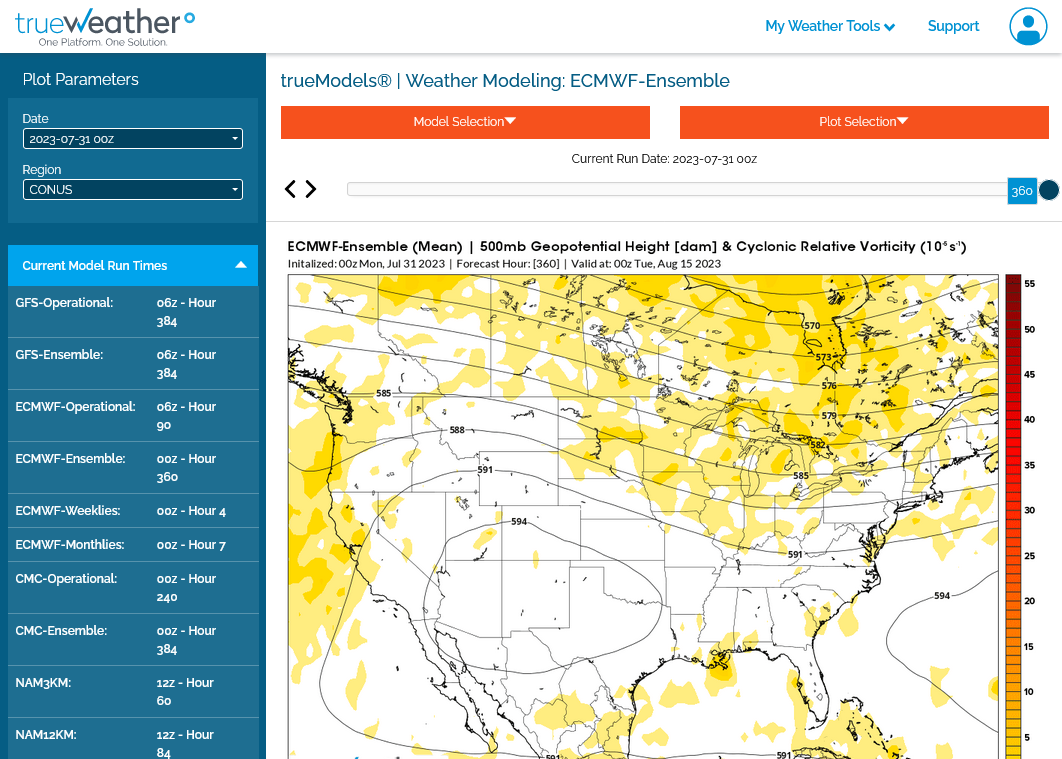
The upcoming pattern will feature a big heat dome in the south, with active perturbations coming around the periphery to dump copious rains in big parts of the Midwest.
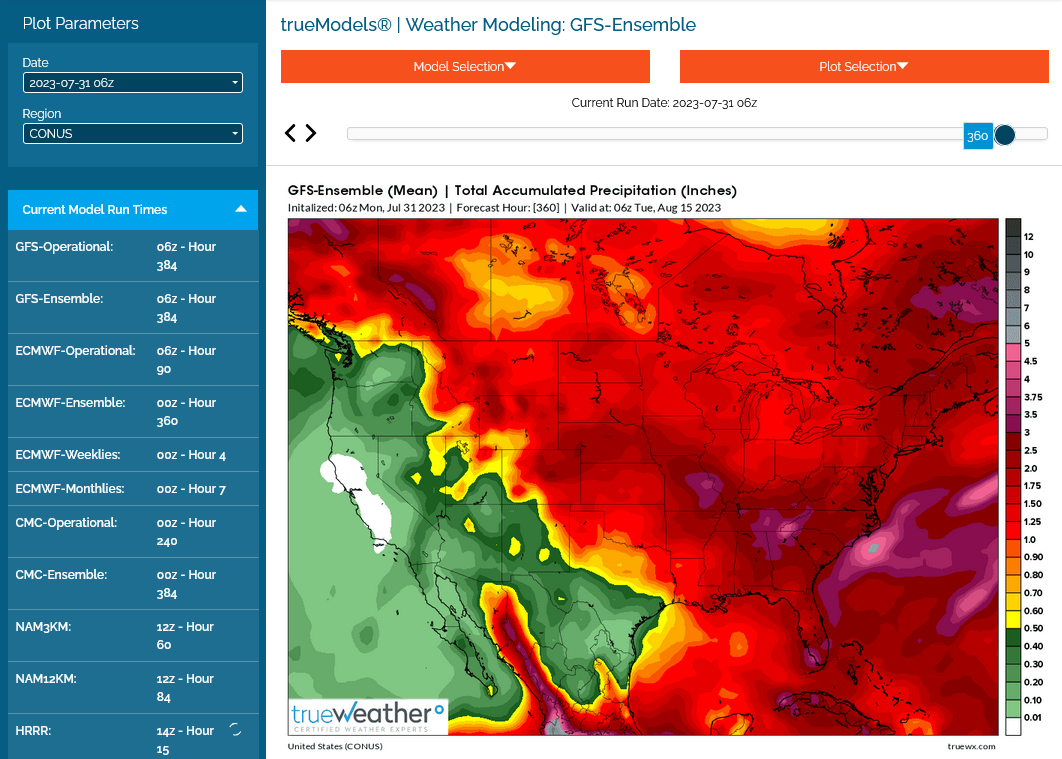
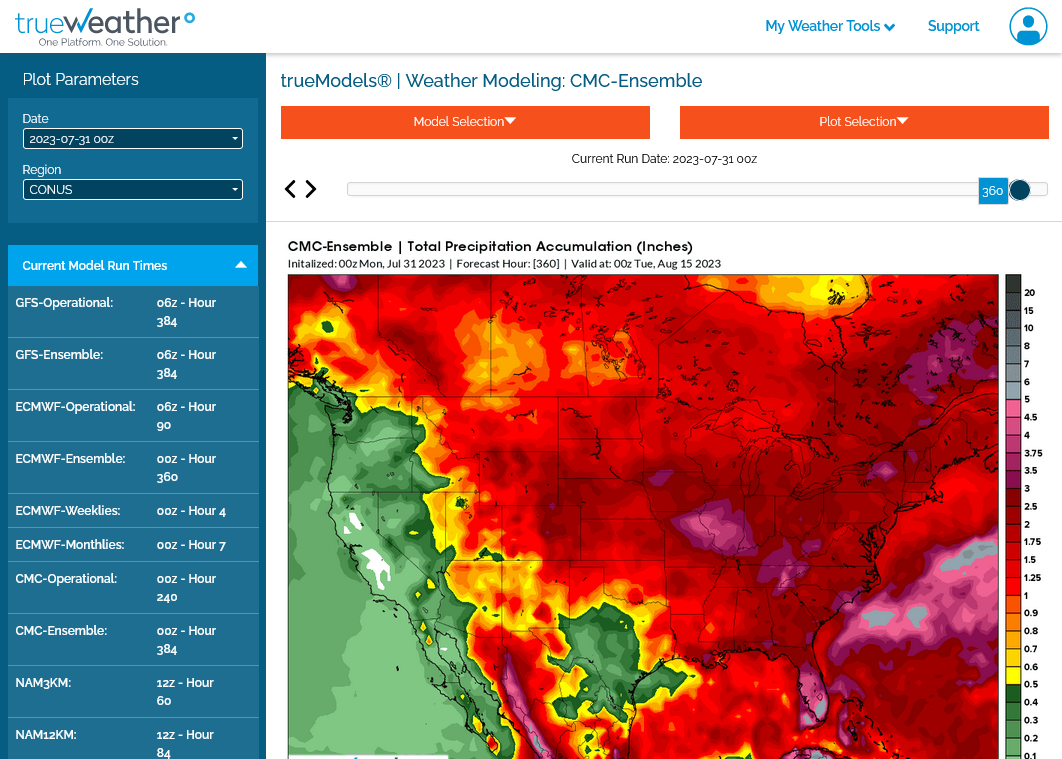
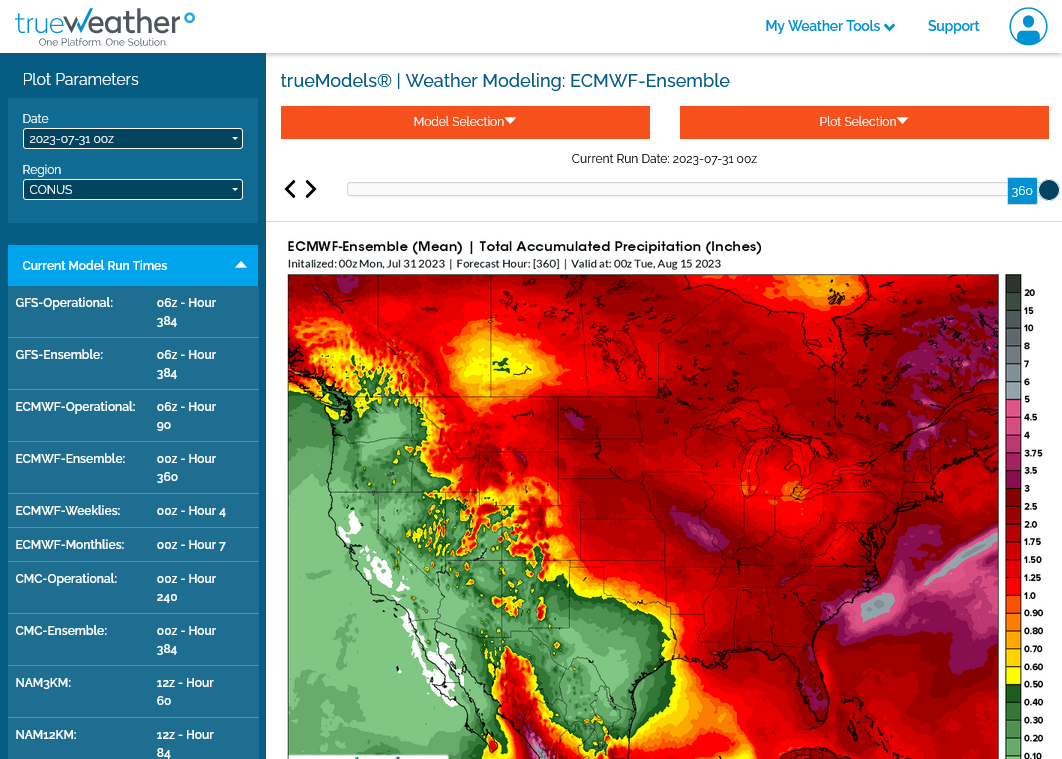
Total rains. Dark reds are 2 inches of rain, which is above average for 2 weeks in this time of year.
1. Last 6z GEFS
2. Last 0z Canadian
3. Last 0z European
4. 500mb European in 2 weeks. There is a Bermuda high trying to build in the Southeast.........moisture pump!
7 Day Total precipitation below:
http://www.wpc.ncep.noaa.govcdx /qpf/p168i.gif?1530796126
There's the chance that the Upper Midwest and Northeast belt will not get that much rain, with them being just outside the periphery of the dome's "ring of fire"
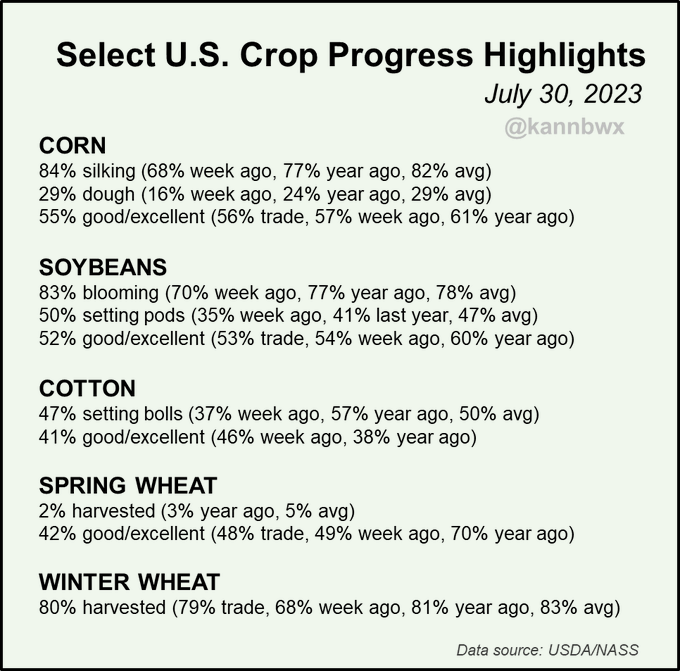
Crop ratings from the USDA. Dropping almost exactly how we expected in the areas that missed rains recently from the charts on the first page above:
https://release.nass.usda.gov/reports/prog3023.txt
Conditions for U.S. #corn and #soybeans fell 2 pts each this week instead of the expected 1 pt, but spring #wheat dropped 7 pts and #cotton fell 5 pts.
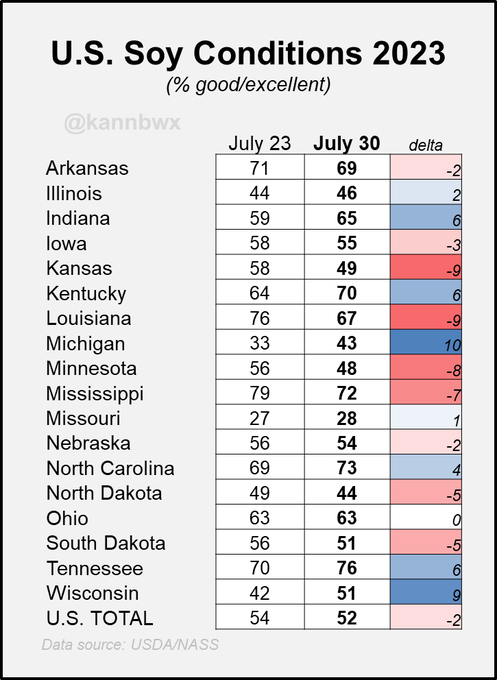
Western state declines offset improvements in #soybean conditions in the eastern U.S. belt, and 52% good/exc nationally is a three-week low. IL beans have risen 5 straight weeks, but Minn and Kansas have now slipped below 50% g/e.
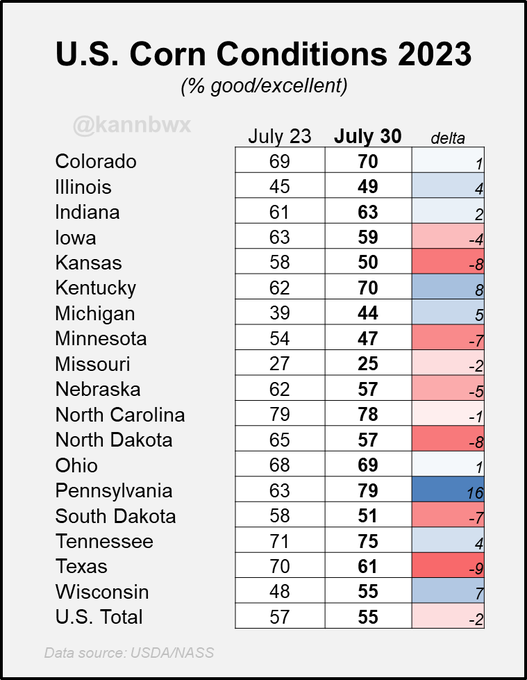
Illinois #corn conditions improved for a 5th consecutive week, but the very hot and dry weather last week stressed crops in the western belt, taking the national rating to a three-week low of 55% good/excellent.
US Crop Conditions Crops rated in good to excellent condition, plus weekly change
Latest updates on tallpines thread


