KEY EVENTS TO WATCH FOR:
Monday, July 31, 2023
9:45 AM ET. July Chicago Business Barometer - ISM-Chicago Business Survey - Chicago PMI
PMI-Adj (previous 41.5)
10:30 AM ET. July Texas Manufacturing Outlook Survey
Business Activity (previous -23.2)
Mfg Production Idx (previous -4.2)
The STOCK INDEXES? http://quotes.ino.com/ex?changes/?c=indexes
The STOCK INDEXES: The September NASDAQ 100 was steady to slightly lower overnight. Overnight trading sets the stage a steady to slightly lower opening when the day session begins trading. Stochastics and the RSI are turning neutral to bullish signaling that sideways to higher prices are possible near-term. If September renews this year's rally, the December-2021 high on the weekly continuation chart crossing at 16,659.50 is the next upside target. Closes below the 20-day moving average crossing at 15,572.85 would confirm that a short-term top has been posted. First resistance is the July 19th high crossing at 16,062.75. Second resistance is the December-2021 high on the weekly continuation chart crossing at 16,659.50. First support is the 20-day moving average crossing at 15,572.85. Second support is the 50-day moving average crossing at 15,076.67.
The September S&P 500 was was steady to slightly higher overnight. Overnight trading sets the stage for a slightly higher opening when the day session begins trading. Stochastics and the RSI are overbought, diverging but remain neutral to bullish signaling that sideways to higher prices are possible near-term. If June extends the rally off March's low, the 87% retracement level of the 2022 decline crossing at 4639.07 is the next upside target. Closes below the 20-day moving average crossing at 4539.32 would confirm that a short-term top has been posted. First resistance is last-Thursday's high crossing at 4634.50. Second resistance is the 87% retracement level of the 2022 decline crossing at 4639.07. First support is the 20-day moving average crossing at 4539.34. Second support is the 50-day moving average crossing at 4420.85.
INTEREST RATES http://quotes.ino.com/ex changes/?c=interest"
INTEREST RATES: September T-bonds was slightly lower overnight and sets the stage for a lower opening when the day session begins trading. Stochastics and the RSI are neutral to bearish signaling that sideways to lower prices are possible near-term. If September extends the decline off July's high, July's low crossing at 122-30 is the next downside target. Closes above the 50-day moving average crossing at 126-21 would signal that a low has been posted. First resistance is the 20-day moving average crossing at 125-17. Second resistance is the 50-day moving average crossing at 126-21. First support is last-Friday's low crossing at 123-09. Second support is July's low crossing at 122-30.
September T-notes were slightly lower overnight and sets the stage for a slightly lower opening when the day session begins trading. Stochastics and the RSI remain neutral to bearish signaling that sideways to lower prices are possible near-term. If September extends the decline off July's high, July's low crossing at 110.050 is the next downside target. Closes above the 10-day moving average crossing at 111.307 would signal that a short-term low has been posted. First resistance is the 50-day moving average crossing at 112.271. Second resistance is the 50% retracement level of the April-July decline crossing at 113.313. First support is Friday's low crossing at 110.255. Second support is July's low crossing at 110.050.
ENERGY MARKETS? http://quotes.ino.com/ex?changes/?c=energy ""
ENERGIES:Septembercrude oil was higher overnight as it extends this month's rally and is challenging April's high crossing at $81.44. Overnight trading sets the stage for a higher opening when the day session begins trading. Stochastics and the RSI are overbought but remain neutral to bullish signaling that sideways to higher prices are possible near-term. If September extends the rally off the June 28th low, the November-2022 high crossing at $83.59 is the next upside target. Closes below the 20-day moving average crossing at $75.97 would signal that a short-term top has been posted. First resistance is April's high crossing at $81.44. Second resistance is the November-2022 high crossing at $83.59. First support is the 10-day moving average crossing at 78.28. Second support is the 20-day moving average crossing at $75.97.
September heating oil was slightly lower overnight as it consolidates some of some of this month's rally. Overnight trading sets the stage for a slightly lower opening when the day session begins trading. Stochastics and the RSI are overbought but remain neutral to bullish signaling that sideways to higher prices are possible near-term. If September extends the rally off May's low, the 75% retracement level of the 2022-2023 decline crossing at 3.0002 is the next upside target. Closes below the 20-day moving average crossing at 2.6560 would signal that a short-term top has been posted. First resistance is last-Friday's high crossing at 2.9651. Second resistance is the 75% retracement level of the 2022-2023 decline crossing at 2.6011. First support is the 10-day moving average crossing at 2.7794. Second support is the 20-day moving average crossing at 2.6561.
September unleaded gas was slightly lower overnight. Overnight trading sets the stage for a slightly lower opening when the day session begins trading. Stochastics and the RSI are overbought but remain neutral to bullish signaling that sideways to higher prices are possible near-term. If September extends the rally off the June 23rd low, the October-2022 high on the weekly continuation chart crossing at 3.0221 is the next upside target. Closes below the 20-day moving average crossing at 2.6546 would signal that a short-term top has been posted. First resistance is last-Friday's high crossing at $2.9257. Second resistance is the October-2022 high on the weekly continuation chart crossing at $3.0221. First support is the 10-day moving average crossing at $2.7882. Second support is the 20-day moving average crossing at $2.6547.
September natural gas was slightly higher overnight and sets the stage for a slightly higher opening when the day session begins trading. Stochastics and the RSI are neutral to bearish signaling that sideways to lower prices are possible near-term. If September extends last-week's decline, the July 17th low crossing at 2.477 is the next downside target. If September renews the rally off the July 17th low, the June 26th high crossing at 2.911 is the next upside target. First resistance is the June 26th high crossing at 2.911. Second resistance is the 25% retracement level of the 2022-2023 decline crossing at 3.193. First support is the July 17th low crossing at 2.477. Second support is the June 1st low crossing at 2.249.
CURRENCIEShttp://quotes.ino.com/ex changes/?c=currencies"
CURRENCIES:The September Dollar was steady to slightly higher overnight. Overnight trading sets the stage for a slightly higher opening when the day session begins trading later this morning. Stochastics and the RSI are becoming overbought but remain neutral to bullish signaling that sideways to higher prices are possible near-term. If September extends the rally off July's low, the 50-day moving average crossing at $102.139 is the next upside target. Closes below last-Thursday's low crossing at $100.320 would temper the near-term friendly outlook in the market. First resistance is last-Friday's high crossing at $101.825. Second resistance is the 50-day moving average crossing at $102.139. First support is last-Thursday's low crossing at $100.320. Second support is July's low crossing at $99.220.
The September Euro was higher overnight as it consolidates some of the decline off July's high. Overnight trading sets the stage for a higher opening when the day session begins trading. Stochastics and the RSI remain neutral to bearish signaling that sideways to lower prices are possible near-term. If September extends the decline off last-Tuesday's high, the 50-day moving average crossing at 1.09657 is the next downside target. Closes above the 10-day moving average crossing at $1.11233 would temper the near-term bearish outlook in the market. First resistance is the 10-day moving average crossing at $1.11233. Second resistance is the July 18th high crossing at $1.13105. First support is last-Friday's low crossing at 1.09700. Second support is the 50-day moving average crossing at 1.09657.
The September British Pound was steady to slightly higher overnight as it consolidates some of the decline off July's high. Overnight trading and sets the stage for a slightly higher opening when the day session begins trading. Stochastics and the RSI are neutral to bearish signaling that sideways to lower prices near-term. If September extends this month's decline, the 50-day moving average crossing at 1.2706 is the next downside target. Closes above Thursday's high crossing at 1.2999 would signal that a short-term low has been posted. First resistance is the July 14th high crossing at 1.3146. Second resistance is the 75% retracement level of the 2022-2023 decline crossing at 1.3253. First support is the 50-day moving average crossing at 1.2706. Second support is the June 29th low crossing at 1.2594.
The September Swiss Franc was slightly lower overnight as it extends the decline off July's high. Overnight weakness sets the stage for a slightly lower opening when the day session begins trading. Stochastics and the RSI are neutral to bearish signaling that sideways to lower prices are possible near-term. Closes below the 20-day moving average crossing at 1.15432 would signal that a short-term top has been posted. If September resumes the rally off May's low, the January 2019 high crossing at 1.18680 is the next upside target. First resistance is the July 18th high crossing at 1.17650. Second resistance is the January 2019 high crossing at 1.18680. First support is the 20-day moving average crossing at 1.15432. Second support is the 50-day moving average crossing at 1.13460.
The September Canadian Dollar was higher overnight as it consolidates some of the decline off July's high. Overnight trading sets the stage for a higher opening when the day session begins trading. Stochastics and the RSI are neutral to bearish signaling that sideways to lower prices are possible near-term. If September extends the decline off July's high, the 50-day moving average crossing at $75.27 is the next downside target. If September renews the rally off July's low, the September-12th -2022 high crossing at $77.11 is the next upside target. First resistance is the 38% retracement level of the 2022-2023 decline crossing at $76.28. Second resistance is the September-12th -2022 high crossing at $77.11. First support is the July 18th low crossing at $75.57. Second support is the 50-day moving average crossing at $75.27.
The September Japanese Yen was lower overnight as it extends the decline off last-Friday's high. Overnight trading sets the stage for a lower opening when the day session begins trading. Stochastics and the RSI have turned neutral to bearish signaling that sideways to lower prices are possible near-term. If September extends the decline off the July 14th high, June's low crossing at 0.069755 is the next downside target. If September renews the rally off July's low, the July 14th high crossing at 0.073585 is the next upside target. First resistance is the July14th high crossing at 0.073585. Second resistance is the 38% retracement level of the January-June decline crossing at 0.074017. First support is last-Friday's low crossing at 0.070640. Second support is June's low crossing at 0.069755.
PRECIOUS METALS http://quotes.ino.com/ex changes/?c=metals"
Precious Metals: Augustgold was lower overnight and is working on a possible inside day. Overnight trading sets the stage for a lower opening when the day session begins trading later this morning. Stochastics and the RSI are neutral to bearish signaling that sideways to lower prices are possible near-term. last-Thursday's close below the 20-day moving average crossing at $1953.90 signal that a short-term top has been posted while opening the door for additional weakness near-term. If August renews the rally off June's low, the 50% retracement level of the May-June decline crossing at $2001.40 is the next upside target. First resistance is the July 20th high crossing at $1989.80. Second resistance is the 50% retracement level of the May-June decline crossing at $2001.40. First support is last-Thursday's low crossing at $1941.70. Second support is June's low crossing at $1900.60.
September silver was steady to slightly higher overnight as it consolidates some of last-Thursday's decline. Overnight trading sets the stage for a slightly higher opening when the day session begins trading later this morning. Stochastics and the RSI are neutral to bearish signaling that sideways to lower prices are possible near-term. Closes below the 50-day moving average crossing at $23.944 would signal that a short-term top has been posted. If July resumes the rally off June's low, the 75% retracement level of the May-June decline crossing at $25.561 is the next upside target. First resistance is July's high crossing at $25.475. Second resistance is the 75% retracement level of the May-June decline crossing at 25.561. First support is the 20-day moving average crossing at $24.351. Second support is the 50-day moving average crossing at $23.944.
September copper was steady to slightly higher in late-overnight trading and sets the stage for a slightly higher opening when the day session begins trading. Stochastics and the RSI are neutral to bullish signaling that sideways to higher prices are possible near-term. If September renews the rally off the June 29th low, May's high crossing at 4.0100 is the next upside target. Closes below the 50-day moving average crossing at 3.7986 would signal that a short-term top has been posted. First resistance June's high crossing at 3.9640. Second resistance is May's high crossing at 4.0100. First support is the 50-day moving average crossing at 3.7986. Second support is the June 29th low crossing at 3.6830.
GRAINS http://quotes.ino.com/ex changes/?c=grains
Grains: December corn gapped down and was sharply lower overnight as it extends the decline off Monday's high due to a non-threatening weather forecast for August. Overnight trading sets the stage for a lower opening when the day sessions begins trading. Stochastics and the RSI are bearish signaling that sideways to lower prices are possible near-term. If December extends the decline off last-week's high, the July 16th low crossing at $5.02 is the next downside target. If December renews the rally off July's low, the 75% retracement level of the June-July decline crossing at $5.92 3/4 is the next upside target. First resistance is the 62% retracement level of the June-July decline crossing at $5.73. Second resistance is the 75% retracement level of the June-July decline crossing at $5.92 3/4. First support is the July 16th low crossing at $5.02. Second support is July's low crossing at $4.81.
September wheat was sharply lower overnight as it extends the decline off last-Tuesday's high. Overnight trading sets the stage for a sharply lower opening when the day session begins trading. Stochastics and the RSI are neutral to bearish signaling that sideways to lower prices are possible near-term. Closes below last-Friday's low crossing at $6.93 1/2 would confirm that a short-term top has been posted. If September renews the rally off July's low, the 38% retracement level of the 2022-2023 decline crossing at $7.95 1/4 is the next upside target. First resistance is last-Tuesday's high crossing at $7.77 1/4. Second resistance is the 38% retracement level of the 2022-2023 decline crossing at $7.95 1/4. First support is the 20-day moving average crossing at $6.82. Second support is the 50-day moving average crossing at $6.67 1/2.
September Kansas City wheat was lower overnight as it extends last-week's losses. Overnight trading sets the stage for a lower opening when the day session begins trading later this morning. Stochastics and the RSI are bearish signaling that sideways to lower prices are possible near-term. Closes below the 20-day moving average crossing at $8.41 1/2 would temper the near-term friendly outlook. If September renews this month's rally, the 50% retracement level of the 2022-2023 decline crossing at $9.46 3/4 is the next upside target. First resistance is last-Tuesday's high crossing at $9.29 3/4. Second resistance is the 50% retracement level of the 2022-2023 decline crossing at $9.46 3/4. First support is the 20-day moving average crossing at $8.41 1/2. Second support is the 50-day moving average crossing at $8.27 1/4.
September Minneapolis wheat was sharply lower overnight and sets the stage for a sharply lower opening when the day session begins trading. Stochastics and the RSI are neutral to bearish signaling that sideways to lower prices are possible near-term. Closes below the 20-day moving average crossing at $8.78 1/2 would confirm that a short-term top has been posted while opening the door for additional weakness near-term. If September renews the rally off July's low, the 50% retracement level of the 2022-2023 decline crossing at $9.60 3/4 is the next upside target. First resistance is last-Tuesday's high crossing at $9.47 3/4. Second resistance is the 50% retracement level of the 2022-2023 decline crossing at $9.60 3/4. First support is the 20-day moving average crossing at $8.78 1/2. Second support is the 50-day moving average crossing at $8.46.
SOYBEAN COMPLEX? http://quotes.ino.com/ex?changes/?c=grains "
November soybeans gapped down and was sharply lower overnight and sets the stage for a sharply lower opening when the day session begins trading later this morning. Stochastics and the RSI are bearish signaling that sideways to lower prices are possible near-term. Closes below the 20-day moving average crossing at $13.76 1/4 would confirm that a short-term top has been posted. If November renews the rally off May's low, the May-2022 high crossing at $14.48 1/4 is the next upside target. First resistance is last-Monday's high crossing at $14.35. Second resistance is the May-2022 high crossing at $14.48 1/4. First support is the 20-day moving average crossing at $13.76 1/4. Second support is the July 7th low crossing at $13.15 1/2.
December soybean meal gapped down and was lower overnight setting the stage for a lower opening when the day session begins trading. Stochastics and the RSI are bearish signaling that sideways to lower prices are possible near-term. Closes below the 20-day moving average crossing at $403.70 would confirm that a short-term top has been posted. If December resumes the rally off the June 29th low, the 87% retracement level of the March-May decline crossing at $428.00 is the next upside target. First resistance is the 75% retracement level of the March-May decline crossing at $418.80. Second resistance is the 87% retracement level of the March-May decline crossing at $428.00. First support is the 20-day moving average crossing at $403.70. Second support is the 50-day moving average crossing at $390.50.
December soybean oil was sharply lower in overnight trading as it extends the decline off July's high. Overnight trading sets the stage for a sharply lower opening when the day session begins trading. Stochastics and the RSI are bearish signaling that sideways to lower prices are possible near-term. Closes below the 20-day moving average crossing at 61.28 would confirm that a short-term top has been posted while opening the door for additional weakness near-term. If December renews the rally off May's low, the 87% retracement level of the 2022-2023 decline crossing at 68.81 is the next upside target. First resistance is the 75% retracement level of the 2022-2023 decline crossing at 65.45. Second resistance is the 87% retracement level of the 2022-2023 decline crossing at 68.81. First support is the 20-day moving average crossing at 61.28. Second support is the July 7th low crossing at 58.20.
Thanks much, tallpine!
Grains continue under pressure from bearish weather after the gap lower last evening.
https://www.marketforum.com/forum/topic/97726/
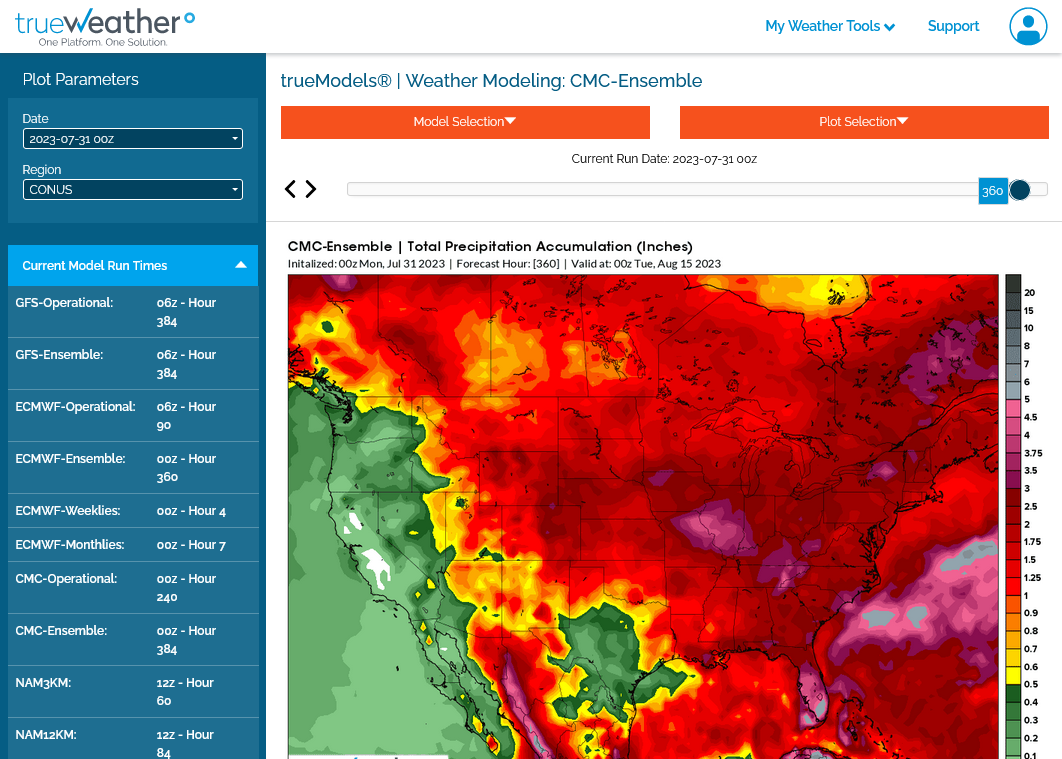
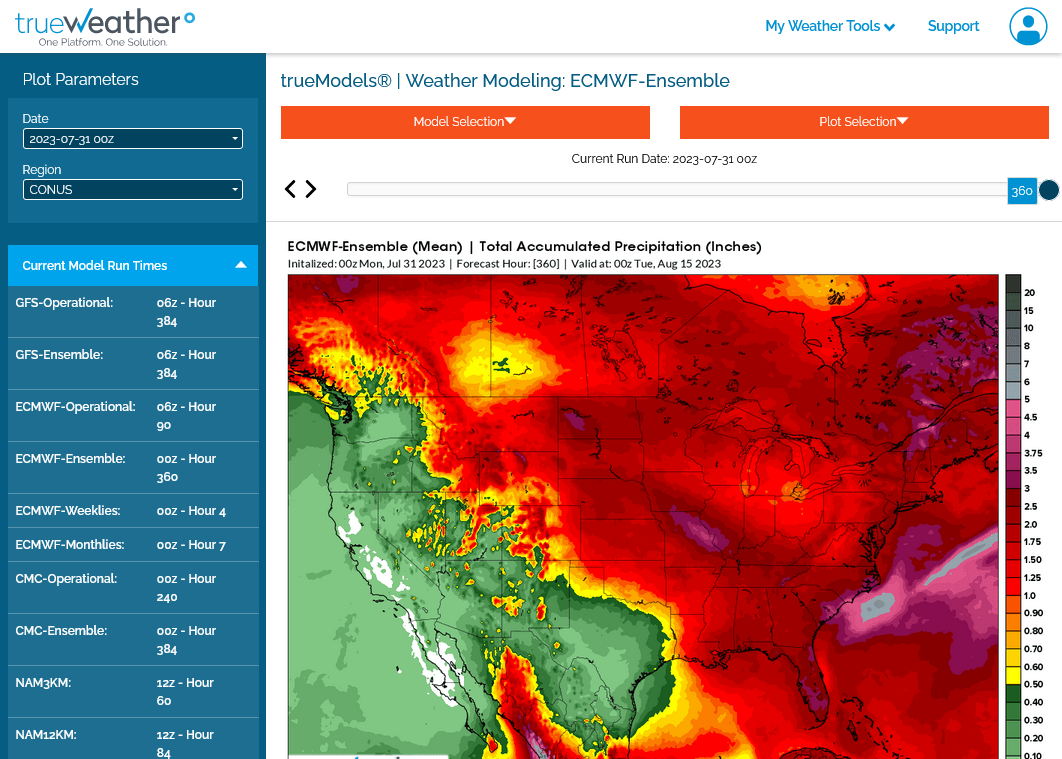
The upcoming pattern will feature a big heat dome in the south, with active perturbations coming around the periphery to dump copious rains in big parts of the Midwest.
Total rains. Dark reds are 2 inches of rain, which is above average for 2 weeks in this time of year.
1. Last 6z GEFS
2. Last 0z Canadian
3. Last 0z European
4. 500mb European in 2 weeks. There is a Bermuda high trying to build in the Southeast.........moisture pump!

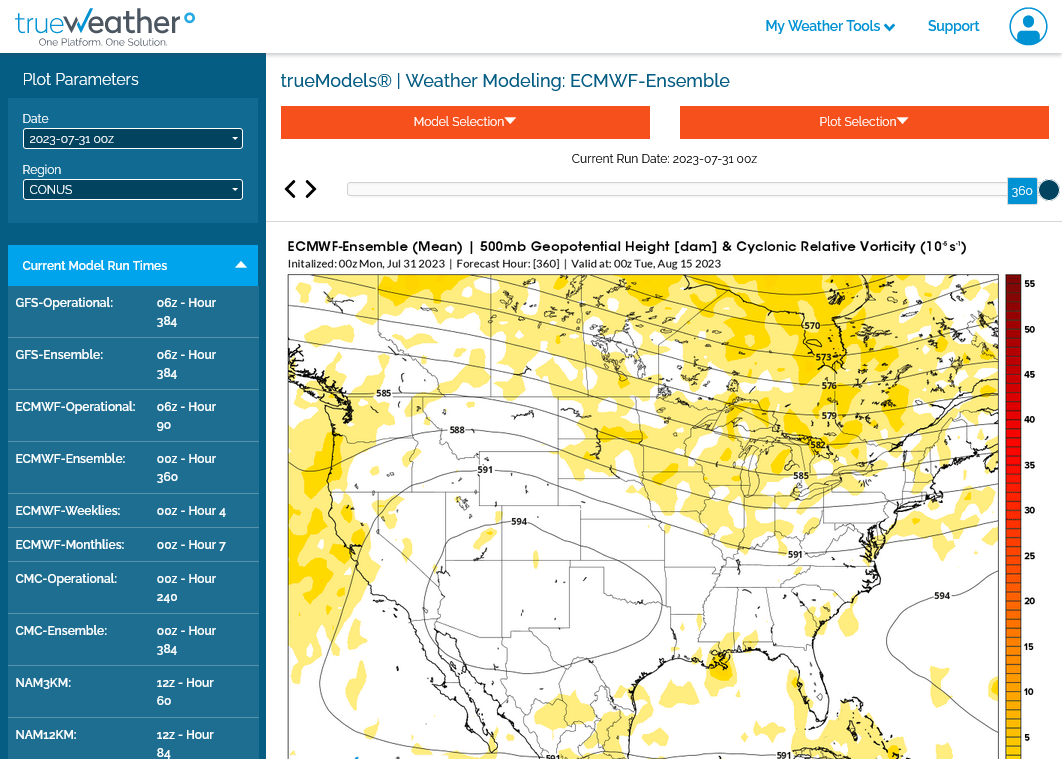
There's the chance that the Upper Midwest and Northeast belt will not get that much rain.
