KEY EVENTS TO WATCH FOR:
Wednesday, August 2, 2023
7:00 AM ET. MBA Weekly Mortgage Applications Survey
Composite Idx (previous 206.9)
Composite Idx, W/W% (previous -1.8%)
Purchase Idx-SA (previous 159.2)
Purchase Idx-SA, W/W% (previous -2.5%)
Refinance Idx (previous 444.5)
Refinance Idx, W/W% (previous -0.4%)
8:15 AM ET. July ADP National Employment Report
Private Sector Jobs, Net Chg (expected +175000; previous +497000)
10:00 AM ET. 2nd Quarter U.S. Housing Vacancies
10:00 AM ET. June Metropolitan Area Employment and Unemployment
10:30 AM ET. EIA Weekly Petroleum Status Report
Crude Oil Stocks (Bbl) (previous 456.82M)
Crude Oil Stocks, Net Chg (Bbl) (previous -0.6M)
Gasoline Stocks (Bbl) (previous 217.6M)
Gasoline Stocks, Net Chg (Bbl) (previous -0.786M)
Distillate Stocks (Bbl) (previous 117.949M)
Distillate Stocks, Net Chg (Bbl) (previous -0.245M)
Refinery Usage (previous 93.4%)
Total Prod Supplied (Bbl/day) (previous 21.276M)
Total Prod Supplied, Net Chg (Bbl/day) (previous +0.509M)
The STOCK INDEXES? http://quotes.ino.com/ex?changes/?c=indexes
The Dow closed higher on Tuesday as it extends this year's rally. The high-range close sets the stage for a steady to higher opening when Wednesday's day session begins trading. Stochastics and the RSI are overbought but remain neutral to bullish signaling that sideways to higher prices are possible near-term. If the Dow extends the rally off July's low, the February-2022 high crossing at 35,824.28 is the next upside target. Closes below the 20-day moving average crossing at 34,837.43 would signal that a short-term top has been posted. First resistance is today's high crossing at 35,679.13. Second resistance is the February-2022 high crossing at 35,824.28. First support is the 10-day moving average crossing at 35,380.78. Second support is the 20-day moving average crossing at 34,837.43.
The September NASDAQ 100 closed slightly lower on Tuesday. The high-range close sets the stage for a steady to higher opening when Wednesday's night session begins trading. Stochastics and the RSI are neutral to bullish signaling sideways to higher prices are possible. If September renews this year's rally, the December-2021 high on the weekly continuation chart crossing at 16,659.50 is the next upside target. Closes below the 20-day moving average crossing at 15,597.44 would confirm that a short-term top has been posted while opening the door for additional weakness. First resistance is the July 19th high crossing at 16,062.75. Second resistance is the December-2021 high on the weekly continuation chart crossing at 16,659.50. First support is the 20-day moving average crossing at 15,597.44. Second support is the 50-day moving average crossing at 15,112.83.
The September S&P 500 closed slightly lower on Tuesday. The low-range close sets the stage for a steady to lower opening when Wednesday's night session begins trading. Stochastics and the RSI are overbought, diverging but remain neutral to bullish signaling that sideways to higher prices are possible near-term. If September extends the rally off March's low, the 87% retracement level of the 2022 decline on the weekly chart crossing at 4639.07 is the next upside target. Closes below the 20-day moving average crossing at 4545.09 would confirm that a short-term top has been posted. First resistance is last-Thursday's high crossing at 4634.50. Second resistance is the 87% retracement level of the 2022 decline on the weekly chart crossing at 4639.07. First support is the 20-day moving average crossing at 4545.09. Second support is the 50-day moving average crossing at 4427.95.
INTEREST RATES? http://quotes.ino.com/ex?changes/?c=interest ""
September T-bonds closed down 1-11/32's at 123-03.
September T-bonds closed sharply lower on Tuesday and spiked to a new low for the year. The low-range close sets the stage for a steady to lower opening when Wednesday's day session begins trading. Stochastics and the RSI are neutral to bearish signaling that sideways to lower prices are possible near-term. If September extends the decline off July's high, the February low on the weekly continuation chart crossing at 122-22 is the next downside target. Closes above the 50-day moving average crossing at 126-17 would signal that a short-term low has been posted. First resistance is the 20-day moving average crossing at 125-12. Second resistance is the 50-day moving average crossing at 126-17. First support is today's low crossing at 122-26. Second support is the February low on the weekly continuation chart crossing at 122-22.
September T-notes closed down 130-pts. at 111.000.
September T-notes closed lower on Tuesday as it extends the decline off July's high. The low-range close sets the stage for a steady to lower opening when Wednesday's day session begins trading. Stochastics and the RSI are neutral to bearish signaling that sideways to lower prices are possible near-term. If September extends the decline off July's high, July's low crossing at 110.050 is the next downside target. If September renews the rally off the July 6th low, the 50-day moving average crossing at 112.247 would signal that a short-term low has been posted. First resistance is the 50-day moving average crossing at 112.247. Second resistance is July's high crossing at 113.080. First support is last-Friday's low crossing at 110.255. Second support is July's low crossing at 110.050.
ENERGY MARKETS? http://quotes.ino.com/ex?changes/?c=energy ""
September crude oil posted an inside day with a lower close on Tuesday as it consolidates some of the rally off June's low. The mid-range close sets the stage for a steady to lower opening when Wednesday's day session begins. Stochastics and the RSI are overbought but remain neutral to bullish signaling that sideways to higher prices are possible near-term. If September extends the rally off June's low, the 62% retracement level of the 2022-2023 decline on the weekly chart crossing at $84.20 is the next upside target. Closes below the 20-day moving average crossing at $76.57 would signal that a short-term top has been posted. First resistance January's high crossing at $81.75. Second resistance is the 62% retracement level of the 2022-2023 decline on the weekly chart crossing at $84.20. First support is the 10-day moving average crossing at $78.90. Second support is the 20-day moving average crossing at $76.57.
September heating oil closed higher on Tuesday as it extended the rally off May's low. The mid-range close sets the stage for a steady to higher opening when Wednesday's day trading session begins. Stochastics and the RSI are overbought but remain neutral to bullish signaling that sideways to higher prices are possible near-term. If September extends the rally off May's low, the 87% retracement level of the 2022-2023 decline crossing at 3.1313 is the next upside target. Closes below the 20-day moving average crossing at 2.6910 would signal that a short-term top has been posted. First resistance is today's high crossing at 3.0725. Second resistance is the 87% retracement level of the 2022-2023 decline crossing at 3.1313. First support is the 10-day moving average crossing at 2.8272. Second support the 20-day moving average crossing at 2.6909.
September unleaded gas closed slightly lower on Tuesday. The low-range close sets the stage for a steady to lower opening when Wednesday's day session begins trading. Stochastics and the RSI are overbought but remain neutral to bullish signaling that sideways to higher prices are possible near-term. If September extends the rally off the June 23rd low, the October-2022 high on the weekly continuation chart crossing at 3.0221 is the next upside target. Closes below the 20-day moving average crossing at 2.6793 would confirm that a short-term top has been posted. First resistance is last-Friday's high crossing at 2.9257. Second resistance is the October-2022 high on the weekly continuation chart crossing at 3.0221. First support is the 10-day moving average crossing at 2.8135. Second support is the 20-day moving average crossing at 2.6793.
September Henry natural gas closed lower on Tuesday.The low-range close sets the stage for a steady to lower opening when Wednesday's day session begins trading. Stochastics and the RSI are neutral to bearish signaling that sideways to lower prices are possible near-term. If September extends last-Thursday's decline, the July 17th low crossing at 2.477 is the next downside target. If September renews the rally off the July 17th low, June's high crossing at 2.911 is the next upside target. First resistance is the June high crossing at 2.911. Second resistance is the 25% retracement level of the 2022-2023 decline crossing at 3.193. First support is the July 17th low crossing at 2.477. Second support is the June 1st low crossing at 2.249.
CURRENCIES? http://quotes.ino.com/ex?changes/?c=currencies ""
The September Dollar closed higher on Tuesday as it extends the rally off July's low. The high-range close sets the stage for a steady to higher opening when Wednesday's session begins trading. Stochastics and the RSI are overbought but remain neutral to bullish signaling that sideways to higher prices are possible near-term. Closes above the 50-day moving average crossing at 102.124 would open the door for a possible test of July's high crossing at 103.275. Closes below last-Thursday's low crossing at 100.320 would signal that a short-term top has been posted. First resistance is the 50-day moving average crossing at 102.124. Second resistance is July's high crossing at 103.275. First support is last-Thursday's low crossing at 100.320. Second support is July's low crossing at 99.220.
The September Euro closed lower on Tuesday. The mid-range close sets the stage for a steady to lower opening when Wednesday's day session begins trading. Stochastics and the RSI are oversold but remain neutral to bearish signaling that sideways to lower prices are possible near-term. Closes below the 50-day moving average crossing at $1.09683 would open the door for a possible test of July's low crossing at 1.08715. Closes above last-Thursday's high crossing at 1.11770 would temper the near-term bearish outlook. First resistance is last-Thursday's high crossing at 1.11770. Second resistance is July's high crossing at $1.13105. First support is the 50-day moving average crossing at $1.09683. Second support is July's low crossing at 1.08715.
The September British Pound closed lower on Tuesday as it extended the decline off July's high. The low-range close sets the stage for a steady to lower opening when Wednesday's day session begins trading. Stochastics and the RSI are oversold but remain neutral to bearish signaling sideways to lower prices are possible near-term. If September extends the decline off July's high, the 50-day moving average crossing at 1.2712 is the next downside target. Closes above last-Thursday's high crossing at 1.2999 would signal that a short-term low has been posted. First resistance is last-Thursday's high crossing at 1.2999. Second resistance is the July 14th high crossing at 1.3146. First support is today's low crossing at 1.2744. Second support is the 50-day moving average crossing at 1.2712.
The September Swiss Franc closed lower on Tuesday as it extends the decline off July's high. The low-range close sets the stage for a steady to lower opening when Wednesday's day session begins trading. Stochastics and the RSI are neutral to bearish signaling that sideways to lower prices are possible near-term. If September extends the aforementioned decline, the 50-day moving average crossing at 1.13513 is the next downside target. If September renews the rally off May's low, the January 2019 high crossing at 1.18680 is the next upside target. First resistance is the July 18th high crossing at 1.17650. Second resistance is the January 2019 high crossing at 1.18680. First support is today's low crossing at 1.14505. Second support is the 50-day moving average crossing at 1.13513.
The September Canadian Dollar closed sharply lower on Tuesday. The low-range close sets the stage for a steady to lower opening when Wednesday's day session begins trading. Stochastics and the RSI are neutral to bearish signaling that sideways to lower prices are possible near-term. Closes below the 50-day moving average crossing at 75.30 would open the door for a possible test of July's low crossing at 74.78. If September renews the rally off the January 7th low, the September 12th 2022 high crossing at 77.11 is the next upside target. First resistance is the 38% retracement level of the 2021-2022 decline crossing at 76.28. Second resistance is the September 12th high crossing at 77.11. First support is the 50-day moving average crossing at 75.30. Second support is July's low crossing at 74.78.
The September Japanese Yen closed lower on Tuesday as it extended the decline off July's high. The low-range close sets the stage for a steady to lower opening when Wednesday’s day session begins trading. Stochastics and the RSI are oversold but remain neutral to bearish signaling that sideways to lower prices are possible near-term. If September extends the decline off July's high, June's low crossing at 0.069755 is the next downside target. If September resumes the rally off June's low, the 38% retracement level of the January-June decline crossing at 0.074017 is the next upside target. First resistance is last-Thursday's high crossing at 0.073015. Second resistance is July's high crossing at 0.073585. First support is today's low crossing at 0.070180. Second support is June's low crossing at 0.069755.
PRECIOUS METALS? http://quotes.ino.com/ex?changes/?c=metals ""
August gold closed lower on Tuesday. The low-range close sets the stage for a steady to lower opening when Wednesday's day session begins trading. Stochastics and the RSI are neutral to bearish signaling that sideways to lower prices are possible near-term. If August extended the decline off July's high, June's low crossing at $1911.40 is the next downside target. If August renews the rally off June's low, June's high crossing at $2000.70 is the next upside target. First resistance is June's high crossing at $2000.70. Second resistance is the 62% retracement level of the May-June decline crossing at $2025.20. First support is today's low crossing at $1940.70. Second support is June's low crossing at $1911.40.
September silver closed lower on Tuesday. The low-range close sets the stage for a steady to lower opening when Wednesday's day session begins trading. Stochastics and the RSI are neutral to bearish signaling that sideways to lower prices are possible near-term. Closes below the 50-day moving average crossing at 23.965 would signal that a short-term top has been posted. If July renews the rally off June's low, the 75% retracement level of the April-June decline crossing at 25.561 is the next upside target. First resistance is July's high crossing at 25.475. Second resistance is the 75% retracement level of the April-June decline crossing at 25.561. First support is the 20-day moving average crossing at 24.440. Second support is the 50-day moving average crossing at 23.965.
September copper closed sharply lower on Tuesday as it consolidates some of the rally off May's low. The low-range close sets the stage for a steady to lower opening when Wednesday's day session begins trading. Stochastics and the RSI are overbought and turning neutral to bearish signaling that sideways to lower prices are possible near-term. Closes below the 50-day moving average crossing at 3.8042 would signal that a short-term top has been posted. If September extends the rally off June's low, April's high crossing at 4.1825 is the next upside target. First resistance is today's high crossing at 4.0240. Second resistance is April's high crossing at 4.1825. First support is the 20-day moving average crossing at 3.8546. Second support is the 50-day moving average crossing at 3.8042.
GRAINS? http://quotes.ino.com/ex?changes/?c=grains "
December Corn closed down $0.05 3/4-cents at $5.07 1/4.
December corn closed lower for the sixth-day in a row on Tuesday as it extends the decline off July's high. The low-range close sets the stage for a steady to lower opening when Wednesday's night session begins trading. Stochastics and the RSI are bearish signaling that sideways to lower prices are possible near-term. If December extends the decline off July's high, the July 18th low crossing at $5.02 is the next downside target. Closes above the 10-day moving average crossing at $5.41 would signal that a short-term low has been posted. First resistance is the 20-day moving average crossing at $5.22. Second resistance is the 50-day moving average crossing at $5.35 3/4. First support is the July 18th low crossing at $5.02. Second support is July's low crossing at $4.81.
September wheat closed down $0.13 1/2-cents at $6.52 1/4.
September wheat closed lower for the fifth-day in a row on Tuesday as it extended the decline off last-Tuesday's high. The low-range close sets the stage for a steady to lower opening when Wednesday's day session begins trading. Stochastics and the RSI are neutral to bearish signaling that sideways to lower prices are possible near-term. If September extends the decline off July's high, July's low crossing at $6.22 is the next downside target. Closes above the 10-day moving average crossing at $7.12 1/2 would signal that a short-term low has been posted. First resistance is the 10-day moving average crossing at $7.12 1/2. Second resistance is July's high crossing at $7.77 1/4. First support is today's low crossing at $6.43 1/4. Second support is July's low crossing at $6.22.
September Kansas City Wheat closed down $0.08 1/4-cents at $7.92 1/4.
September Kansas City wheat closed lower on Tuesday as it extended the decline off July's high. The mid-range close sets the stage for a steady to lower opening when Wednesday's day session begins trading. Stochastics and the RSI are bearish signaling that sideways to lower prices are possible near-term. If September extends the decline off July's high, July's low crossing at $7.87 1/4 is the next downside target. Closes above the 10-day moving average crossing at $8.63 3/4 would signal that a short-term low has been posted. First resistance is the 50-day moving average crossing at $8.26. Second resistance is the 20-day moving average crossing at $8.42 3/4. First support is the July 12th low crossing at $7.92. Second support is July's low crossing at $7.87 1/4.
September Minneapolis wheat closed down $0.01-cent crossing at $8.54 3/4.
September Minneapolis wheat closed slightly lower on Tuesday as it extended the decline off July's high. The low-range close sets the stage for a steady to lower opening when Wednesday's day session begins trading. Stochastics and the RSI are bearish signaling that sideways to lower prices are possible near-term. Closes below the 50-day moving average crossing at $8.46 would open the door for additional weakness and possible test of July's low crossing at $8.07 1/4. Closes above the 10-day moving average crossing at $8.96 would signal that a short-term low has been posted. First resistance is the 20-day moving average crossing at $8.79 1/2. Second resistance is the 10-day moving average crossing at $8.96. First support is the 50-day moving average crossing at $8.46. Second support is July's low crossing at $8.07 1/4.
SOYBEAN COMPLEX? http://quotes.ino.com/ex?changes/?c=grains "
November soybeans closed up $0.09 1/2-cents at $13.41 1/4.
November soybeans posted an inside day with a higher close on Tuesday as it consolidated some the decline off last-Monday's high. The high-range close sets the stage for a steady to higher opening when Wednesday's day session begins trading. Stochastics and the RSI are neutral to bearish signaling that sideways to higher prices are possible near-term. Closes above the 10-day moving average crossing at $13.93 1/2 would signal that a short-term low has been posted. If November extends the aforementioned decline, the 50-day moving average crossing at $12.94 1/2 is the next downside target. First resistance is Monday's gap crossing at $13.79. Second resistance is last-Monday's high crossing at $14.35. First support is the July 7th low crossing at $13.15 1/2. Second support is the 50-day moving average crossing at $12.94 1/2.
December soybean meal closed up $2.40 at $398.30.
December soybean meal closed higher on Tuesday as it consolidated some of Monday's decline. The mid-range close sets the stage for a steady to higher opening when Wednesday's day session begins trading. Stochastics and the RSI are bearish signaling that sideways to lower prices are possible near-term. If December extends the decline off last-Thursday's high, the 50-day moving average crossing at $390.80 is the next downside target. Closes above the 10-day moving average crossing at $409.60 would signal that a short-term low has been posted. First resistance is the 10-day moving average crossing at $406.60. Second resistance is the 87% retracement level of the March-May decline crossing at $428.00. First support is the 50-day moving average crossing at $390.80. Second support is the July 7th low crossing at $384.70.
December soybean oil closed up 83-pts. at 60.82.
December soybean oil closed higher on Tuesday as it consolidated some of the decline off July's high but remain below the 20-day moving average crossing at 61.28. The high-range close sets the stage for a steady to higher opening when Wednesday's day session begins trading. Stochastics and the RSI are neutral to bearish signaling that sideways to lower prices are possible near-term. If December extends the decline off July's high, the 50-day moving average crossing at 55.74 is the next downside target. If December renews the rally off May's low, the 87% retracement level of the 2022-2023 decline crossing at 68.81 is the next upside target. First resistance is last-Monday's high crossing at 65.58. Second resistance is the 87% retracement level of the 2022-2023 decline crossing at 68.81. First support is the July 10th low crossing at 58.39. Second support is the 50-day moving average crossing at 55.74.
LIVESTOCKhttp://quotes.ino.com/exchanges/?c=livestock
October hogs closed down $0.38 at $85.63.
October hogs closed lower on Tuesday. The mid-range close sets the stage for a steady to lower opening when Wednesday's day session begins trading. Stochastics and the RSI are overbought but remain neutral to bullish signaling that sideways to higher prices are possible near-term. If October extends the rally off May's low, the 75% retracement level of the April-May decline crossing at $87.50 is the next upside target. Closes below the 20-day moving average crossing at $83.10 would signal that a short-term top has been posted. First resistance is today's high crossing at $86.75. Second resistance is the 75% retracement level of the April-May decline crossing at $87.50. First support is the 20-day moving average crossing at $83.10. Second support is the 50-day moving average crossing at $79.38.
October cattle closed up $2.35 at $181.88.
October cattle closed sharply higher on Tuesday. The high-range close sets the stage for a steady to higher opening on Wednesday. Stochastics and the RSI are oversold but are turning neutral to bullish signaling that sideways to higher prices are possible near-term. If October renews this year's rally into uncharted territory, upside targets will be hard to project. If October extends the decline off July's high, the 50-day moving average crossing at $176.72 is the next downside target. First resistance is July's high crossing at $185.75. Second resistance is unknown. First support is the 50-day moving average crossing at $176.72. Second support is the June 21st low crossing at $171.83.
October Feeder cattle closed up $2.38 at $253.40.
October Feeder cattle closed higher on Tuesday as it extends July's trading range. The high-range close sets the stage for a steady to higher opening when Wednesday's day session begins trading. Stochastics and the RSI have turned neutral to bullish signaling that sideways to higher prices are possible near-term. If October renews the rally off June's low into uncharted territory, upside targets will be hard to project. Closes below the July 6th low crossing at $246.03 would mark a downside breakout of the aforementioned trading range. First resistance is July's high crossing at $256.00. Second resistance is unknown. First support is the July 6th low crossing at $246.03. Second support is the 50-day moving average crossing at $245.92.
FOOD & FIBERhttp://quotes.ino.com/ex changes/?c=food
September coffee closed slightly higher on Tuesday. The mid-range close sets the stage for a steady to higher opening on Wednesday. Stochastics and the RSI are turning neutral to bullish signaling sideways to higher prices are possible near-term. If September extends the rally off July's low, the 50-day moving average crossing at $16.99 is the next upside target. If September resumes the decline off June's high, the 87% retracement level of the January-April rally crossing at $15.20 is the next downside target. First resistance is today's high crossing at $16.74. Second resistance is the June 27th high crossing at $16.79. First support is July's low crossing at $15.51. Second support is the 87% retracement level of the January-April rally crossing at $15.20.
September cocoa closed slightly higher on Tuesday. The mid-range close sets the stage for a steady to higher opening on Wednesday. Stochastics and the RSI are overbought but remain neutral to bullish signaling that sideways to higher prices are possible near-term. If September extends the rally off March's low, monthly resistance crossing at 37.75 is the next upside target. Closes below the 20-day moving average crossing at 34.10 would confirm that a short-term top has been posted.
October sugar closed higher on Tuesday. The high-range close sets the stage for a steady to higher opening on Wednesday. Stochastics and the RSI are neutral to bearish signaling that sideways to lower prices are possible near-term. Multiple closes below the 20-day moving average crossing at 24.10 would signal that a short-term top has been posted. If October renews the rally off June's low, June's high crossing at 26.19 is the next upside target.
December cotton closed higher on Tuesday as it extends the rally off Monday's low. The high-range close sets the stage for a steady to higher opening on Wednesday. Stochastics and the RSI are turning neutral to bullish signaling sideways to higher prices are possible near-term. If December renews the rally off June's low, the 75% retracement level of the May-July decline crossing at 91.29 is the next upside target. Closes below the 20-day moving average crossing at 83.19 would confirm that a short-term top has been posted.
Thanks tallpine!
I already did my afternoon update of everything there is on the morning page:
I'll just basically copy most of it below and add to that overnight if I get the chance or it changes.
+++++++++++++++++
All the weather:
https://www.marketforum.com/forum/topic/83844/
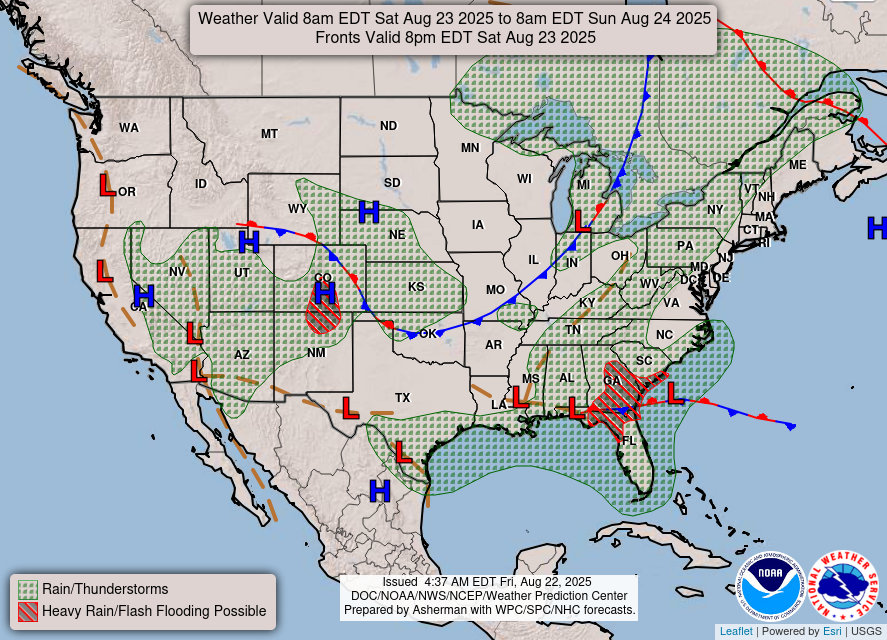
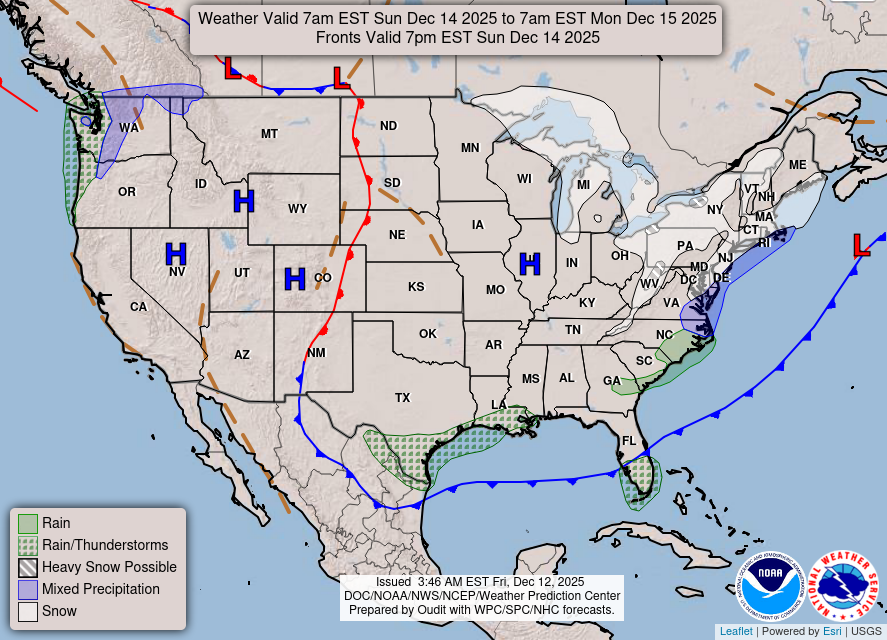
Weather maps now.
In 24 hours and
In 48 hours.
https://www.wpc.ncep.noaa.gov/#

+++++++++++++++++++++++++++++++++++++++++++++++++
Surface Weather maps for days 3-7 below:
https://www.wpc.ncep.noaa.gov/medr/medr.shtml

+++++++++++++++++++++++++++++++++++++++++++
The latest 7 day precip forecasts are below.
Day 1 below:
http://www.wpc.ncep.noaa.gov/qpf/fill_94qwbg.gif?1526306199054

Day 2 below:
http://www.wpc.ncep.noaa.gov/qpf/fill_98qwbg.gif?1528293750112

Day 3 below:
http://www.wpc.ncep.noaa.gov/qpf/fill_99qwbg.gif?1528293842764

Days 4-5 below:
http://www.wpc.ncep.noaa.gov/qpf/95ep48iwbg_fill.gif?1526306162

Days 6-7 below:
http://www.wpc.ncep.noaa.gov/qpf/97ep48iwbg_fill.gif?1526306162

7 Day Total precipitation below:
http://www.wpc.ncep.noaa.govcdx /qpf/p168i.gif?1530796126

Cooler forecast trends put pressure on natural gas futures in early trading Tuesday as the market looks to summer heat to help soak up a still-hefty storage surplus. The September Nymex contract was down 6.5 cents to $2.569/MMBtu at around 8:50 a.m. ET. Updated forecasts from Maxar’s Weather Desk showed cooler trends in the six-…
++++++++++++++++
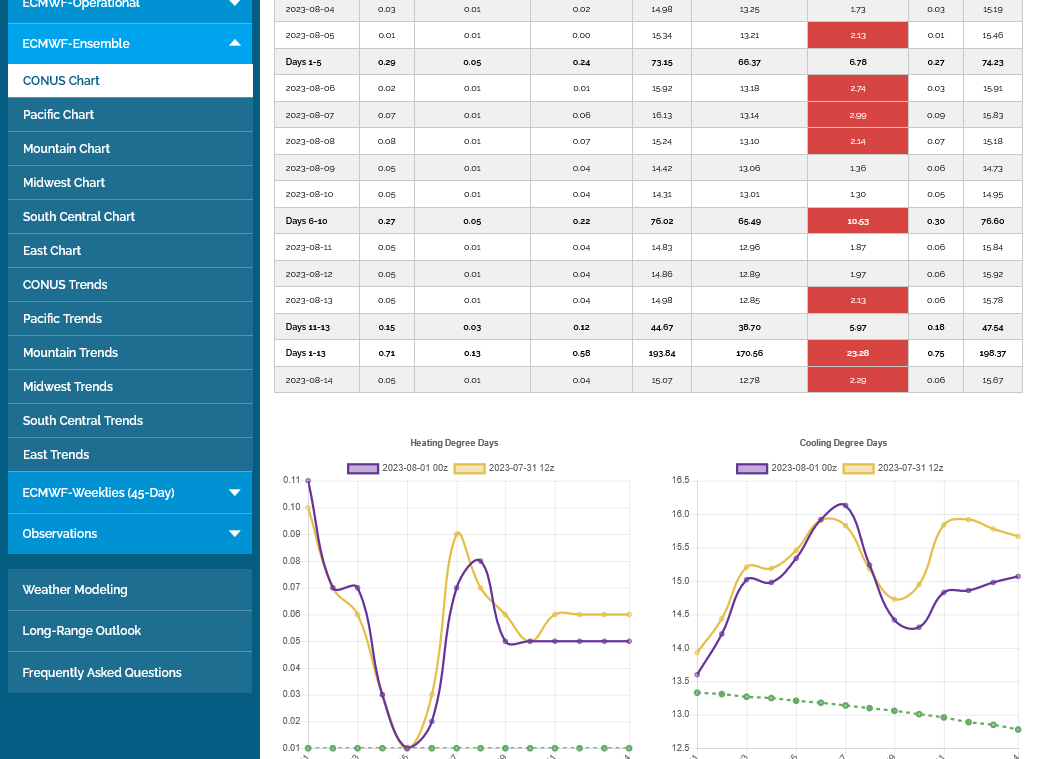
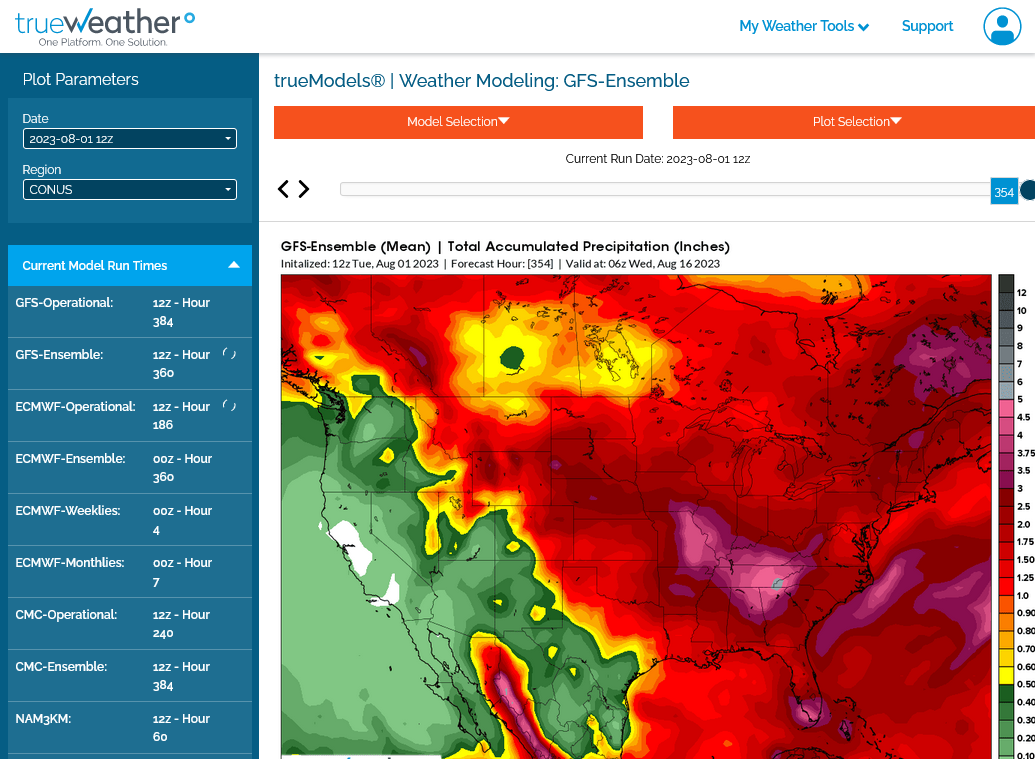
0z European model on the right(purple line) was -4 CDDS overnight. All of it from week 2 cooling changes.
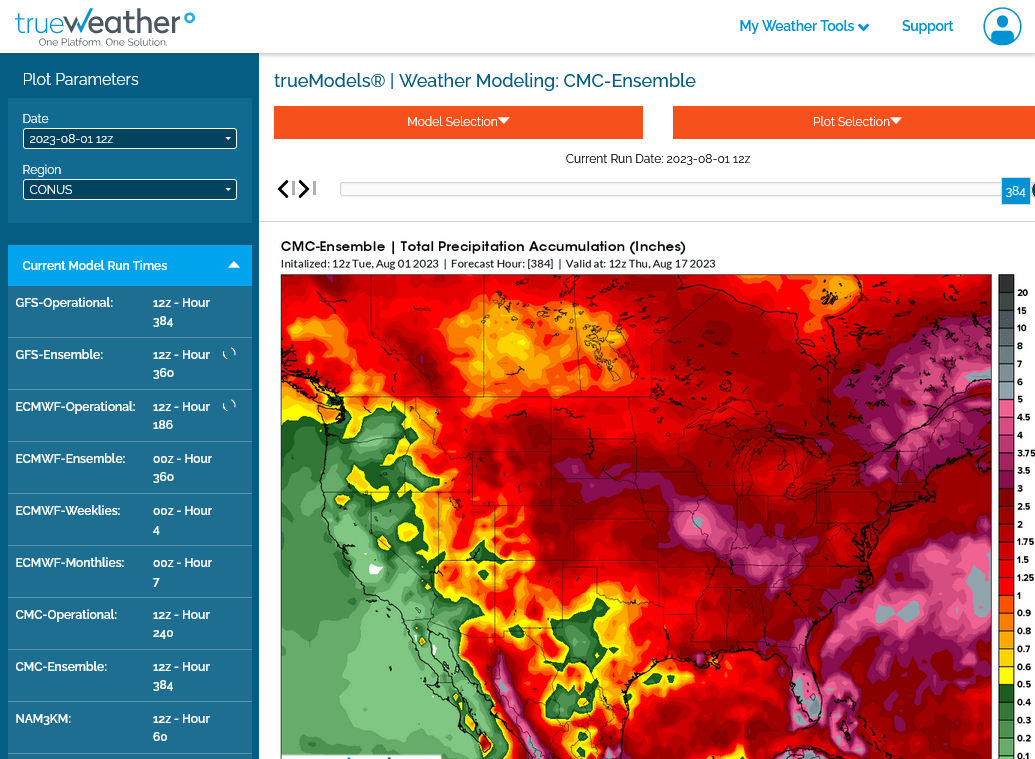
The threat for an area of excessive rains increased with the 2, 12z models out so far:
1. Canadian model
2. GEFS model
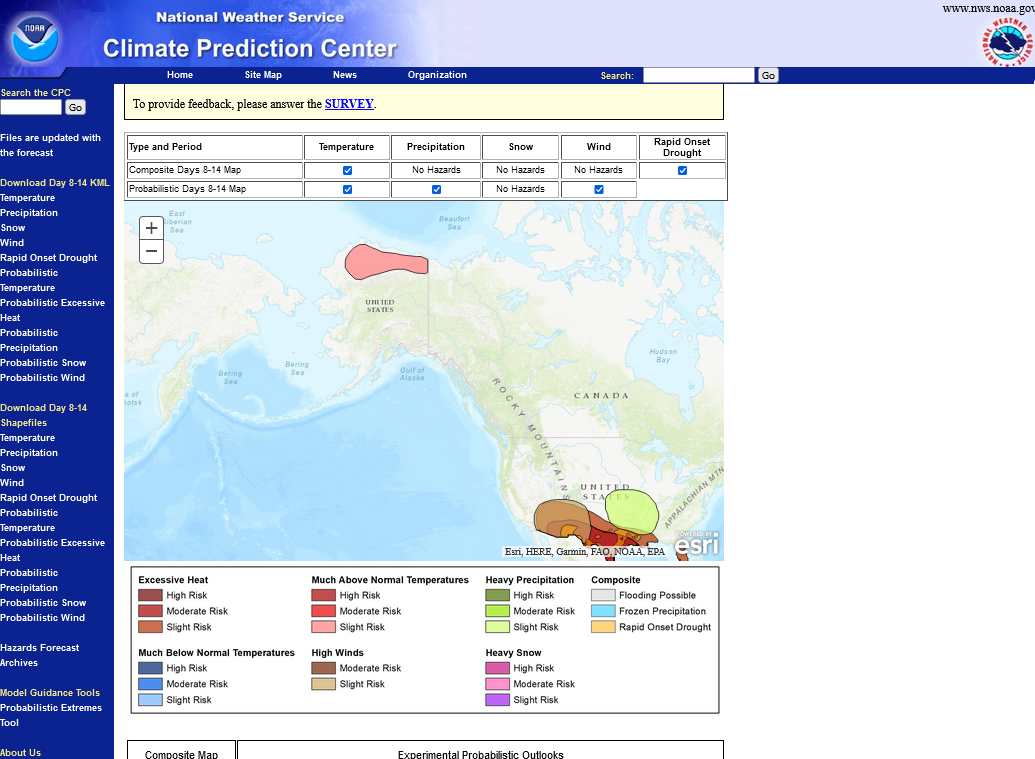
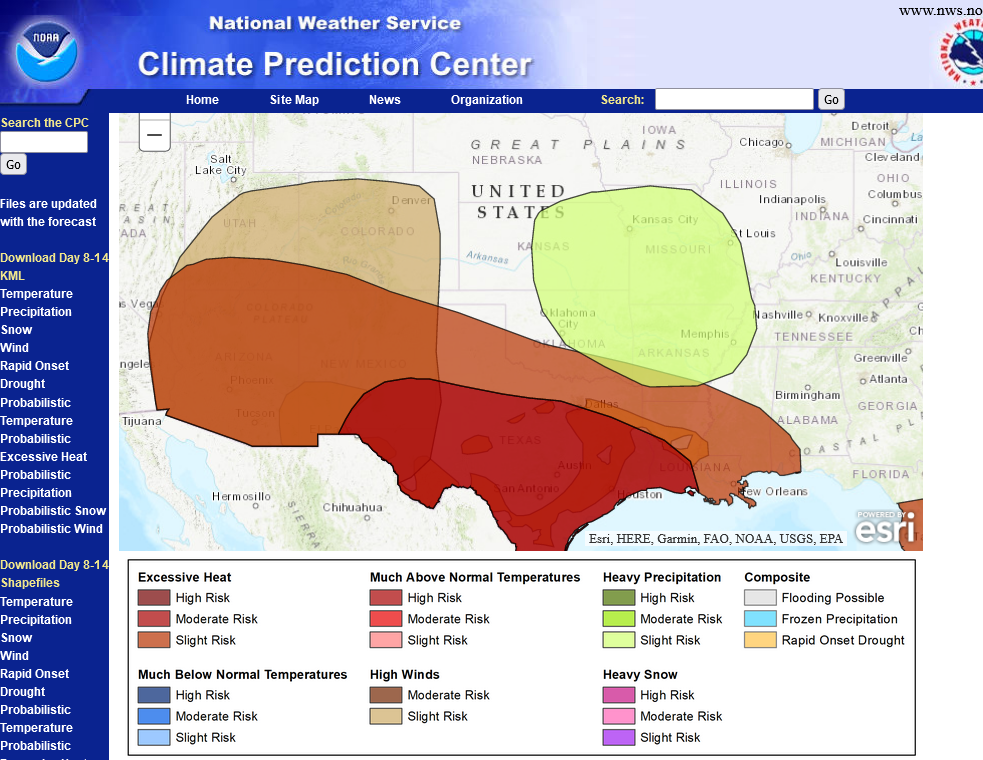
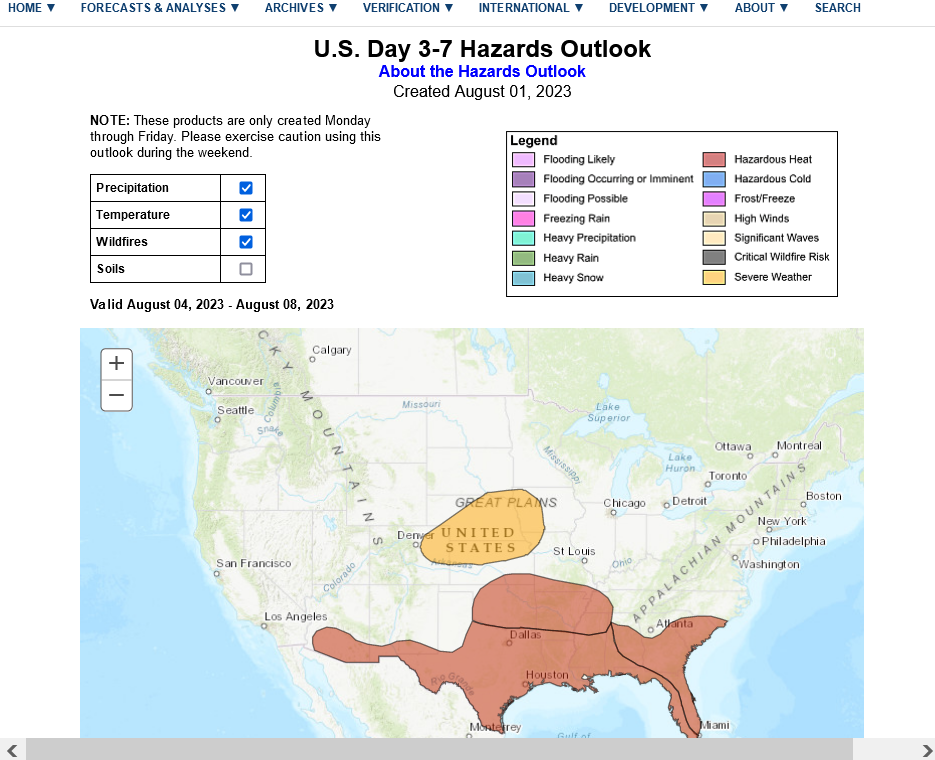
The NWS will probably increase this threat (in light green) in their update this afternoon for the 8-14 day period.
https://www.cpc.ncep.noaa.gov/products/predictions/threats/threats.php
This one from yesterday will be updated shortly too.
https://www.cpc.ncep.noaa.gov/products/predictions/threats/threats.php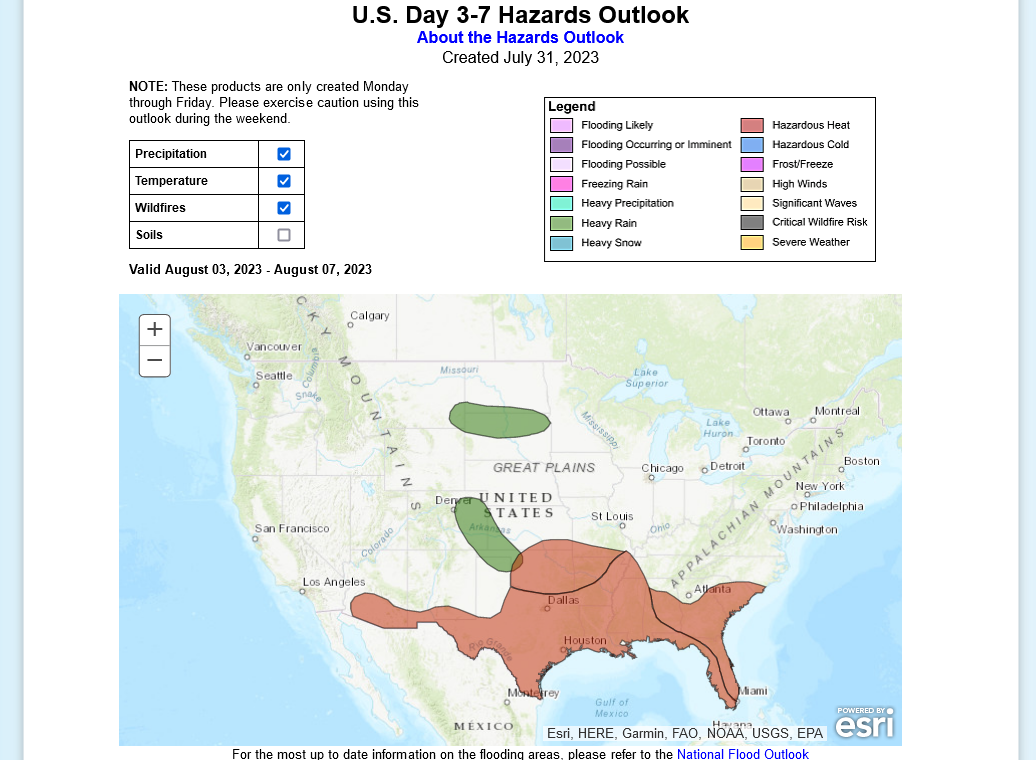
This was there Aug 1 update for 8-14 days. I zoomed in on it with this image.
It's a week 2 event and over extremely dry soils in much of that region(not AR), so it's just a slight risk right now.
This is probably going to eradicate the drought in that region.
https://www.cpc.ncep.noaa.gov/products/predictions/threats/threats.php
https://www.cpc.ncep.noaa.gov/products/Soilmst_Monitoring/US/Soilmst/Soilmst.shtml#
![]()


++++++++++++++++++++++++++++
Updated daily below:
https://mrcc.purdue.edu/cliwatch/watch.htm#curMonths

Most of the severe drought in the West has been wiped out!
https://droughtmonitor.unl.edu/
Last week, July 25, 2023

The just updated EE also increased rain amounts in the zone discussed above. It has shifted the heaviest rain zone farther northeast, including us in far sw Indiana.
I won't need to do any irrigating in August with this pattern.
Excessive rain threat.
https://www.wpc.ncep.noaa.gov/qpf/excess_rain.shtml
Current Day 1 Forecast
Day 1 Threat Area in Text Format
Current Day 2 Forecast |

In August, this is about as bearish as it gets!
Extended weather.
https://www.cpc.ncep.noaa.gov/products/predictions/610day/ | ||||||||
| 6 to 10 day outlooks | ||||||||
| Click below for information about how to read 6-10 day outlook maps Temperature Precipitation | ||||||||
| Click below for archives of past outlooks (data & graphics), historical analogs to todays forecast, and other formats of the 6-10 day outlooks ArchivesAnalogsLines-Only FormatGIS Data | ||||||||
Temperature Probability | ||||||||
Precipitation Probability | ||||||||
0z models were slightly cooler.
They shifted the heaviest rains slightly farther northeast and deeper into the Cornbelt.
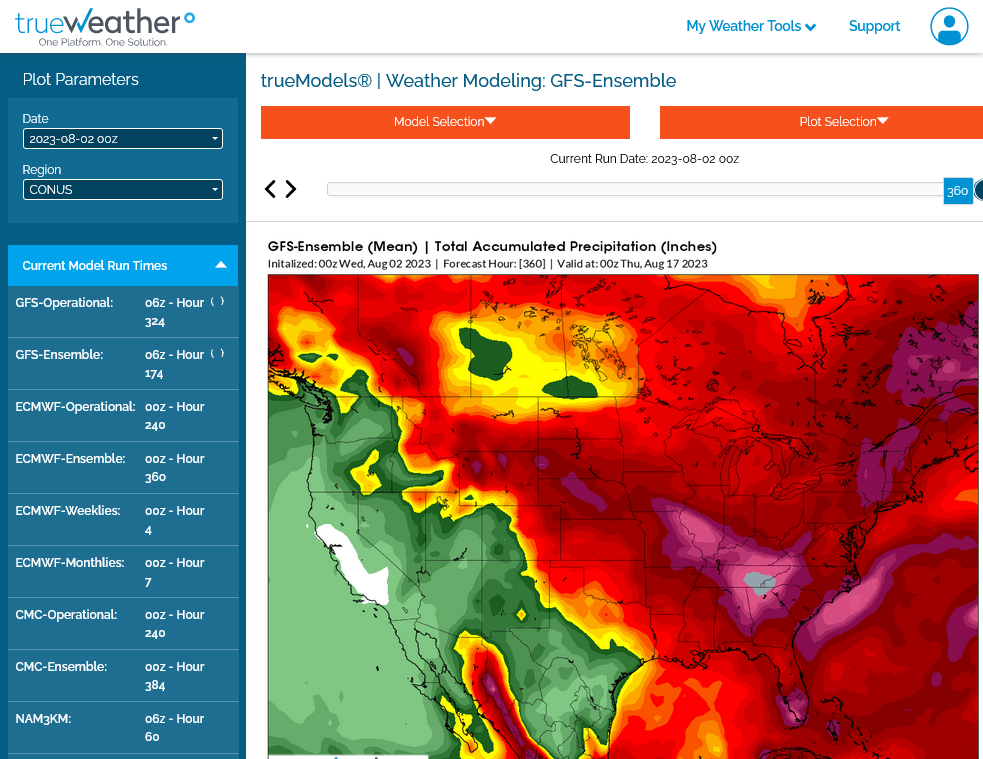
1. 0z GEFS rains 2 weeks
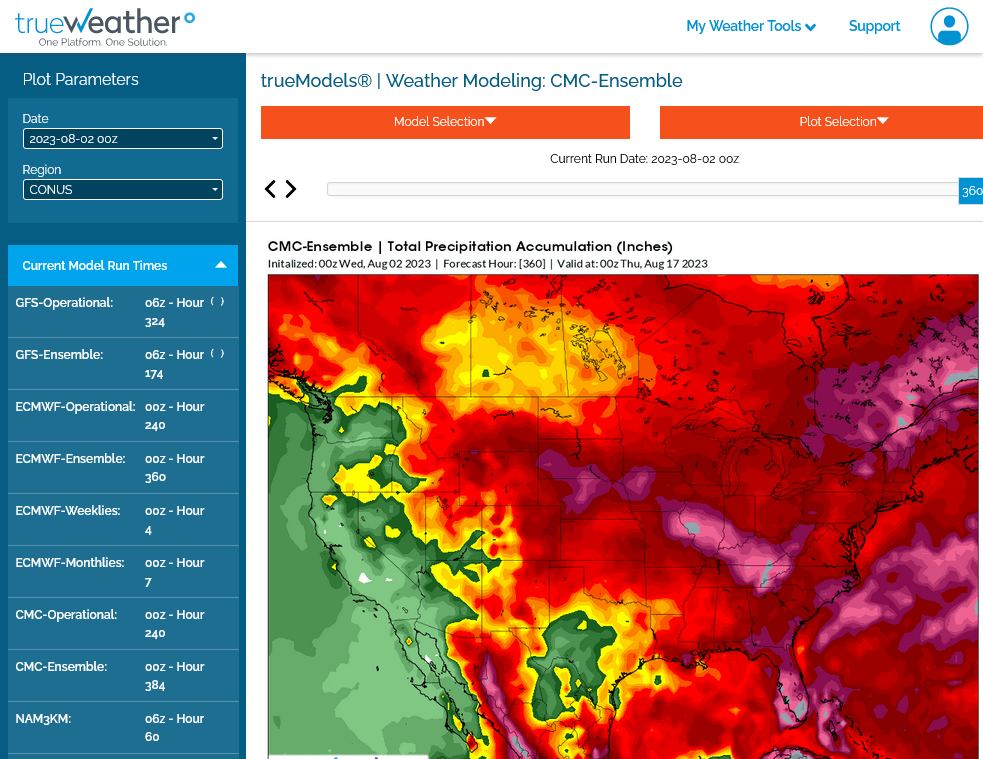
2. 0z Canadian model
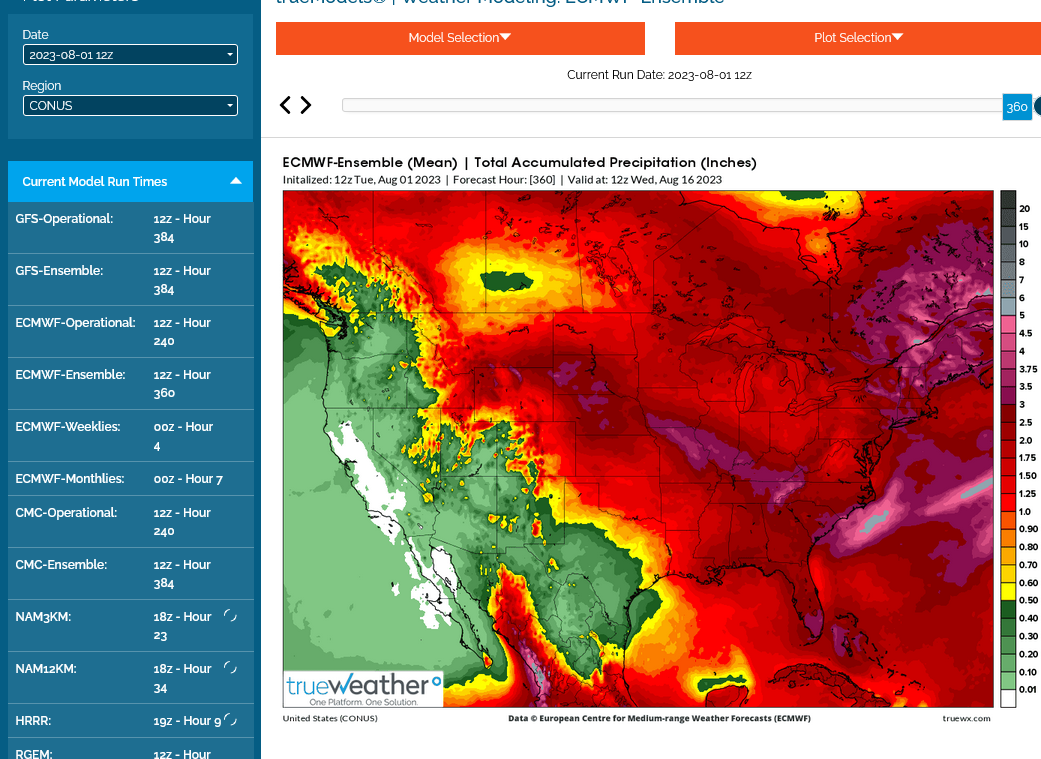
3. European model rains
4. 500 mb European model. Elongated trough over the Midwest.deeper than yesterday
5. 24 hour earlier 500 mb


