KEY EVENTS TO WATCH FOR:
Wednesday, August 2, 2023
7:00 AM ET. MBA Weekly Mortgage Applications Survey
Composite Idx (previous 206.9)
Composite Idx, W/W% (previous -1.8%)
Purchase Idx-SA (previous 159.2)
Purchase Idx-SA, W/W% (previous -2.5%)
Refinance Idx (previous 444.5)
Refinance Idx, W/W% (previous -0.4%)
8:15 AM ET. July ADP National Employment Report
Private Sector Jobs, Net Chg (expected +175000; previous +497000)
10:00 AM ET. 2nd Quarter U.S. Housing Vacancies
10:00 AM ET. June Metropolitan Area Employment and Unemployment
10:30 AM ET. EIA Weekly Petroleum Status Report
Crude Oil Stocks (Bbl) (previous 456.82M)
Crude Oil Stocks, Net Chg (Bbl) (previous -0.6M)
Gasoline Stocks (Bbl) (previous 217.6M)
Gasoline Stocks, Net Chg (Bbl) (previous -0.786M)
Distillate Stocks (Bbl) (previous 117.949M)
Distillate Stocks, Net Chg (Bbl) (previous -0.245M)
Refinery Usage (previous 93.4%)
Total Prod Supplied (Bbl/day) (previous 21.276M)
Total Prod Supplied, Net Chg (Bbl/day) (previous +0.509M)
The STOCK INDEXES? http://quotes.ino.com/ex?changes/?c=indexes
The STOCK INDEXES: The September NASDAQ 100 was lower overnight. Overnight trading sets the stage a lower opening when the day session begins trading. Stochastics and the RSI are turning neutral to bearish signaling that sideways to lower prices are possible near-term. Closes below the 20-day moving average crossing at 15,612.33 would confirm that a short-term top has been posted while opening the door for additional weakness near-term. If September renews this year's rally, the December-2021 high on the weekly continuation chart crossing at 16,659.50 is the next upside target. First resistance is the July 19th high crossing at 16,062.75. Second resistance is the December-2021 high on the weekly continuation chart crossing at 16,659.50. First support is the 20-day moving average crossing at 15,612.38. Second support is the 50-day moving average crossing at 15,145.86.
The September S&P 500 was was lower overnight. Overnight trading sets the stage for a lower opening when the day session begins trading. Stochastics and the RSI are turning bearish signaling that sideways to lower prices are possible near-term. Closes below the 20-day moving average crossing at 4549.66 would confirm that a short-term top has been posted. If June extends the rally off March's low, the 87% retracement level of the 2022 decline crossing at 4639.07 is the next upside target. First resistance is last-Thursday's high crossing at 4634.50. Second resistance is the 87% retracement level of the 2022 decline crossing at 4639.07. First support is the 20-day moving average crossing at 4549.66. Second support is the 50-day moving average crossing at 4434.57.
INTEREST RATES http://quotes.ino.com/ex changes/?c=interest"
INTEREST RATES: September T-bonds was slightly higher overnight as it consolidates some of Tuesday's sharp decline. Overnight trading sets the stage for a higher opening when the day session begins trading. Stochastics and the RSI are oversold but remain neutral to bearish signaling that sideways to lower prices are possible near-term. If September extends the decline off July's high, the February low on the weekly continuation chart crossing at 122-22 is the next downside target.Closes above the 50-day moving average crossing at 126-15 would signal that a low has been posted. First resistance is the 20-day moving average crossing at 125-09. Second resistance is the 50-day moving average crossing at 126-15. First support is Tuesday's low crossing at 122-26. Second support is the February low on the weekly continuation chart crossing at 122-22 is the next downside target.
September T-notes were higher overnight and sets the stage for a higher opening when the day session begins trading. Stochastics and the RSI are oversold but remain neutral to bearish signaling that sideways to lower prices are possible near-term. If September extends the decline off July's high, July's low crossing at 110.050 is the next downside target. Closes above the 20-day moving average crossing at 111.257 would signal that a short-term low has been posted. First resistance is the 50-day moving average crossing at 112.227. Second resistance is the 50% retracement level of the April-July decline crossing at 113.313. First support is Friday's low crossing at 110.255. Second support is July's low crossing at 110.050.
ENERGY MARKETS? http://quotes.ino.com/ex?changes/?c=energy ""
ENERGIES:Septembercrude oil was higher overnight as it extends the rally off May's low. Overnight trading sets the stage for a higher opening when the day session begins trading. Stochastics and the RSI are overbought but remain neutral to bullish signaling that sideways to higher prices are possible near-term. If September extends the rally off the June 28th low, the November-2022 high crossing at $83.59 is the next upside target. Closes below the 20-day moving average crossing at $77.08 would signal that a short-term top has been posted. First resistance is the overnight high crossing at $82.43. Second resistance is the November-2022 high crossing at $83.59. First support is the 10-day moving average crossing at 79.58. Second support is the 20-day moving average crossing at $77.08.
September heating oil was higher overnight as it extends the rally off May's low. Overnight trading sets the stage for a higher opening when the day session begins trading. Stochastics and the RSI are overbought but remain neutral to bullish signaling that sideways to higher prices are possible near-term. If September extends the rally off May's low, the 87% retracement level of the 2022-2023 decline crossing at 3.1313 is the next upside target. Closes below the 20-day moving average crossing at 2.7204 would signal that a short-term top has been posted. First resistance is the overnight high crossing at 3.0806. Second resistance is the 87% retracement level of the 2022-2023 decline crossing at 3.1313. First support is the 10-day moving average crossing at 2.8708. Second support is the 20-day moving average crossing at 2.7204.
September unleaded gas was higher overnight and sets the stage for a higher opening when the day session begins trading. Stochastics and the RSI are overbought but remain neutral to bullish signaling that sideways to higher prices are possible near-term. If September extends the rally off the June 23rd low, the October-2022 high on the weekly continuation chart crossing at 3.0221 is the next upside target. Closes below the 20-day moving average crossing at 2.7027 would signal that a short-term top has been posted. First resistance is last-Friday's high crossing at $2.9257. Second resistance is the October-2022 high on the weekly continuation chart crossing at $3.0221. First support is the 10-day moving average crossing at $2.8378. Second support is the 20-day moving average crossing at $2.7027.
September natural gas was slightly lower overnight and sets the stage for a slightly lower opening when the day session begins trading. Stochastics and the RSI are bearish signaling that sideways to lower prices are possible near-term. If September extends the decline off the July 25th high, the July 17th low crossing at 2.477 is the next downside target. If September renews the rally off the July 17th low, the June 26th high crossing at 2.911 is the next upside target. First resistance is the June 26th high crossing at 2.911. Second resistance is the 25% retracement level of the 2022-2023 decline crossing at 3.193. First support is the July 17th low crossing at 2.477. Second support is the June 1st low crossing at 2.249.
CURRENCIEShttp://quotes.ino.com/ex changes/?c=currencies"
CURRENCIES:The September Dollar was slightly lower overnight as it consolidates some of the rally off July's low. Overnight trading sets the stage for a slightly lower opening when the day session begins trading later this morning. Stochastics and the RSI are overbought but remain neutral to bullish signaling that sideways to higher prices are possible near-term. Closes above the 50-day moving average crossing at $102.097 would open the door for a possible test of July's high crossing at $103.275. Closes below the 20-day moving average crossing at $100.958 would signal that a short-term top has been posted. First resistance is the 50-day moving average crossing at $102.097. Second resistance is July's high crossing at $103.275. First support is the 10-day moving average crossing at $101.288. Second support is the 20-day moving average crossing at $100.957.
The September Euro was slightly higher overnight and sets the stage for a slightly higher opening when the day session begins trading. Stochastics and the RSI are oversold but remain neutral to bearish signaling that sideways to lower prices are possible near-term. If September extends the decline off July's high, the 50-day moving average crossing at 1.09707 is the next downside target. Closes above the 20-day moving average crossing at $1.11090 would temper the near-term bearish outlook in the market. First resistance is the 20-day moving average crossing at $1.11090. Second resistance is the July 18th high crossing at $1.13105. First support is the 50-day moving average crossing at 1.09707. Second support is last-Friday's low crossing at 1.09700.
The September British Pound was slightly higher overnight and sets the stage for a steady to slightly higher opening when the day session begins trading. Stochastics and the RSI are oversold but remain neutral to bearish signaling that sideways to lower prices near-term. If September extends the decline off July's high, the 50-day moving average crossing at 1.2718 is the next downside target. Closes above last-Thursday's high crossing at 1.2999 would confirm that a short-term low has been posted. First resistance last-Thursday's high crossing at 1.2999. Second resistance is the July 14th high crossing at 1.3146. First support is the 50-day moving average crossing at 1.2718. Second support is the June 29th low crossing at 1.2594.
The September Swiss Franc was lower overnight as it extends the decline off July's high. Overnight weakness sets the stage for a lower opening when the day session begins trading. Stochastics and the RSI are oversold but remain neutral to bearish signaling that sideways to lower prices are possible near-term. If September extends the decline off July's high, the 50-day moving average crossing at 1.13551 is the next downside target. Closes above the 10-day moving average crossing at 1.15724 would signal that a short-term low has been posted. First resistance is the 10-day moving average crossing at 1.15724. Second resistance is the July 18th high crossing at 1.17650. First support is the overnight low crossing at 1.14390. Second support is the 50-day moving average crossing at 1.13551.
The September Canadian Dollar was lower overnight as it extended the decline off July's high. Overnight trading sets the stage for a lower opening when the day session begins trading. Stochastics and the RSI are oversold but remain neutral to bearish signaling that sideways to lower prices are possible near-term. If September extends the decline off July's high, July's low crossing at $74.80 is the next downside target. Closes above the 20-day moving average crossing at $75.72 would signal that a short-term low has been posted. First resistance is the 20-day moving average crossing at $75.72. Second resistance is the 38% retracement level of the 2022-2023 decline crossing at $76.28. First support is the overnight low crossing at $75.14. Second support is July's low crossing at $74.78.
The September Japanese Yen was higher overnight as it consolidates some of the decline off last-Friday's high. Overnight trading sets the stage for a higher opening when the day session begins trading. Stochastics and the RSI are oversold but remain neutral to bearish signaling that sideways to lower prices are possible near-term. If September extends the decline off the July 14th high, June's low crossing at 0.069755 is the next downside target. Closes above the 50-day moving average crossing at 0.071864 would temper the near-term bearish outlook. First resistance is last-Friday's high crossing at 0.07315. Second resistance is the July14th high crossing at 0.073585. First support is Tuesday's low crossing at 0.070180. Second support is June's low crossing at 0.069755.
PRECIOUS METALS http://quotes.ino.com/ex changes/?c=metals"
Precious Metals: October gold was higher overnight and sets the stage for a higher opening when the day session begins trading later this morning. Stochastics and the RSI are neutral to bearish signaling that sideways to lower prices are possible near-term. If October extends the decline off July's high, the July 6th low crossing at $1927.60 is the next downside target. Closes above Monday's high crossing at $1991.00 would temper the near-term bearish outlook. First resistance is the July 20th high crossing at $2008.50. Second resistance is the 50% retracement level of the May-June decline crossing at $2015.80. First support is Tuesday's low crossing at $1959.00. Second support is the July 6th low crossing at $1927.60.
September silver was higher overnight and sets the stage for a higher opening when the day session begins trading later this morning. Stochastics and the RSI are neutral to bearish signaling that sideways to lower prices are possible near-term. Closes below the 50-day moving average crossing at $23.969 would signal that a short-term top has been posted. If July resumes the rally off June's low, the 75% retracement level of the May-June decline crossing at $25.561 is the next upside target. First resistance is July's high crossing at $25.475. Second resistance is the 75% retracement level of the May-June decline crossing at 25.561. First support is the July 27th low crossing at $24.180. Second support is the 50-day moving average crossing at $23.969.
September copper was lower overnight and sets the stage for a lower opening when the day session begins trading. Stochastics and the RSI are turning neutral to bearish signaling that sideways to lower prices are possible near-term. Closes below the 50-day moving average crossing at 3.8070 would signal that a short-term top has been posted. If September extends the rally off the June 29th low, April's high crossing at 4.1825 is the next upside target. First resistance Tuesday's high crossing at 4.0240. Second resistance is April's high crossing at 4.1825. First support is the 20-day moving average crossing at 3.8603. Second support is the 50-day moving average crossing at 3.8070.
GRAINS http://quotes.ino.com/ex changes/?c=grains
Grains: December corn was slightly higher overnight as it consolidates some of the decline off July's high. Overnight trading sets the stage for a slightly higher opening when the day sessions begins trading. Stochastics and the RSI are bearish signaling that sideways to lower prices are possible near-term. If December extends the decline off last-week's high, the July 16th low crossing at $5.02 is the next downside target. Closes above the 10-day moving average crossing at $5.36 1/2 would signal that a short-term low has been posted. First resistance is the 20-day moving average crossing at $5.23. Second resistance is the 50-day moving average crossing at $5.35 3/4. First support is the July 16th low crossing at $5.02. Second support is July's low crossing at $4.81.
September wheat was higher overnight as it consolidated some of the decline off July's high. Overnight trading sets the stage for a higher opening when the day session begins trading. Stochastics and the RSI are neutral to bearish signaling that sideways to lower prices are possible near-term. If September extends the aforementioned decline, the July 18th low crossing at $6.42 1/4 is the next downside target. Closes above the 10-day moving average crossing at $7.05 1/2 would signal that a short-term low has been posted. First resistance is the 20-day moving average crossing at $6.82 3/4. Second resistance is the 10-day moving average crossing at $7.05 1/2. First support is the July 18th low crossing at $6.42 1/4. Second support is July's low crossing at $6.22.
September Kansas City wheat was higher overnight as it consolidates some of the decline off July's high. Overnight trading sets the stage for a higher opening when the day session begins trading later this morning. Stochastics and the RSI are oversold but remain neutral to bearish signaling that sideways to lower prices are possible near-term. If September extends the decline off July's high, July's low crossing at $7.87 1/4 is the next downside target. Closes above the 10-day moving average crossing at $8.58 1/4 would signal that a low has been posted. First resistance is the 20-day moving average crossing at $8.41. Second resistance is the 10-day moving average crossing at $8.58 1/4. First support is the July 12th low crossing at $7.92. Second support is July's low crossing at $7.87 1/4.
September Minneapolis wheat was slightly higher overnight and sets the stage for a slightly higher opening when the day session begins trading. Stochastics and the RSI are oversold but remain neutral to bearish signaling that sideways to lower prices are possible near-term. Closes below the 50-day moving average crossing at $8.47 would open the door for additional weakness near-term. Closes above the 10-day moving average crossing at $8.92 would signal that a low has been posted. First resistance is the 20-day moving average crossing at $8.79 1/2. Second resistance is the 10-day moving average crossing at $8.92. First support is the 50-day moving average crossing at $8.47. Second support is July's low crossing at $8.07 1/4.
SOYBEAN COMPLEX? http://quotes.ino.com/ex?changes/?c=grains "
November soybeans was lower overnight and poised to extend this week's decline. Overnight trading sets the stage for a lower opening when the day session begins trading later this morning. Stochastics and the RSI are oversold but remain bearish signaling that sideways to lower prices are possible near-term. If November extends the decline off July's high, the 50-day moving average crossing at $12.97 1/2 is the next downside target. Closes above the 10-day moving average crossing at $13.85 would signal that a low has been posted. First resistance is Monday's gap crossing at $13.79. Second resistance is last-Monday's high crossing at $14.35. First support is Monday's low crossing at $13.22 3/4. Second support is the 50-day moving average crossing at $12.97 1/2.
December soybean meal was lower overnight and sets the stage for a lower opening when the day session begins trading. Stochastics and the RSI are becoming oversold but remain bearish signaling that sideways to lower prices are possible near-term. If December extends the decline off July's high, the 50-day moving average crossing at $391.10 is the next downside target. Closes above Monday's gap crossing at $392.40 would temper the bearish outlook. First resistance is Monday's gap crossing at $392.40. Second resistance is the 10-day moving average crossing at $407.50. First support is the 50-day moving average crossing at $391.10. Second support is the July 7th low crossing at $384.70.
December soybean oil was lower in overnight trading and sets the stage for a lower opening when the day session begins trading. Stochastics and the RSI remain bearish signaling that sideways to lower prices are possible near-term. If December extends the decline off July's high, the 50-day moving average crossing at 56.00 is the next downside target. Closes above the 10-day moving average crossing at 62.32 would temper the bearish outlook. First resistance is the 75% retracement level of the 2022-2023 decline crossing at 65.45. Second resistance is the 87% retracement level of the 2022-2023 decline crossing at 68.81. First support is the July 7th low crossing at 58.20. Second support is the 50-day moving average crossing at 56.00.
Thanks much, tallpine!
By metmike - Aug. 2, 2023, 7:13 a.m.
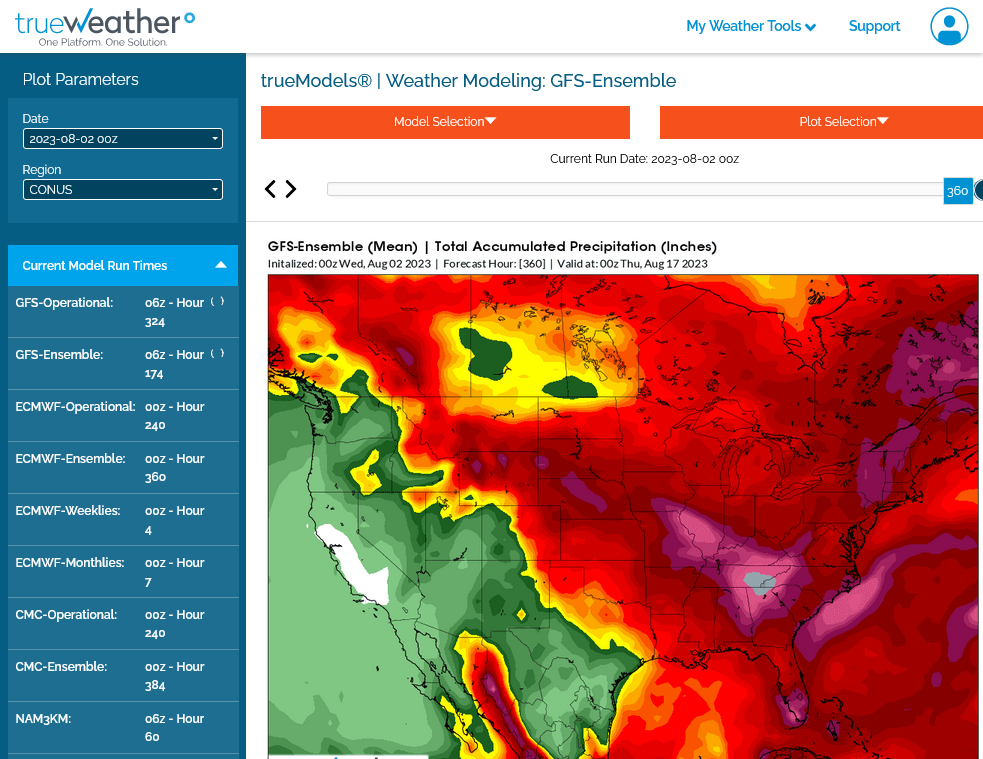
0z models were slightly cooler.
They shifted the heaviest rains slightly farther northeast and deeper into the Cornbelt.
1. 0z GEFS rains 2 weeks
2. 0z Canadian model
3. European model rains
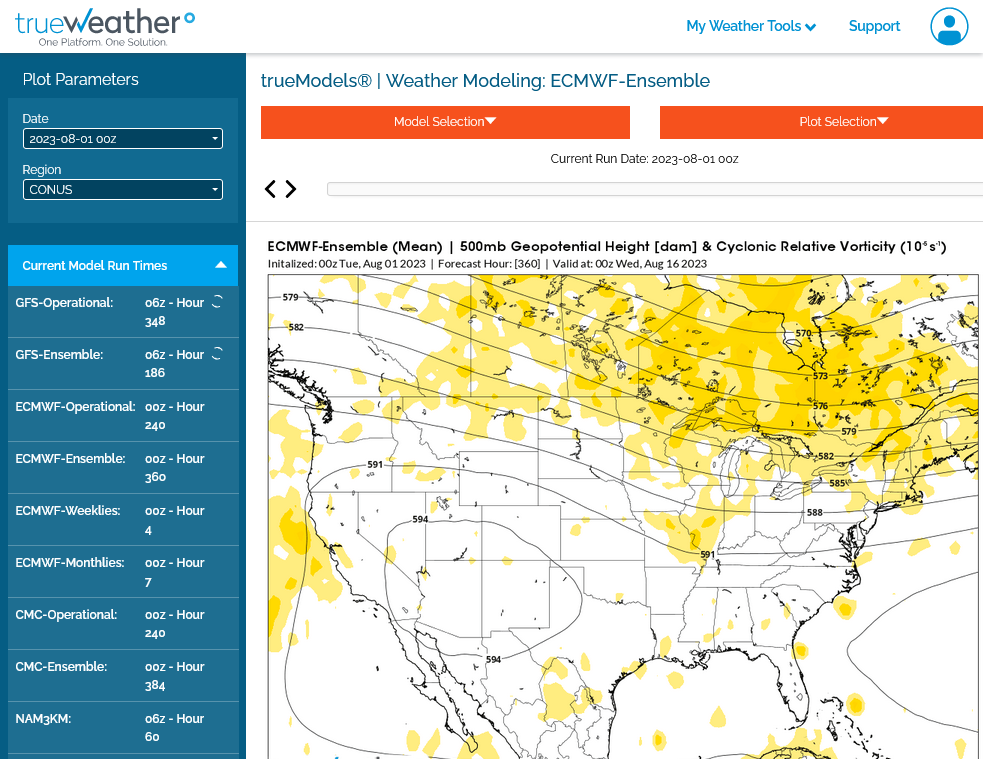
4. 500 mb European model. Elongated trough over the Midwest.deeper than yesterday
5. 24 hour earlier 500 mb


https://www.marketforum.com/forum/topic/83844/
The entire reason for the huge drop in beans are the huge rains falling now over the driest places.
To see rain amounts, go here: https://www.iweathernet.com/total-rainfall-map-24-hours-to-72-hours
You can scroll down and get almost the entire comprehensive weather picture updated constantly here.
Current Hazards at the link below.
Go to the link below, hit hazards box in the top right hand corner(it will also define all the color codes), if its not already in the hazards mode when you load the link.
Then you can hit any spot on the map, including where you live and it will go to that NWS with all the comprehensive local weather information for that/your county.

New radar product below
Go to: "Select View" then "Local Radar"
Hit the purple circle to see that local radar site
+++++++++++++++++++++++
This link below provides some great data. After going to the link, hit "Mesoanalysis" then, the center of any box for the area that you want, then go to observation on the far left, then surface observations to get constantly updated surface observations or hit another of the dozens of choices.
 |
Last Canadian model with individual ensembles continues bearish
384h GZ 500 forecast valid on Aug 18, 2023 12 UTC


Forecasts for the control (GEM 0) and the 20 ensemble