KEY EVENTS TO WATCH FOR:
Friday, August 4, 2023
8:30 AM ET. July U.S. Employment Report
Non-Farm Payrolls (expected +200K; previous +209K)
Unemployment Rate (expected 3.6%; previous 3.6%)
Avg Hourly Earnings (USD) (previous 33.58)
Avg Hourly Earnings-Net Chg (USD) (previous +0.12)
Avg Hourly Earnings, M/M% (expected +0.3%; previous +0.36%)
Avg Hourly Earnings, Y/Y% (expected +4.2%; previous +4.35%)
Overall Workweek (previous 34.4)
Overall Workweek Net Chg (previous +0.1)
Government Payrolls (previous +60K)
Private Payroll (previous +149K)
Participation Rate (previous 62.6%)
Non-Farm Payrolls Bench Net Chg
Monday, August 7, 2023
10:00 AM ET. July Employment Trends Index
ETI (previous 114.31)
ETI, Y/Y%
3:00 PM ET. June Consumer Credit
Consumer Credit Net Chg (USD) (previous +7.3B)
The STOCK INDEXES? http://quotes.ino.com/ex?changes/?c=indexes
The STOCK INDEXES: The September NASDAQ 100 was higher overnight as it consolidates some of this week's decline. Overnight trading sets the stage a higher opening when the day session begins trading. Stochastics and the RSI are oversold but remain neutral to bearish signaling that sideways to lower prices are possible near-term. If September extends the aforementioned decline, the 50-day moving average crossing at 15,201.35 is the next downside target. If September renews this year's rally, the December-2021 high on the weekly continuation chart crossing at 16,659.50 is the next upside target. First resistance is the July 19th high crossing at 16,062.75. Second resistance is the December-2021 high on the weekly continuation chart crossing at 16,659.50. First support is the 50-day moving average crossing at 15,201.35. Second support is July's low crossing at 15,063.25.
The September S&P 500 was was higher overnight as it consolidates some of this week's decline. Overnight trading sets the stage for a higher opening when the day session begins trading. Stochastics and the RSI are oversold but remain neutral to bearish signaling that sideways to lower prices are possible near-term. If September extends the decline off July's high, the 50-day moving average crossing at 4445.99 is the next downside target. If June renews the rally off March's low, the March-2022 high crossing at 4714.75 is the next upside target. First resistance is July's high crossing at 4634.50. Second resistance is the March-2022 high crossing at 4714.75. First support is the 50-day moving average crossing at 4445.99. Second support is July's low crossing at 4411.25.
INTEREST RATES http://quotes.ino.com/ex changes/?c=interest"
INTEREST RATES: September T-bonds were slightly higher overnight as they consolidate some of the decline off April's high. Overnight trading sets the stage for a slightly higher opening when the day session begins trading. Stochastics and the RSI are oversold but remain neutral to bearish signaling that sideways to lower prices are possible near-term. If September extends the decline off July's high, the October-2022 low on the weekly continuation chart crossing at 117-19 is the next downside target.Closes above the 20-day moving average crossing at 124-28 would signal that a low has been posted. First resistance is the 20-day moving average crossing at 124-28. Second resistance is the 50-day moving average crossing at 126-06. First support is Thursday's low crossing at 120-03. Second support is the October-2022 low on the weekly continuation chart crossing at 117-19 is the next downside target.
September T-notes were lower overnight and sets the stage for a lower opening when the day session begins trading. Stochastics and the RSI are oversold but remain neutral to bearish signaling that sideways to lower prices are possible near-term. If September extends the decline off July's high, the October-2022 low crossing at 108.265 is the next downside target. Closes above the 20-day moving average crossing at 111.236 would signal that a short-term low has been posted. First resistance is the 20-day moving average crossing at 111.236. Second resistance is the 50-day moving average crossing at 112.171. First support is July's low crossing at 110.050. Second support is the October-2022 low on the weekly continuation chart crossing at 108.265.
ENERGY MARKETS? http://quotes.ino.com/ex?changes/?c=energy ""
ENERGIES:Septembercrude oil was slightly high in late-overnight trading and sets the stage for a slightly higher opening when the day session begins trading. Stochastics and the RSI are overbought but remain neutral to bullish signaling that sideways to higher prices are possible near-term. If September extends the rally off the June 28th low, the 62% retracement level of the 2022-2023 decline crossing at $84.20 is the next upside target. Closes below the 20-day moving average crossing at $77.85 would signal that a short-term top has been posted. First resistance is Wednesday's high crossing at $82.43. Second resistance is the 62% retracement level of the 2022-2023 decline crossing at $84.20. First support is the 20-day moving average crossing at 77.85. Second support is the July 17th low crossing at $73.78.
September heating oil was steady to slightly higher overnight as it extends the rally off May's low. Overnight trading sets the stage for a slightly higher opening when the day session begins trading. Stochastics and the RSI are overbought but remain neutral to bullish signaling that sideways to higher prices are possible near-term. If September extends the rally off May's low, the 87% retracement level of the 2022-2023 decline crossing at 3.1313 is the next upside target. Closes below the 20-day moving average crossing at 2.7743 would signal that a short-term top has been posted. First resistance is the overnight high crossing at 3.0954. Second resistance is the 87% retracement level of the 2022-2023 decline crossing at 3.1313. First support is the 10-day moving average crossing at 2.9403. Second support is the 20-day moving average crossing at 2.7743.
September unleaded gas was higher overnight as it consolidates some of this week's decline. Overnight trading sets the stage for a higher opening when the day session begins trading. Stochastics and the RSI are neutral to bearish signaling that sideways to lower prices are possible near-term. Closes below the 20-day moving average crossing at 2.7256 would signal that a short-term top has been posted. If September renews the rally off the June 23rd low, the October-2022 high on the weekly continuation chart crossing at 3.0221 is the next upside target. First resistance is July's high crossing at $2.9257. Second resistance is the October-2022 high on the weekly continuation chart crossing at $3.0221. First support is the 20-day moving average crossing at $2.7256. Second support is the 50-day moving average crossing at $2.5367.
September natural gas was slightly lower overnight and sets the stage for a slightly lower opening when the day session begins trading. Stochastics and the RSI are neutral to bearish signaling that sideways to lower prices are possible near-term. If September extends the decline off the July 25th high, June's low crossing at 2.249 is the next downside target. Closes above the 10-day moving average crossing at 2.615 would temper the near-term bearish outlook. From a broad perspective, September natural gas remains locked in a long-term trading range that began in April. Closes below June's low crossing at 2.249 or above June's high crossing at 20911 are needed to mark a breakout of this extended trading range and point the direction of the next trending move. First resistance is the June 26th high crossing at 2.911. Second resistance is the 25% retracement level of the 2022-2023 decline crossing at 3.193. First support is Wednesday's low crossing at 2.457. Second support is the June 1st low crossing at 2.249.
CURRENCIEShttp://quotes.ino.com/ex changes/?c=currencies"
CURRENCIES:The September Dollar was slightly higher overnight as it extends the rally off July's low. Overnight trading sets the stage for a slightly higher opening when the day session begins trading later this morning. Stochastics and the RSI are overbought but remain neutral to bullish signaling that sideways to higher prices are possible near-term. If September extends the rally off July's low, July's high crossing at $103.275 is the next upside target. Closes below the 20-day moving average crossing at $100.972 would signal that a short-term top has been posted. First resistance is July's highcrossing at $103.275. Second resistance is May's high crossing at $104.205. First support is the 50-day moving average crossing at $102.049. Second support is the 10-day moving average crossing at $101.660.
The September Euro was steady to slightly lower overnight. Overnight trading sets the stage for a slightly lower opening when the day session begins trading. Stochastics and the RSI are oversold but remain neutral to bearish signaling that sideways to lower prices are possible near-term. If September extends the decline off July's high, July's low crossing at 1.08715 is the next downside target. Closes above the 20-day moving average crossing at $1.11076 would signal that a short-term low has been posted. First resistance is the 10-day moving average crossing at $1.10282. Second resistance is the 20-day moving average crossing at $1.11076. First support is July's low crossing at 1.08715. Second support is May's low crossing at 1.07025.
The September British Pound was steady to slightly lower overnight. Overnight trading sets the stage for a steady to slightly lower opening when the day session begins trading. Stochastics and the RSI are oversold but remain neutral to bearish signaling that sideways to lower prices near-term. If September extends the decline off July's high, the 50% retracement level of the March-July rally crossing at 1.2508 is the next downside target. Closes above the 20-day moving average crossing at 1.2896 would confirm that a short-term top has been posted. First resistance the 10-day moving average crossing at 1.2809. Second resistance is the 20-day moving average crossing at 1.2896. First support is the 38% retracement level of the March-July rally crossing at 1.2658. Second support is the 50% retracement level of the March-July rally crossing at 1.2508.
The September Swiss Franc was lower overnight and sets the stage for a lower opening when the day session begins trading. Stochastics and the RSI are oversold but remain neutral to bearish signaling that sideways to lower prices are possible near-term. If September extends the decline off July's high, the 50-day moving average crossing at 1.13631 is the next downside target. Closes above the 20-day moving average crossing at 1.15833 would signal that a short-term low has been posted. First resistance is the 20-day moving average crossing at 1.15833. Second resistance is the July 18th high crossing at 1.17650. First support is the 50-day moving average crossing at 1.13631. Second support is the June 30th low crossing at 1.11790.
The September Canadian Dollar was lower overnight as it extended the decline off July's high. Overnight trading sets the stage for a lower opening when the day session begins trading. Stochastics and the RSI are oversold but remain neutral to bearish signaling that sideways to lower prices are possible near-term. If September extends the decline off July's high, the 50% retracement level of the March-July rally crossing at $74.48 is the next downside target. Closes above the 20-day moving average crossing at $75.68 would signal that a short-term low has been posted. First resistance is the 50-day moving average crossing at $75.33. Second resistance is the 20-day moving average crossing at $75.68. First support is July's low crossing at $74.80. Second support is the 50% retracement level of the March-July rally crossing at $74.48.
The September Japanese Yen was slightly lower overnight. Overnight trading sets the stage for a slightly lower opening when the day session begins trading. Stochastics and the RSI are oversold but remain neutral to bearish signaling that sideways to lower prices are possible near-term. If September extends the decline off the July 14th high, June's low crossing at 0.069755 is the next downside target. Closes above the 50-day moving average crossing at 0.071740 would signal that a short-term low has been posted. First resistance is last-Friday's high crossing at 0.07315. Second resistance is the July 14th high crossing at 0.073585. First support is Thursday's low crossing at 0.069970. Second support is June's low crossing at 0.069755.
PRECIOUS METALS http://quotes.ino.com/ex changes/?c=metals"
Precious Metals: October gold was steady to slightly lower overnight as it extends the decline off July's high. Overnight trading sets the stage for a slightly lower opening when the day session begins trading later this morning. Stochastics and the RSI are oversold bur remain neutral to bearish signaling that sideways to lower prices are possible near-term. If October extends the decline off July's high, the July 6th low crossing at $1927.60 is the next downside target. Closes above Monday's high crossing at $1991.00 would temper the near-term bearish outlook. First resistance is the July 20th high crossing at $2008.50. Second resistance is the 50% retracement level of the May-June decline crossing at $2015.80. First support is the July 6th low crossing at $1927.60. Second support is June's low crossing at $1919.60.
September silver was lower overnight and sets the stage for a lower opening when the day session begins trading later this morning. Stochastics and the RSI are oversold but remain neutral to bearish signaling that sideways to lower prices are possible near-term. If September extends the decline off July's high, July's low crossing at $22.720 is the next downside target. Closes above the 20-day moving average crossing at $24.510 would signal that a short-term low has been posted. First resistance is the 20-day moving average crossing at $24.510. Second resistance is July's high crossing at $25.475. First support is July's low crossing at $22.720. Second support is June's low crossing at $22.340.
September copper was lower overnight and sets the stage for a lower opening when the day session begins trading. Stochastics and the RSI are bearish signaling that sideways to lower prices are possible near-term. Closes below the 50-day moving average crossing at 3.8137 would signal that a short-term top has been posted. If September renews the rally off the June 29th low, April's high crossing at 4.1825 is the next upside target. First resistance Tuesday's high crossing at 4.0240. Second resistance is April's high crossing at 4.1825. First support is the 50-day moving average crossing at 3.8137. Second support is July's low crossing at 3.7225.
GRAINS http://quotes.ino.com/ex changes/?c=grains
Grains: December corn was higher overnight as it consolidates some of the decline off July's high. Overnight trading sets the stage for a higher opening when the day sessions begins trading. Stochastics and the RSI are oversold but remain bearish signaling that sideways to lower prices are possible near-term. If December extends the decline off last-week's high, July's low crossing at $4.81 is the next downside target. Closes above the 50-day moving average crossing at $5.35 1/4 would signal that a short-term low has been posted. First resistance is the 20-day moving average crossing at $5.22 1/4. Second resistance is the 50-day moving average crossing at $5.35 1/4. First support is the overnight low crossing at $4.93. Second support is July's low crossing at $4.81.
September wheat was higher overnight as it consolidated some of the decline off July's high. Overnight trading sets the stage for a higher opening when the day session begins trading. Stochastics and the RSI are oversold but remain neutral to bearish signaling that sideways to lower prices are possible near-term. If September extends the aforementioned decline, the July 18th low crossing at $6.42 1/4 is the next downside target. Closes above the 10-day moving average crossing at $6.88 1/4 would signal that a short-term low has been posted. First resistance is the 50-day moving average crossing at $6.68 1/2. Second resistance is the 20-day moving average crossing at $6.80. First support is July's low crossing at $6.22. Second support is May's low crossing at $5.87 3/4.
September Kansas City wheat was higher overnight as it consolidates some of the decline off July's high. Overnight trading sets the stage for a higher opening when the day session begins trading later this morning. Stochastics and the RSI are oversold but remain neutral to bearish signaling that sideways to lower prices are possible near-term. If September extends the decline off July's high, the May 31st low crossing at $7.61 3/4 is the next downside target. Closes above the 10-day moving average crossing at $8.36 3/4 would signal that a low has been posted. First resistance is the 50-day moving average crossing at $8.23 1/4. Second resistance is the 20-day moving average crossing at $8.33 3/4. First support is Thursday's low crossing at $7.63 3/4. Second support is the May 31st low crossing at $7.61 3/4.
September Minneapolis wheat was higher overnight and sets the stage for a higher opening when the day session begins trading. Stochastics and the RSI are oversold but remain neutral to bearish signaling that sideways to lower prices are possible near-term. If September extends the decline off July's high, July's low crossing at $8.07 1/4 is the next downside target. Closes above the 10-day moving average crossing at $8.80 would signal that a low has been posted. First resistance is the 20-day moving average crossing at $8.77 3/4. Second resistance is the 10-day moving average crossing at $8.80. First support is July's low crossing at $8.07 1/4. Second support is the June 14th low crossing at $8.01 1/4.
SOYBEAN COMPLEX? http://quotes.ino.com/ex?changes/?c=grains "
November soybeans was higher overnight as it consolidates some of the decline off July's high. Overnight trading sets the stage for a higher opening when the day session begins trading later this morning. Stochastics and the RSI are oversold but remain bearish signaling that sideways to lower prices are possible near-term. If November extends the decline off July's high, the 50-day moving average crossing at $13.03 is the next downside target. Closes above the 10-day moving average crossing at $13.76 3/4 would signal that a low has been posted. First resistance is Monday's gap crossing at $13.79. Second resistance is July's high crossing at $14.35. First support is Wednesday's low crossing at $13.15. Second support is the 50-day moving average crossing at $13.03.
December soybean meal was higher overnight as it extends this week's trading range. Overnight trading sets the stage for a higher opening when the day session begins trading. Stochastics and the RSI are neutral to bearish signaling that sideways to lower prices are possible near-term. If December extends the decline off July's high, the July 7th low crossing at $384.70 is the next downside target. Closes above Monday's gap crossing at $392.40 would temper the bearish outlook. First resistance is Monday's gap crossing at $392.40. Second resistance is the 10-day moving average crossing at $405.30. First support is the 50-day moving average crossing at $391.80. Second support is the July 7th low crossing at $384.70.
December soybean oil was higher in overnight trading as it extends this week's trading range. Overnight trading sets the stage for a higher opening when the day session begins trading. Stochastics and the RSI are neutral to bearish signaling that sideways to lower prices are possible near-term. If December extends the decline off July's high, the 50-day moving average crossing at 56.51 is the next downside target. Closes above the 10-day moving average crossing at 61.93 would temper the bearish outlook. First resistance is the 75% retracement level of the 2022-2023 decline crossing at 65.45. Second resistance is the 87% retracement level of the 2022-2023 decline crossing at 68.81. First support is the July 7th low crossing at 58.20. Second support is the 50-day moving average crossing at 56.51.
Thanks much tallpine!
Still plenty of rain and mild temps the next 2 weeks.
1. GEFS rains the next 2 weeks
2. Canadian model
3. European model

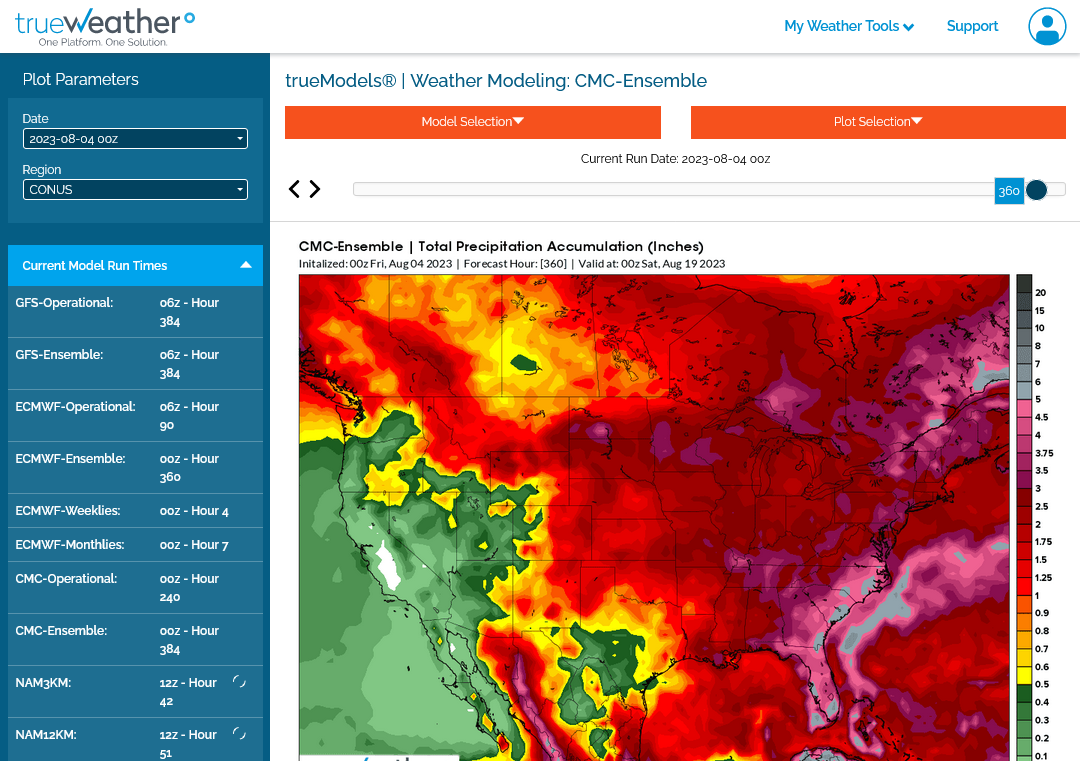
4. Upper levels European model in 2 weeks.
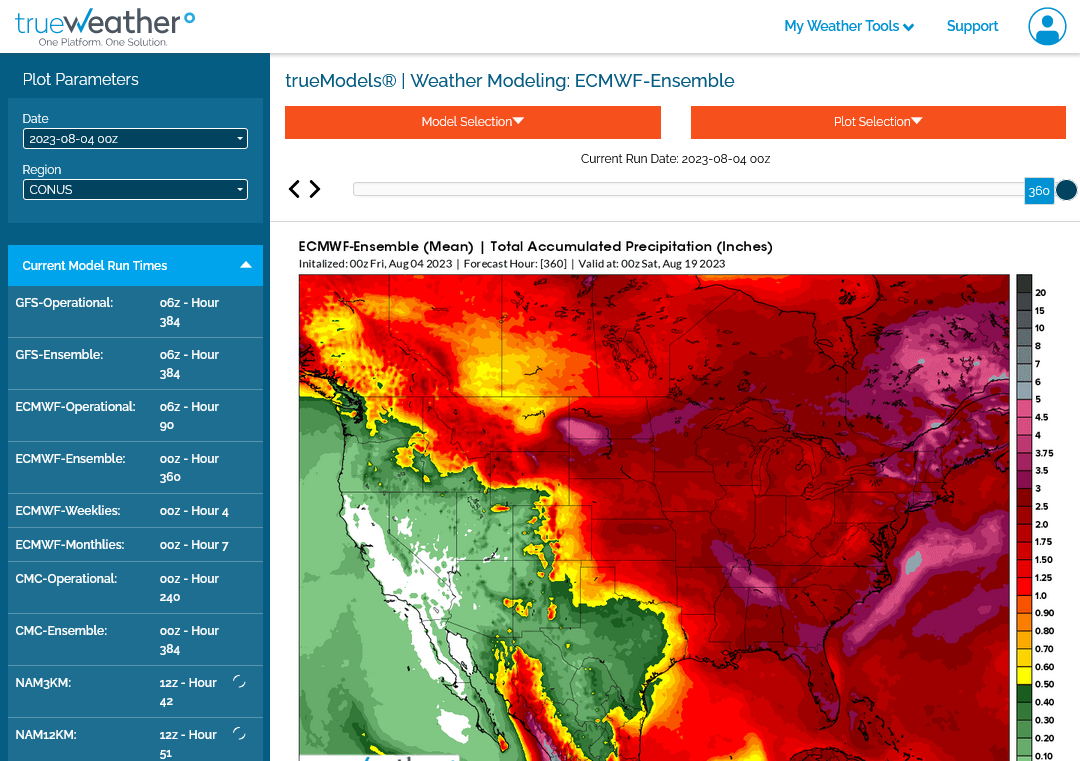
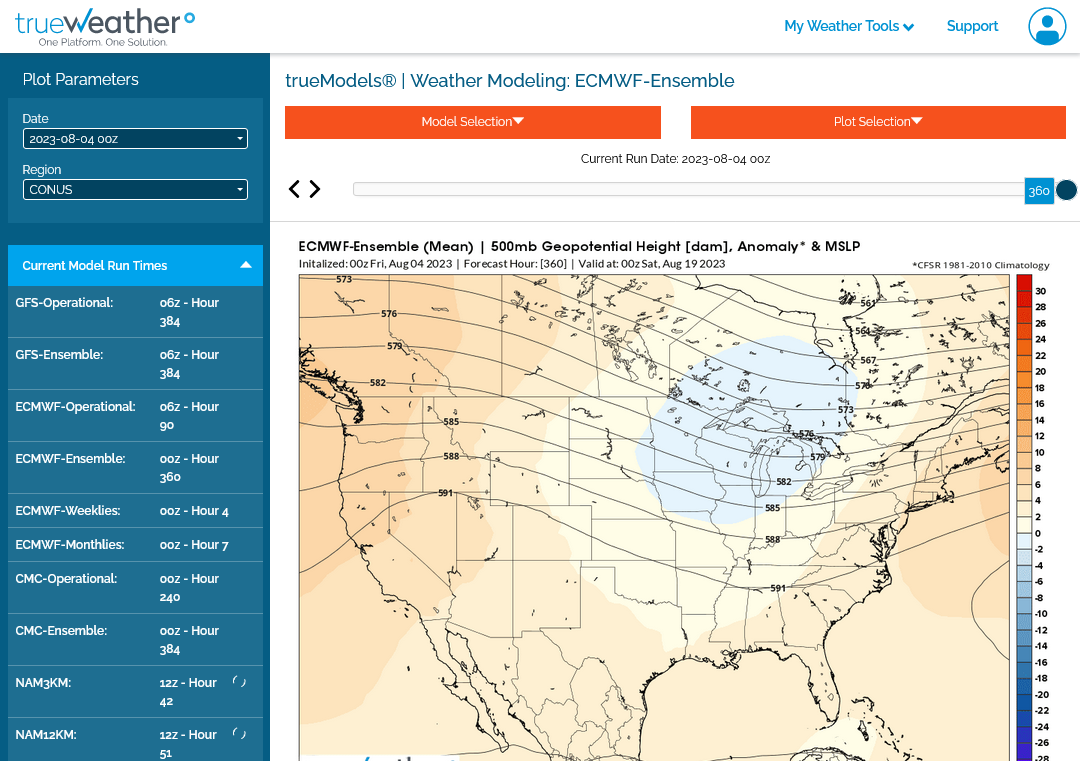
This time of year, what matters most is rains. However, this bearish forecast has dominated all week(bearish downside breakaway gap lower Sunday Night)
So there's no reason on Friday to dial in something that the market has known all week.
Weather maps now.
In 24 hours and
In 48 hours.
https://www.wpc.ncep.noaa.gov/#

+++++++++++++++++++++++++++++++++++++++++++++++++
Surface Weather maps for days 3-7 below:
https://www.wpc.ncep.noaa.gov/medr/medr.shtml

+++++++++++++++++++++++++++++++++++++++++++
The latest 7 day precip forecasts are below.
Day 1 below:
http://www.wpc.ncep.noaa.gov/qpf/fill_94qwbg.gif?1526306199054

Day 2 below:
http://www.wpc.ncep.noaa.gov/qpf/fill_98qwbg.gif?1528293750112

Day 3 below:
http://www.wpc.ncep.noaa.gov/qpf/fill_99qwbg.gif?1528293842764

Days 4-5 below:
http://www.wpc.ncep.noaa.gov/qpf/95ep48iwbg_fill.gif?1526306162

Days 6-7 below:
http://www.wpc.ncep.noaa.gov/qpf/97ep48iwbg_fill.gif?1526306162

7 Day Total precipitation below:
http://www.wpc.ncep.noaa.govcdx /qpf/p168i.gif?1530796126

Excessive rain threat.
https://www.wpc.ncep.noaa.gov/qpf/excess_rain.shtml
Current Day 1 Forecast
Day 1 Threat Area in Text Format
Current Day 2 Forecast |

Just updated 12z Canadian model.
Not a great deal of change, however a significant minority of the members turn pretty bullish in 2 weeks.
https://weather.gc.ca/ensemble/charts_e.html?Hour=384&Day=0&RunTime=12&Type=gz
384h GZ 500 forecast valid on Aug 20, 2023 12UTC

Forecasts for global GEM, control (GEM 0) and the 20 ensemble members


