KEY EVENTS TO WATCH FOR:
Wednesday, August 9, 2023
7:00 AM ET. MBA Weekly Mortgage Applications Survey
Composite Idx (previous 200.7)
Composite Idx, W/W% (previous -3.0%)
Purchase Idx-SA (previous 154.1)
Purchase Idx-SA, W/W% (previous -3.2%)
Refinance Idx (previous 433.6)
Refinance Idx, W/W% (previous -2.5%)
10:00 AM ET. July Online Help Wanted Index
10:00 AM ET. SEC Closed Meeting
10:30 AM ET. EIA Weekly Petroleum Status Report
Crude Oil Stocks (Bbl) (previous 439.771M)
Crude Oil Stocks, Net Chg (Bbl) (previous -17.049M)
Gasoline Stocks (Bbl) (previous 219.081M)
Gasoline Stocks, Net Chg (Bbl) (previous +1.481M)
Distillate Stocks (Bbl) (previous 117.153M)
Distillate Stocks, Net Chg (Bbl) (previous -0.796M)
Refinery Usage (previous 92.7%)
Total Prod Supplied (Bbl/day) (previous 20.023M)
Total Prod Supplied, Net Chg (Bbl/day) (previous -1.253M)
The STOCK INDEXES? http://quotes.ino.com/ex?changes/?c=indexes
The Dow closed lower on Tuesday. The high-range close sets the stage for a steady to slightly lower opening when Wednesday's day session begins trading. Stochastics and the RSI are neutral to bearish signaling that sideways to lower prices are possible near-term. Closes below the 20-day moving average crossing at 35,144.38 would confirm that a short-term top has been posted. If the Dow renews the rally off July's low, the February-2022 high crossing at 35,824.28 is the next upside target. First resistance is last-Tuesday's high crossing at 35,679.13. Second resistance is the February-2022 high crossing at 35,824.28. First support is the 20-day moving average crossing at 35,144.38. Second support is the 50-day moving average crossing at 34,370.03.
The September NASDAQ 100 closed lower on Tuesday as it extended the decline off July's high. The mid-range close sets the stage for a steady to lower opening when Wednesday's night session begins trading. Stochastics and the RSI are oversold but remain neutral to bearish signaling sideways to lower prices are possible. If September extends last-week's decline, the 50-day moving average crossing at 15,255.10 is the next downside target. If September renews this year's rally, the December-2021 high on the weekly continuation chart crossing at 16,659.50 is the next upside target. First resistance is the July 19th high crossing at 16,062.75. Second resistance is the December-2021 high on the weekly continuation chart crossing at 16,659.50. First support is the 50-day moving average crossing at 15,255.10. Second support is July's low crossing at 15,063.25.
The September S&P 500 closed lower on Tuesday as it extends the decline off July's high. The mid-range close sets the stage for a steady to lower opening when Wednesday's night session begins trading. Stochastics and the RSI are oversold but remain neutral to bearish signaling that sideways to lower prices are possible near-term. If September extends last-week's decline the 50-day moving average crossing at 4458.79 is the next downside target. If September renews the rally off March's low, the 87% retracement level of the 2022 decline on the weekly chart crossing at 4639.37 is the next upside target. First resistance is July's high crossing at 4634.50. Second resistance is the 87% retracement level of the 2022 decline on the weekly chart crossing at 4639.37. First support is the 50-day moving average crossing at 4458.79. Second support is July's low crossing at 4411.25.
INTEREST RATES? http://quotes.ino.com/ex?changes/?c=interest ""
September T-bonds closed up 27/32's at 122-13.
September T-bonds closed higher on Tuesday. The mid-range close sets the stage for a steady to higher opening when Wednesday's day session begins trading. Stochastics and the RSI are turning neutral to bullish signaling that sideways to higher prices are possible near-term. Closes above the 20-day moving average crossing at 124-23 would signal that a short-term low has been posted. If September extends the decline off July's high, the 50% retracement level of the 1980-2020 rally on the monthly continuation chart crossing at 118-21 is the next downside target. First resistance is the 20-day moving average crossing at 124-23. Second resistance is the 50-day moving average crossing at 126-01. First support is last-Friday's low crossing at 119-25. Second support is the 50% retracement level of the 1980-2020 rally on the monthly continuation chart crossing at 118-21.
September T-notes closed up 100-pts. at 111.140.
September T-notes closed slightly higher on Tuesday as it consolidated some of the decline off July's high. The mid-range close sets the stage for a steady to higher opening when Wednesday's day session begins trading. Stochastics and the RSI are neutral to bullish signaling that sideways to higher prices are possible near-term. Closes above the 20-day moving average crossing at 111.254 would signal that a short-term low has been posted. If September extends the decline off July's high, the October-2022 low crossing at 108.265 is the next downside target. First resistance is the 20-day moving average crossing at 111.254. Second resistance is the 50-day moving average crossing at 112.145. First support is last-Friday's low crossing at 109.240. Second support is the October-2022 low crossing at 108.265.
ENERGY MARKETS? http://quotes.ino.com/ex?changes/?c=energy ""
September crude oil closed higher on Tuesday as it extends the rally off June's low. The high-range close sets the stage for a steady to higher opening when Wednesday's day session begins. Stochastics and the RSI are overbought, diverging but remain neutral to bullish signaling that sideways to higher prices are possible near-term. If September extends the rally off June's low, the 62% retracement level of the 2022-2023 decline on the weekly chart crossing at $84.20 is the next upside target. Closes below the 20-day moving average crossing at $78.76 would signal that a short-term top has been posted. First resistance Monday's high crossing at $83.30. Second resistance is the 62% retracement level of the 2022-2023 decline on the weekly chart crossing at $84.20. First support is the 20-day moving average crossing at $78.76. Second support is the 50-day moving average crossing at $73.97.
September heating oil closed higher on Tuesday as it extends the trading range of the past five-days. The high-range close sets the stage for a steady to higher opening when Wednesday's day trading session begins. Stochastics and the RSI are overbought but remain neutral to bullish signaling that sideways to higher prices are possible near-term. If September extends the rally off May's low, the 87% retracement level of the 2022-2023 decline crossing at 3.1313 is the next upside target. Closes below the 20-day moving average crossing at 2.8226 would signal that a short-term top has been posted. First resistance is last-Friday's high crossing at 3.0954. Second resistance is the 87% retracement level of the 2022-2023 decline crossing at 3.1313. First support is the 10-day moving average crossing at 2.9944. Second support the 20-day moving average crossing at 2.8226.
September unleaded gas closed higher on Tuesday as it consolidated some of last-week's decline. The high-range close sets the stage for a steady to higher opening when Wednesday's day session begins trading. Stochastics and the RSI are turning neutral to bullish signaling that sideways to higher prices are possible near-term. If September renews the rally off the June 23rd low, the October-2022 high on the weekly continuation chart crossing at 3.0221 is the next upside target. Closes below last-Thursday's low crossing at 2.7131 would confirm that a short-term top has been posted while opening the door for additional weakness near-term. First resistance is July's high crossing at 2.9257. Second resistance is the October-2022 high on the weekly continuation chart crossing at 3.0221. First support is last-Thursday's low crossing at 2.7131. Second support is the 50-day moving average crossing at 2.5517.
September Henry natural gas closed higher on Tuesday as it extends the rally off last-Wednesday's low.The high-range close sets the stage for a steady to higher opening when Wednesday's day session begins trading. Stochastics and the RSI are neutral to bullish signaling that sideways to higher prices are possible near-term. If September extends the rally off last-Wednesday's low, June's high crossing at 2.911 is the next upside target. Closes below last-Wednesday's low crossing at 2.457 would open the door for a possible test of June's low crossing at 2.249. First resistance is the June high crossing at 2.911. Second resistance is the 25% retracement level of the 2022-2023 decline crossing at 3.193. First support is last-Wednesday's low crossing at 2.457. Second support is the June 1st low crossing at 2.249.
CURRENCIES? http://quotes.ino.com/ex?changes/?c=currencies ""
The September Dollar closed higher on Tuesday. The high-range close sets the stage for a steady to higher opening when Wednesday's session begins trading. Stochastics and the RSI are overbought but remain neutral to bullish signaling that sideways to higher prices are possible near-term. If September extends the rally off July's low, July's high crossing at 103.275 is the next upside target. Closes below the 20-day moving average crossing at 101.002 would signal that a short-term top has been posted. First resistance is July's high crossing at 103.275. Second resistance is May's high crossing at 104.205. First support is the 20-day moving average crossing at 101.002. Second support is the July 27th low crossing at 100.320.
The September Euro closed lower on Tuesday. The low-range close sets the stage for a steady to lower opening when Wednesday's day session begins trading. Stochastics and the RSI are oversold but remain neutral to bearish signaling that sideways to lower prices are possible near-term. If September extends the decline off July's high, July's low crossing at 1.08715 is the next downside target. Closes above the 20-day moving average crossing at 1.11078 would temper the near-term bearish outlook. First resistance is the 20-day moving average crossing at 1.11078. Second resistance is the July 27th high crossing at $1.11770. First support is last-Thursday's low crossing at $1.09425. Second support is July's low crossing at 1.08715.
The September British Pound closed lower on Tuesday. The high-range close sets the stage for a steady to slightly lower opening when Wednesday's day session begins trading. Stochastics and the RSI are neutral to bullish signaling sideways to higher prices are possible near-term. Closes above the 20-day moving average crossing at 1.2886 would signal that a short-term low has been posted. If September renews the decline off July's high, the 50% retracement level of the March-July rally crossing at 1.2508 is the next downside target. First resistance is the 10-day moving average crossing at 1.2796. Second resistance is the 20-day moving averagecrossing at 1.2886. First support is last-Thursday's low crossing at 1.2683. Second support is the June 29th low crossing at 1.2594.
The September Swiss Franc closed lower on Tuesday. The mid-range close sets the stage for a steady to lower opening when Wednesday's day session begins trading. Stochastics and the RSI are turning neutral to bullish hinting that a low might be in or is near. Closes above the 20-day moving average crossing at 1.15943 would signal that a short-term low has been posted. If September extends the decline off July's high, the 50-day moving average crossing at 1.13767 is the next downside target. First resistance is the 20-day moving average crossing at 1.15943. Second resistance is the July 18th high crossing at 1.17650. First support is last-Wednesday's low crossing at 1.14130. Second support is the 50-day moving average crossing at 1.13767.
The September Canadian Dollar closed lower on Tuesday as it extends the decline off July's high. The mid-range close sets the stage for a steady to higher opening when Wednesday's day session begins trading. Stochastics and the RSI are oversold but remain neutral to bearish signaling that sideways to lower prices are possible near-term. If September extends the decline off July's high, the 62% retracement level of the March-July rally crossing at 74.01 is the next downside target. Closes above the 20-day moving average crossing at 75.60 would signal that a short-term low has been posted. First resistance is the 50-day moving average crossing at 75.38. Second resistance is the 20-day moving average crossing at 75.60. First support is the 50% retracement level of the March-July rally crossing at 74.48. Second support is the 62% retracement level of the March-July rally crossing at 74.01.
The September Japanese Yen closed lower on Tuesday. The low-range close sets the stage for a steady to lower opening when Wednesday’s day session begins trading. Stochastics and the RSI are oversold but remain neutral to bearish signaling that sideways to lower prices are possible near-term. Closes above the 50-day moving average crossing at 0.071647 would signal that a short-term low has been posted. If September extends the decline off July's high, June's low crossing at 0.069755 is the next downside target. First resistance is the 50-day moving average crossing at 0.071647. Second resistance is the July 28th high crossing at 0.073015. First support is last-Thursday's low crossing at 0.069970. Second support is June's low crossing at 0.069755.
PRECIOUS METALS? http://quotes.ino.com/ex?changes/?c=metals ""
December gold closed lower on Tuesday. The low-range close sets the stage for a steady to lower opening when Wednesday's day session begins trading. Stochastics and the RSI are oversold but remain neutral to bearish signaling that sideways to lower prices are possible near-term. If December extended the decline off July's high, June's low crossing at $1939.20 is the next downside target. Closes above the 20-day moving average crossing at $1994.60 would signal that a short-term low has been posted. First resistance is the 20-day moving average crossing at $1994.60. Second resistance is July's high crossing at $2028.60. Second resistance is the 50% retracement level of the May-June decline crossing at $2034.70. First support is last-Friday's low crossing at $1954.50. Second support is June's low crossing at $1919.60.
September silver closed lower on Tuesday as it extended the decline off July's high. The low-range close sets the stage for a steady to lower opening when Wednesday's day session begins trading. Stochastics and the RSI are oversold but remain neutral to bearish signaling that sideways to lower prices are possible near-term. If September extends the decline off July's high, June's low crossing at 22.340 is the next downside target. Closes above the 20-day moving average crossing at 24.491 would signal that a short-term low has been posted. First resistance is the 50-day moving average crossing at 23.935. Second resistance is the 50-day moving average crossing at 24.491. First support is the July 6th low crossing at 22.720. Second support is June's low crossing at 22.340.
September copper closed sharply lower on Tuesday. The mid-range close sets the stage for a steady to lower opening when Wednesday's day session begins trading. Stochastics and the RSI are bearish signaling that sideways to lower prices are possible near-term. Today's close below the 50-day moving average crossing at 3.8228 confirms that a short-term top has been posted. If September extends this month's decline, the June 29th low crossing at 3.6830 is the next upside target. First resistance is the 10-day moving average crossing at 3.8842. Second resistance is August's high crossing at 4.0240. First support is the June 29th low crossing at 3.6830. Second support is May's low crossing at 3.5650.
GRAINS? http://quotes.ino.com/ex?changes/?c=grains "
December Corn closed down $0.03-cents at $4.98 3/4.
December corn closed higher on Tuesday as it consolidates some of the decline off July's high. The high-range close sets the stage for a steady to higher opening when Wednesday's night session begins trading. Stochastics and the RSI are oversold but remain bearish signaling that sideways to lower prices are possible near-term. Closes above the 50-day moving average crossing at $5.34 1/4 would signal that a short-term low has been posted. If December extends the decline off July's high, July's low crossing at $4.81 is the next downside target. First resistance is the 20-day moving average crossing at $5.21 1/2. Second resistance is the 50-day moving average crossing at $5.34 1/4. First support is July's low crossing at $4.81. Second support is the September-2021 low on the weekly chart crossing at $4.62 1/2.
September wheat closed down $0.01 1/2-cents at $6.56 1/4.
September wheat closed lower on Tuesday. The high-range close sets the stage for a steady to lower opening when Wednesday's day session begins trading. Stochastics and the RSI are oversold but remain neutral to bearish signaling that sideways to lower prices are possible near-term. If September extends the decline off July's high, July's low crossing at $6.22 is the next downside target. Closes above the 20-day moving average crossing at $6.79 3/4 would signal that a short-term low has been posted. First resistance is the 20-day moving average crossing at $6.79 3/4. Second resistance is July's high crossing at $7.77 1/4. First support is last-Thursday's low crossing at $6.26 1/4. Second support is July's low crossing at $6.22.
September Kansas City Wheat closed up $0.00 3/4-cents at $7.70 1/2.
September Kansas City wheat closed fractionally higher due to short covering on Tuesday. The mid-range close sets the stage for a steady to higher opening when Wednesday's day session begins trading. Stochastics and the RSI are oversold but remain bearish signaling that sideways to lower prices are possible near-term. If September extends the decline off July's high, May's low crossing at $7.33 is the next downside target. Closes above the 20-day moving average crossing at $8.28 1/4 would signal that a short-term low has been posted. First resistance is the 10-day moving average crossing at $8.05. Second resistance is the 50-day moving average crossing at $8.21 1/4. First support is Monday's low crossing at $7.48 1/4. Second support is May's low crossing at $7.33.
September Minneapolis wheat closed up $0.06 1/2-cents crossing at $8.30 3/4.
September Minneapolis wheat closed higher on Tuesday as it consolidated some of the decline off July's high. The high-range close sets the stage for a steady to higher opening when Wednesday's day session begins trading. Stochastics and the RSI are oversold but remain bearish signaling that sideways to lower prices are possible near-term. If September extends the decline off July's high, July's low crossing at $8.07 1/4 is the next downside target. Closes above the 20-day moving average crossing at $8.73 3/4 would signal that a short-term low has been posted. First resistance is the 50-day moving average crossing at $8.48 1/4. Second resistance is the 20-day moving average crossing at $8.73 3/4. First support is July's low crossing at $8.07 1/4. Second support is the June 14th low crossing at $8.01 1/4.
SOYBEAN COMPLEX? http://quotes.ino.com/ex?changes/?c=grains "
November soybeans closed up $0.04-cents at $13.05 3/4.
November soybeans posted an upside reversal and closed higher on Tuesday following a test of the 50% retracement level of the May-July rally crossing at $12.82 3/4. The high-range close sets the stage for a steady to higher opening when Wednesday's day session begins trading. Stochastics and the RSI are oversold but remain neutral to bearish signaling that sideways to higher prices are possible near-term. If November extends the decline off July's high, the June 28th low crossing at $12.56 3/4 is the next downside target. Closes above the 20-day moving average crossing at $13.68 would signal that a short-term low has been posted. First resistance is the 10-day moving average crossing at $13.46. Second resistance is the 20-day moving average crossing at $13.68. First support is the June 28th low crossing at $12.56 3/4. Second support is the 62% retracement level of the May-July rally crossing at $12.46 3/4.
December soybean meal closed up $2.40 at $394.00.
December soybean meal posted an inside day with a higher close on Tuesday as it consolidated some of Monday's decline. The high-range close sets the stage for a steady to higher opening when Wednesday's day session begins trading. Stochastics and the RSI are oversold but remain neutral to bearish signaling that sideways to lower prices are possible near-term. Closes below last-Wednesday's low crossing at $389.70 would open the door for additional weakness near-term. Closes above last-Friday's high crossing at $407.70 would signal that a short-term low has been posted. First resistance is last-Friday's high crossing at $407.70. Second resistance is July's high crossing at $424.70. First support is last-Wednesday's low crossing at $389.70. Second support is the July 7th low crossing at $384.70.
December soybean oil closed unchanged at 59.85.
December soybean oil closed unchanged on Tuesday. The high-range close sets the stage for a steady to higher opening when Wednesday's day session begins trading. Stochastics and the RSI are neutral to bearish signaling that sideways to lower prices are possible near-term. If December extends the decline off July's high, the 50-day moving average crossing at 57.00 is the next downside target. Closes above the 20-day moving average crossing at 61.37 would signal that a short-term low has been posted. First resistance is the 20-day moving average crossing at 61.37. Second resistance is July's high crossing at 65.58. First support is the July 10th low crossing at 58.39. Second support is the 50-day moving average crossing at 57.00.
LIVESTOCKhttp://quotes.ino.com/exchanges/?c=livestock
October hogs closed down $0.25 at $84.58.
October hogs posted an inside day with a lower close on Tuesday. The mid-range close sets the stage for a steady to lower opening when Wednesday's day session begins trading. Stochastics and the RSI are turning neutral to bullish signaling that sideways to higher prices are possible near-term. If October renew the rally off May's low, the 75% retracement level of the April-May decline crossing at $87.50 is the next upside target. If October resumes last-week's decline, the 50-day moving average crossing at $80.48 is the next downside target. First resistance is last-Tuesday's high crossing at $86.75. Second resistance is the 75% retracement level of the April-May decline crossing at $87.50. First support is the 50-day moving average crossing at $80.48. Second support is the June 30th low crossing at $77.58.
October cattle closed down $0.53 at $180.90.
October cattle closed lower on Tuesday. The low-range close sets the stage for a steady to lower opening on Wednesday. Stochastics and the RSI are turning neutral to bearish signaling that sideways to lower prices are possible near-term. If October extends the decline off July's high, the 50-day moving average crossing at $178.04 is the next downside target. If October renews this year's rally into uncharted territory, upside targets will be hard to project. First resistance is July's high crossing at $185.75. Second resistance is unknown. First support is the 50-day moving average crossing at $178.04. Second support is July's low crossing at $176.20.
October Feeder cattle closed down $1.73 at $251.18.
October Feeder cattle closed lower on Tuesday as it extends the July-August trading range. The mid-range close sets the stage for a steady to lower opening when Wednesday's day session begins trading. Stochastics and the RSI are turning neutral to bearish signaling that sideways to lower prices are possible near-term. Closes below the July 6th low crossing at $246.03 would mark a downside breakout of the aforementioned trading range. If October extends the rally off June's low into uncharted territory, upside targets will be hard to project. First resistance is Monday's high crossing at $256.25. Second resistance is unknown. First support is the 50-day moving average crossing at $247.27. Second support is the July 6th low crossing at $246.03.
FOOD & FIBERhttp://quotes.ino.com/ex changes/?c=food
September coffee closed lower on Tuesday. The mid-range close sets the stage for a steady to lower opening on Tuesday. Stochastics and the RSI are neutral to bearish signaling sideways to lower prices are possible near-term. If September resumes the decline off June's high, the 87% retracement level of the January-April rally crossing at $15.20 is the next downside target. If September extends the rally off July's low, the 50-day moving average crossing at $16.77 is the next upside target. First resistance is the 50-day moving average crossing at $16.77. Second resistance is May's low crossing at $17.32. First support is July's low crossing at $15.51. Second support is the 87% retracement level of the January-April rally crossing at $15.20.
September cocoa closed sharply lower on Tuesday following Monday's huge key reversal down signaling that a short-term top has been posted. The low-range close sets the stage for a steady to lower opening on Wednesday. Stochastics and the RSI are bearish signaling that sideways to lower prices are possible near-term. Closes below the 50-day moving average crossing at 32.98 would open the door for a larger-degree decline near-term. Closes above the 10-day moving average crossing at 35.06 would signal that a short-term low has been posted.
October sugar closed lower on Tuesday. The low-range close sets the stage for a steady to lower opening on Wednesday. Stochastics and the RSI are oversold but remain neutral to bearish signaling that sideways to lower prices are possible near-term. If October extends the decline off July's high, the July 7th low crossing at 23.11 is the next downside target. If October renews the rally off June's low, June's high crossing at 26.19 is the next upside target.
December cotton posted an inside day with a lower close on Tuesday. The high-range close sets the stage for a steady to slightly lower opening on Wednesday. Stochastics and the RSI are neutral to bearish signaling sideways to lower prices are possible near-term. Closes below the 20-day moving average crossing at 84.27 would confirm that a short-term top has been posted while opening the door for additional weakness near-term. If December renews the rally off June's low, the 75% retracement level of the May-July decline crossing at 91.29 is the next upside target.
Thanks much tallpine!
Beans is getting some follow thru this evening after the upside reversal on Tuesday.
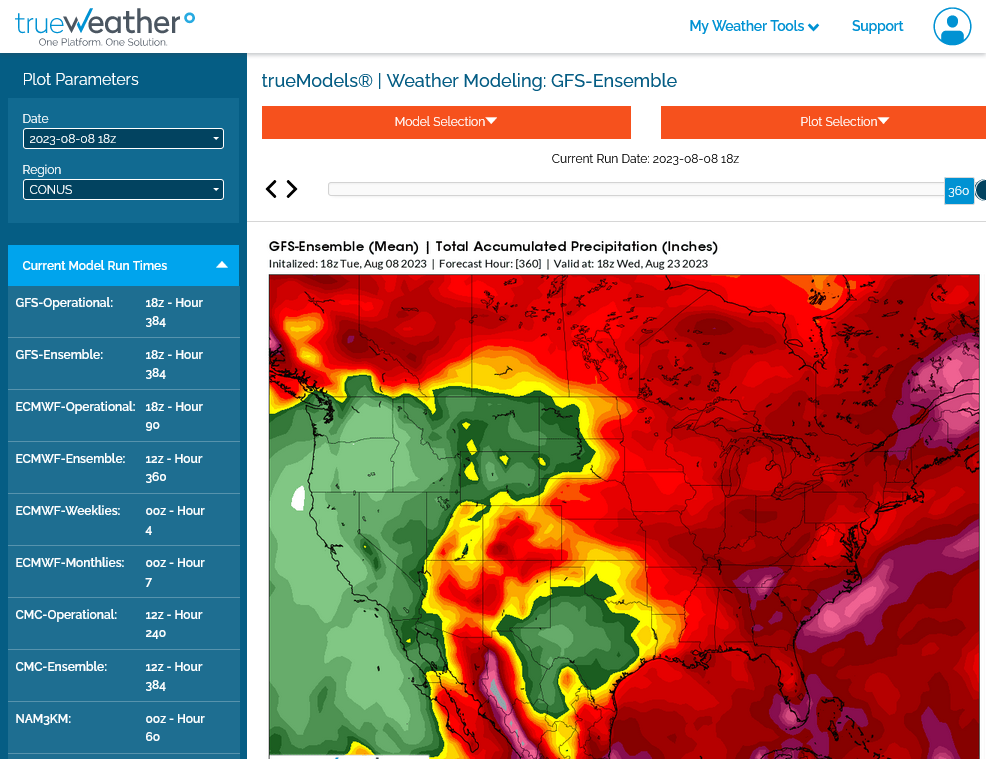
Massive heat ridge across most of the country possible later this month. Pretty bullish for ng but also for grains, though its getting pretty late in the growing season.
1. This was the last 18z GEFS 500 mb pattern. for August 23rd
2. Total rains.