KEY EVENTS TO WATCH FOR:
Thursday, August 10, 2023
8:30 AM ET. July Real Earnings
8:30 AM ET. U.S. Weekly Export Sales
8:30 AM ET. Unemployment Insurance Weekly Claims Report - Initial Claims
Jobless Claims (expected 230K; previous 227K)
Jobless Claims, Net Chg (previous +6K)
Continuing Claims (previous 1700000)
Continuing Claims, Net Chg (previous +21K)
8:30 AM ET. July CPI
CPI, M/M% (expected +0.2%; previous +0.2%)
Core CPI, M/M% (expected +0.2%; previous +0.2%)
Energy Idx, M/M% (previous +0.6%)
Food Idx, M/M% (previous +0.1%)
Real Avg Wkly Pay-Infla Adj, M/M% (previous +0.5%)
CPI, Y/Y% (expected +3.3%; previous +3.0%)
Core Annual, Y/Y% (expected +4.8%; previous +4.8%)
10:30 AM ET. EIA Weekly Natural Gas Storage Report
Working Gas In Storage (Cbf) (previous 3001B)
Working Gas In Storage, Net Chg (Cbf) (previous +14B)
2:00 PM ET. July Monthly Treasury Statement of Receipts and Outlays of the U.S. Government
2:00 PM ET. SEC Closed Meeting
4:30 PM ET. Foreign Central Bank Holdings
4:30 PM ET. Federal Discount Window Borrowings
Friday, August 11, 2023
8:30 AM ET. July PPI
PPI, M/M% (expected +0.2%; previous +0.1%)
Ex-Food & Energy PPI, M/M% (expected +0.2%; previous +0.1%)
Personal Consumption (previous +0.3%)
10:00 AM ET. August University of Michigan Survey of Consumers - preliminary
Mid-Mo Sentiment (expected 71.7; previous 72.6)
Mid-Mo Expectations (previous 69.4)
Mid-Mo Current Idx (previous 77.5)
12:00 PM ET. World Agricultural Supply & Demand Estimates (WASDE)
Corn, End Stocks (Bushels)
Soybeans, End Stocks (Bushels)
Wheat, End Stocks (Bushels)
Cotton, End Stocks (Bales)
The STOCK INDEXES? http://quotes.ino.com/ex?changes/?c=indexes
The STOCK INDEXES: The September NASDAQ 100 was higher overnight and sets the stage a higher opening when the day session begins trading. Stochastics and the RSI are oversold but remain neutral to bearish signaling that sideways to lower prices are possible near-term. If September extends the decline off July's high, the 25% retracement level of the 2022-2023 rally crossing at 14,789.53 is the next downside target. Closes above the 20-day moving average crossing at 15,604.46 would temper the near-term bearish outlook. First resistance is the July 19th high crossing at 16,062.75. Second resistance is the December-2021 high on the weekly continuation chart crossing at 16,659.50. First support is the July 10th low crossing at 15,063.25. Second support is the June 26th low crossing at 14,853.50.
The September S&P 500 was higher overnight as it consolidates some of the decline off July's high. Overnight trading sets the stage for a higher opening when the day session begins trading. Stochastics and the RSI are oversold but remain neutral to bearish signaling that sideways to lower prices are possible near-term. If September extends the decline off July's high, the 50-day moving average crossing at 4468.66 is the next downside target. Closes above the 20-day moving average crossing at 4558.70 would temper the near-term bearish outlook. First resistance is July's high crossing at 4634.50. Second resistance is the March-2022 high crossing at 4714.75. First support is the 50-day moving average crossing at 4468.66. Second support is July's low crossing at 4411.25.
INTEREST RATES http://quotes.ino.com/ex changes/?c=interest"
INTEREST RATES: September T-bonds were steady to slightly higher overnight. Overnight trading sets the stage for a steady to slightly higher opening when the day session begins trading. Stochastics and the RSI are neutral to bullish signaling that sideways to higher prices are possible near-term. If September extends the rally off last-Friday's low, the 20-day moving average crossing at 124-12 is the next upside target. Closes above the 20-day moving average crossing at 124-12 would signal that a low has been posted. If September renews the decline off July's high, the October-2022 low on the weekly continuation chart crossing at 117-19 is the next downside target.First resistance is the 20-day moving average crossing at 124-12. Second resistance is the 50-day moving average crossing at 125-28. First support is last-Friday's low crossing at 119-25. Second support isthe October-2022 low on the weekly continuation chart crossing at 117-19 is the next downside target.
September T-notes were slightly lower overnight and sets the stage for a slightly lower opening when the day session begins trading. Stochastics and the RSI remain neutral to bullish signaling that sideways to higher prices are possible near-term. Closes above the 20-day moving average crossing at 111.213 would signal that a short-term low has been posted. If September renews the decline off July's high, the October-2022 low crossing at 108.265 is the next downside target. First resistance is the 20-day moving average crossing at 111.213. Second resistance is the 50-day moving average crossing at 112.117. First support is last-Friday's low crossing at 109.240. Second support is the October-2022 low on the weekly continuation chart crossing at 108.265.
ENERGY MARKETS? http://quotes.ino.com/ex?changes/?c=energy ""
ENERGIES:Septembercrude oil was lower in late-overnight trading as it consolidates some of Wednesday's rally. Overnight trading sets the stage for a lower opening when the day session begins trading. Stochastics and the RSI are overbought but remain neutral to bullish signaling that sideways to higher prices are possible near-term. If September extends the rally off the June 28th low, the 75% retracement level of the 2022-2023 decline crossing at $88.47 is the next upside target. Closes below the 20-day moving average crossing at $79.57 would signal that a short-term top has been posted. First resistance is the overnight high crossing at $84.89. Second resistance is the 75% retracement level of the 2022-2023 decline crossing at $88.47. First support is the 20-day moving average crossing at 79.57. Second support is the 50-day moving average crossing at $74.50.
September heating oil was lower overnight as it consolidates some of the rally off May's low. Overnight trading sets the stage for a lower opening when the day session begins trading. Stochastics and the RSI are overbought but remain neutral to bullish signaling that sideways to higher prices are possible near-term. If September extends the rally off May's low, the June-2022 crossing at 3.2700 is the next upside target. Closes below Tuesday's low crossing at 2.9375 would signal that a short-term top has been posted. First resistance is the overnight high crossing at 3.2310. Second resistance is the June-2022 high crossing at 3.2700. First support is Tuesday's low crossing at 2.9375. Second support is the 20-day moving average crossing at 2.8821.
September unleaded gas was lower overnight and sets the stage for a lower opening when the day session begins trading. Stochastics and the RSI are becoming overbought but remain neutral to bullish signaling that sideways to higher prices are possible near-term. If September extends the rally off the June 23rd low, the October-2022 high on the weekly continuation chart crossing at 3.0221 is the next upside target. Closes below last-Thursday's low crossing at 2.7131 would confirm that a short-term top has been posted while opening the door for additional weakness near-term. First resistance is the overnight high crossing at $2.9443. Second resistance is the October-2022 high on the weekly continuation chart crossing at $3.0221. First support is last-Thursday's low crossing at $2.7131. Second support is the 50-day moving average crossing at $2.5729.
September natural gas was slightly higher overnight as it extends the rally off last-Wednesday's low. Overnight trading sets the stage for a slightly higher opening when the day session begins trading. Stochastics and the RSI are overbought but remain bullish signaling that sideways to higher prices are possible near-term. If September extends the rally off last-Wednesday's low, the 25% retracement level of the 2022-2023 decline crossing at 3.193 is the next upside target. Closes below the 50-day moving average crossing at 2.604 would signal that a short-term top has been posted. First resistance is Wednesday's high crossing at 3.018. Second resistance is the 25% retracement level of the 2022-2023 decline crossing at 3.193. First support is last-Wednesday's low crossing at 2.457. Second support is the June 1st low crossing at 2.249.
CURRENCIEShttp://quotes.ino.com/ex changes/?c=currencies"
CURRENCIES:The September Dollar was lower overnight and sets the stage for a lower opening when the day session begins trading later this morning. Stochastics and the RSI are overbought but remain neutral to bullish signaling that sideways to higher prices are possible near-term. If September extends the rally off July's low, July's high crossing at $103.275 is the next upside target. Closes below last-Friday's low crossing at $101.550 would signal that a short-term top has been posted. First resistance is July's high crossing at $103.275. Second resistance is May's high crossing at $104.205. First support is last-Friday's low crossing at $101.550. Second support is the 20-day moving average crossing at $101.232.
The September Euro was higher overnight and sets the stage for a higher opening when the day session begins trading. Stochastics and the RSI are turning neutral to bullish signaling that sideways to higher prices are possible near-term. Closes above the 20-day moving average crossing at $1.10880 would signal that a short-term low has been posted. If September renews the decline off July's high, July's low crossing at 1.08715 is the next downside target. First resistance is the 20-day moving average crossing at $1.10880. Second resistance is the July 27th high crossing at $1.11770. First support is July's low crossing at 1.08715. Second support is May's low crossing at 1.07025.
The September British Pound was higher overnight. Overnight trading sets the stage for a higher opening when the day session begins trading. Stochastics and the RSI are neutral to bullish signaling that sideways to higher prices near-term. Closes above the 20-day moving average crossing at 1.2854 would confirm that a short-term top has been posted. If September renews the decline off July's high, the 50% retracement level of the March-July rally crossing at 1.2508 is the next downside target. First resistance the 20-day moving average crossing at 1.2854. Second resistance is the July 27th high crossing at 1.2999. First support is the 38% retracement level of the March-July rally crossing at 1.2658. Second support is the 50% retracement level of the March-July rally crossing at 1.2508.
The September Swiss Franc was higher overnight as it extends the trading range of the past seven-days. Overnight strength sets the stage for a higher opening when the day session begins trading. Stochastics and the RSI are oversold but remain neutral to bearish signaling that sideways to lower prices are possible near-term. If September extends the decline off July's high, the 50-day moving average crossing at 1.13881 is the next downside target. Closes above the 20-day moving average crossing at 1.15740 would signal that a short-term low has been posted. First resistance is the 20-day moving average crossing at 1.15740. Second resistance is the July 18th high crossing at 1.17650. First support is the 50-day moving average crossing at 1.13881. Second support is the June 30th low crossing at 1.11790.
The September Canadian Dollar was higher overnight as it consolidates some of the decline off July's high. Overnight trading sets the stage for a higher opening when the day session begins trading. Stochastics and the RSI are turning neutral to bullish signaling that sideways to higher prices are possible near-term. Closes above the 20-day moving average crossing at $75.45 would signal that a short-term low has been posted. If September renews the decline off July's high, the 62% retracement level of the March-July rally crossing at $74.01 is the next downside target. First resistance is the 10-day moving average crossing at $75.01. Second resistance is the 50-day moving average crossing at $75.42. First support is the 50% retracement level of the March-July rally crossing at $74.48. Second support is the 62% retracement level of the March-July rally crossing at crossing at $74.01.
The September Japanese Yen was steady to slightly lower overnight. Overnight trading sets the stage for a slightly lower opening when the day session begins trading. Stochastics and the RSI are oversold but remain neutral to bearish signaling that sideways to lower prices are possible near-term. If September renews the decline off the July 14th high, June's low crossing at 0.069755 is the next downside target. Closes above the 50-day moving average crossing at 0.071544 would signal that a short-term low has been posted. First resistance is the July 28th high crossing at 0.07315. Second resistance is the July 14th high crossing at 0.073585. First support is the overnight low crossing at 0.069775. Second support is June's low crossing at 0.069755.
PRECIOUS METALS http://quotes.ino.com/ex changes/?c=metals"
Precious Metals: October gold was higher overnight and sets the stage for a higher opening when the day session begins trading later this morning. Stochastics and the RSI are oversold but remain neutral to bearish signaling that sideways to lower prices are possible near-term. If October extends the decline off July's high, June's low crossing at $1919.60 is the next downside target. Closes above last-Monday's high crossing at $1991.00 would temper the near-term bearish outlook. First resistance is the July 20th high crossing at $2008.50. Second resistance is the 50% retracement level of the May-June decline crossing at $2015.80. First support is the July 6th low crossing at $1927.60. Second support is June's low crossing at $1919.60.
September silver was higher overnight as it consolidates some of the decline off July's high. Overnight strength sets the stage for a higher opening when the day session begins trading later this morning. Stochastics and the RSI are oversold but remain neutral to bearish signaling that sideways to lower prices are possible near-term. If September extends the decline off July's high, June's low crossing at $22.340 is the next downside target. Closes above the 20-day moving average crossing at $24.305 would signal that a short-term low has been posted. First resistance is the 50-day moving average crossing at $23.905. Second resistance is the 20-day moving average crossing at $24.305. First support is July's low crossing at $22.720. Second support is June's low crossing at $22.340.
September copper was higher overnight as it consolidates some of the decline off this month's high. Overnight trading sets the stage for a higher opening when the day session begins trading. Stochastics and the RSI are oversold but remain neutral to bearish signaling that sideways to lower prices are possible near-term. If September extends this month's decline, the June 29th low crossing at 3.6830 is the next downside target. Closes below the 10-day moving average crossing at 3.8654 would signal that a short-term low has been posted. First resistance is the 10-day moving average crossing at 3.8654. Second resistance is last-Friday's high crossing at 3.9280. First support is the June 29th low crossing at 3.6830. Second support is May's low crossing at 3.5650.
GRAINS http://quotes.ino.com/ex changes/?c=grains
Grains: December corn was steady to slightly higher overnight as it extends the trading range of the past five-days. Overnight trading sets the stage for a steady to slightly higher opening when the day sessions begins trading. Stochastics and the RSI are oversold but remain bearish signaling that sideways to lower prices are possible near-term. If December extends the decline off July's high, July's low crossing at $4.81 is the next downside target. Closes above last-Monday's gap crossing at $5.25 1/2 would signal that a short-term low has been posted. First resistance is the 20-day moving average crossing at $5.22. Second resistance is the 50-day moving average crossing at $5.33 1/2. First support is Monday's low crossing at $4.89 1/4. Second support is July's low crossing at $4.81.
September wheat was higher overnight while extending the trading range of the past five-days. Overnight trading sets the stage for a higher opening when the day session begins trading. Stochastics and the RSI are oversold but remain neutral to bearish signaling that sideways to lower prices are possible near-term. If September extends the decline off July's high, the July 18th low crossing at $6.42 1/4 is the next downside target. Closes above the 20-day moving average crossing at $6.79 3/4 would signal that a short-term low has been posted. First resistance is the 50-day moving average crossing at $6.70 3/4. Second resistance is the 20-day moving average crossing at $6.79 3/4. First support is July's low crossing at $6.22. Second support is May's low crossing at $5.87 3/4.
September Kansas City wheat was higher overnight as it extends this week's trading range. Overnight trading sets the stage for a higher opening when the day session begins trading later this morning. Stochastics and the RSI are oversold but remain neutral to bearish signaling that sideways to lower prices are possible near-term. If September extends the decline off July's high, May's low crossing at $7.33 is the next downside target. Closes above the 20-day moving average crossing at $8.24 1/4 would signal that a low has been posted. First resistance is the 10-day moving average crossing at $7.85 1/4. Second resistance is the 50-day moving average crossing at $8.20. First support is Monday's low crossing at $7.48 1/4. Second support is May's low crossing at $7.33.
September Minneapolis wheat was higher overnight as it extends this week's trading range. Overnight trading sets the stage for a higher opening when the day session begins trading. Stochastics and the RSI are oversold but remain neutral to bearish signaling that sideways to lower prices are possible near-term. If September extends the decline off July's high, July's low crossing at $8.07 1/4 is the next downside target. Closes above the 20-day moving average crossing at $8.70 1/4 would signal that a low has been posted. First resistance is the 50-day moving average crossing at $8.48 3/4. Second resistance is the 20-day moving average crossing at $8.70 1/4. First support is July's low crossing at $8.07 1/4. Second support is the June 14th low crossing at $8.01 1/4.
SOYBEAN COMPLEX? http://quotes.ino.com/ex?changes/?c=grains "
November soybeans was higher overnight as it extends the rebound off Tuesday's low, which tested the 50% retracement level of the May-July low. Overnight trading sets the stage for a higher opening when the day session begins trading later this morning. Stochastics and the RSI are oversold but remain neutral to bearish signaling that sideways to lower prices are possible near-term. If November extends the decline off July's high, the 62% retracement level of the May-July rallycrossing at $12.46 3/4 is the next downside target. Closes above the 20-day moving average crossing at $13.64 1/2 would signal that a low has been posted. First resistance is the 10-day moving average crossing at $13.26 3/4. Second resistance is the 20-day moving average crossing at $13.64 1/2. First support is the 50% retracement level of the May-July rally crossing at $12.82 3/4. Second support is the June 28th low crossing at $12.56 3/4.
December soybean meal was higher overnight as it extends the trading range of the past two-weeks. Overnight trading sets the stage for a higher opening when the day session begins trading. Stochastics and the RSI are oversold but remain neutral to bearish signaling that sideways to lower prices are possible near-term. If December extends the decline off July's high, the July 7th low crossing at $384.70 is the next downside target. Closes above last-Monday's gap crossing at $392.40 would temper the bearish outlook. First resistance is last-Monday's gap crossing at $392.40. Second resistance is July's high crossing at $424.70. First support is the July 7th low crossing at $384.70. Second support is the June 29th low crossing at $374.60.
December soybean oil was lower in overnight trading as it extends the trading range of the past two-weeks. Overnight trading sets the stage for a lower opening when the day session begins trading. Stochastics and the RSI are becoming oversold but remain neutral to bearish signaling that sideways to lower prices are possible near-term. If December extends the decline off July's high, the 50-day moving average crossing at 57.52 is the next downside target. Closes above the 20-day moving average crossing at 61.36 would temper the bearish outlook. First resistance is the 75% retracement level of the 2022-2023 decline crossing at 65.45. Second resistance is the 87% retracement level of the 2022-2023 decline crossing at 68.81. First support is Tuesday's low crossing at 57.86. Second support is the 50-day moving average crossing at 57.52.
Thanks, tallpine!
The models have changed a great deal overnight for the late 2 week period.
They have all shifted back closer to persistence............the heat ridge farther southwest and NOT in the Midwest of East, along with mostly northwest flow in the Midwest.
There is no Bermuda high/moisture pump, so rain amounts are questionable and northwest flow is always tricky.
Probably most traders today care more about the USDA report tomorrow than the weather.
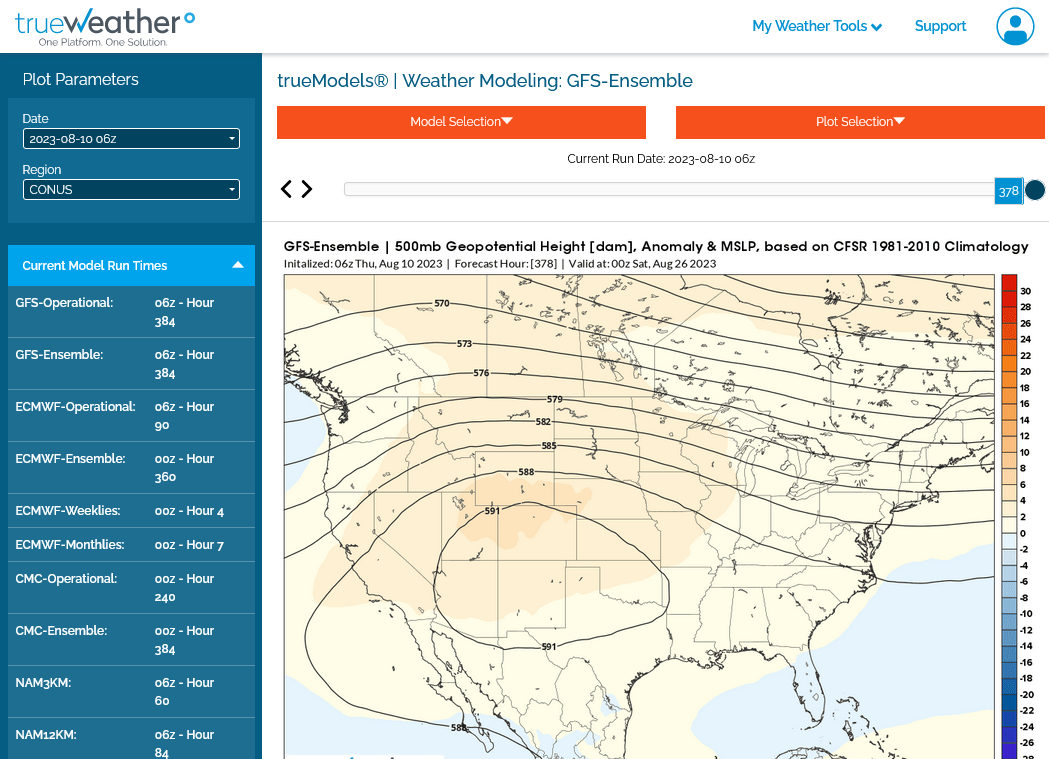
1. Just out 500 mb 6z GEFS-northwest flow for Midwest, trough again in the Northeast-MUCH LESS bullish for NG with less heat in the East.
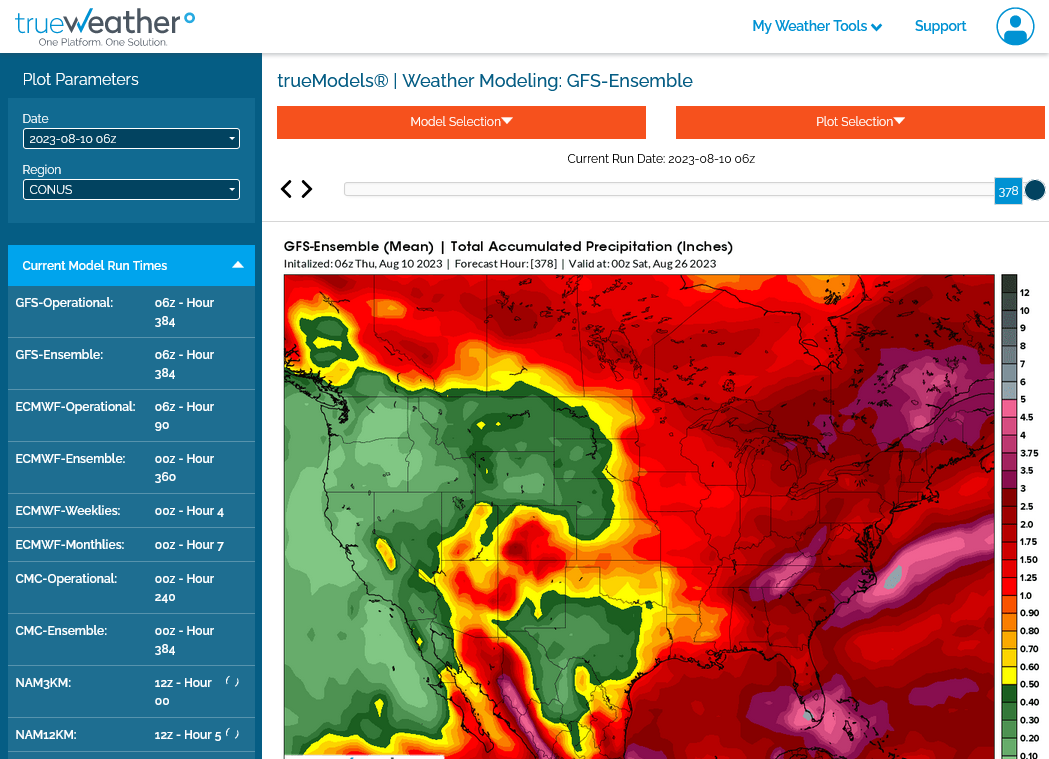
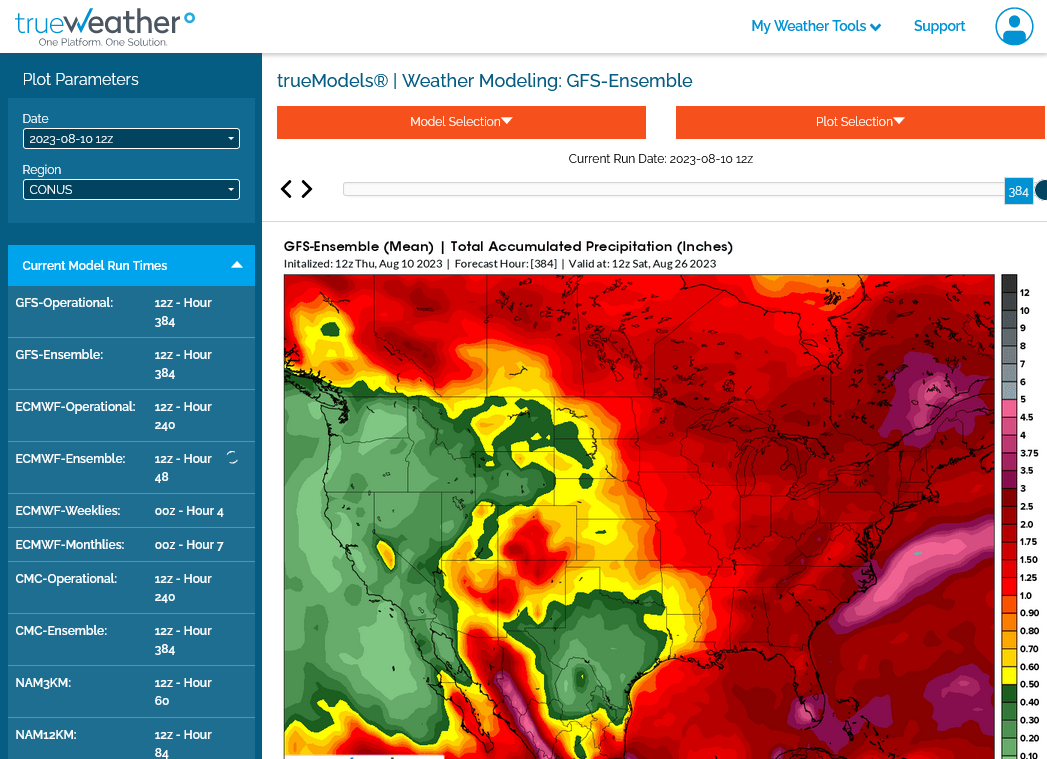
2. Just out 6z GEFS total rains best amounts Southeast belt
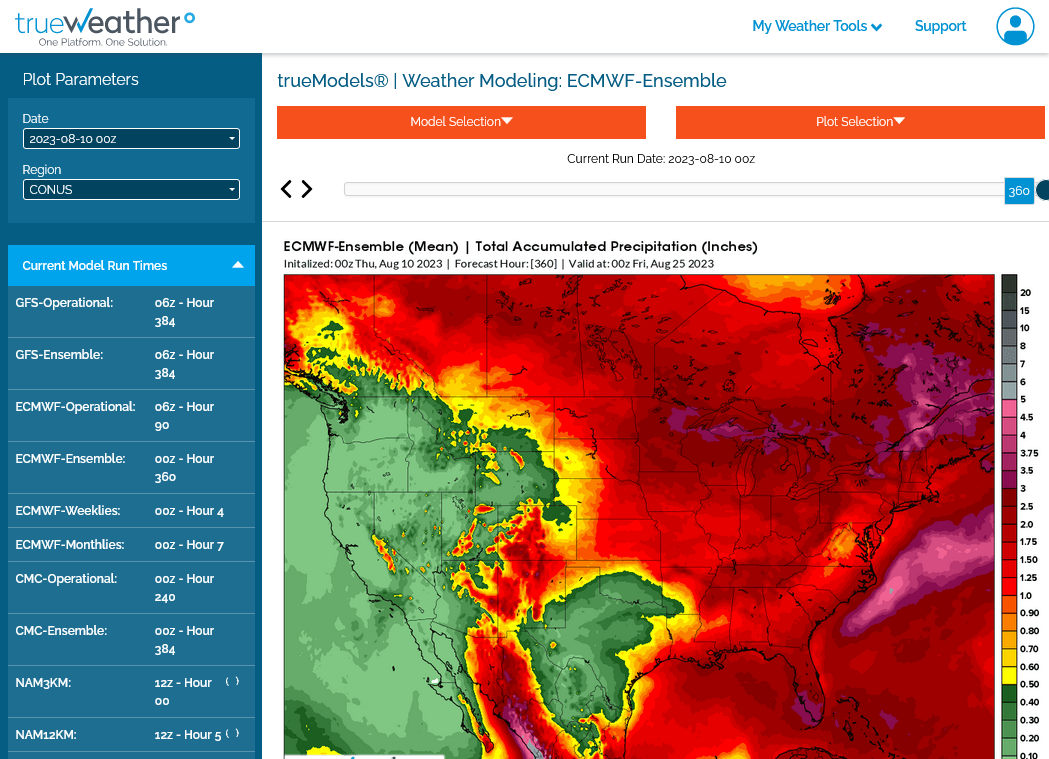
3. 0z European model total rains. Much wetter Upper Midwest/WCB
The last 12z Canadian model shows alot of different potential solutions from its many members. So there's uncertainty later this month........except it WILL be hot in the South and for cotton is bullish.
https://weather.gc.ca/ensemble/charts_e.html?Hour=384&Day=0&RunTime=12&Type=gz
384h GZ 500 forecast valid on Aug 26, 2023 12 UTC


Forecasts for the control (GEM 0) and the 20 ensemble members (global model not available)
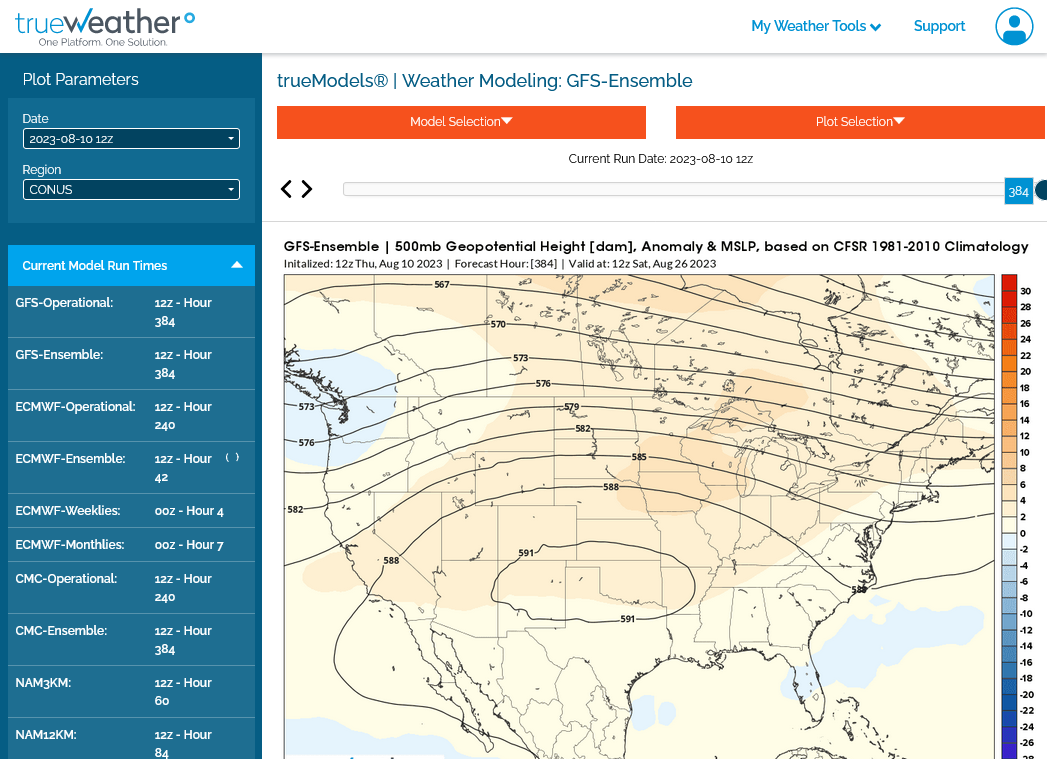
This was the last 12z GEFS. Less northwest flow and more upper level ridging in the Midwest.
1. 500 mb
2. Total rains.......getting more skinny with time. Big heat would increase moisture needs for beans that are filling pods. It will cause heat fill to end the kernel filling season.
Heat Fill for Corn
Started by metmike - July 14, 2023, 2:47 p.m.
https://www.marketforum.com/forum/topic/97257/
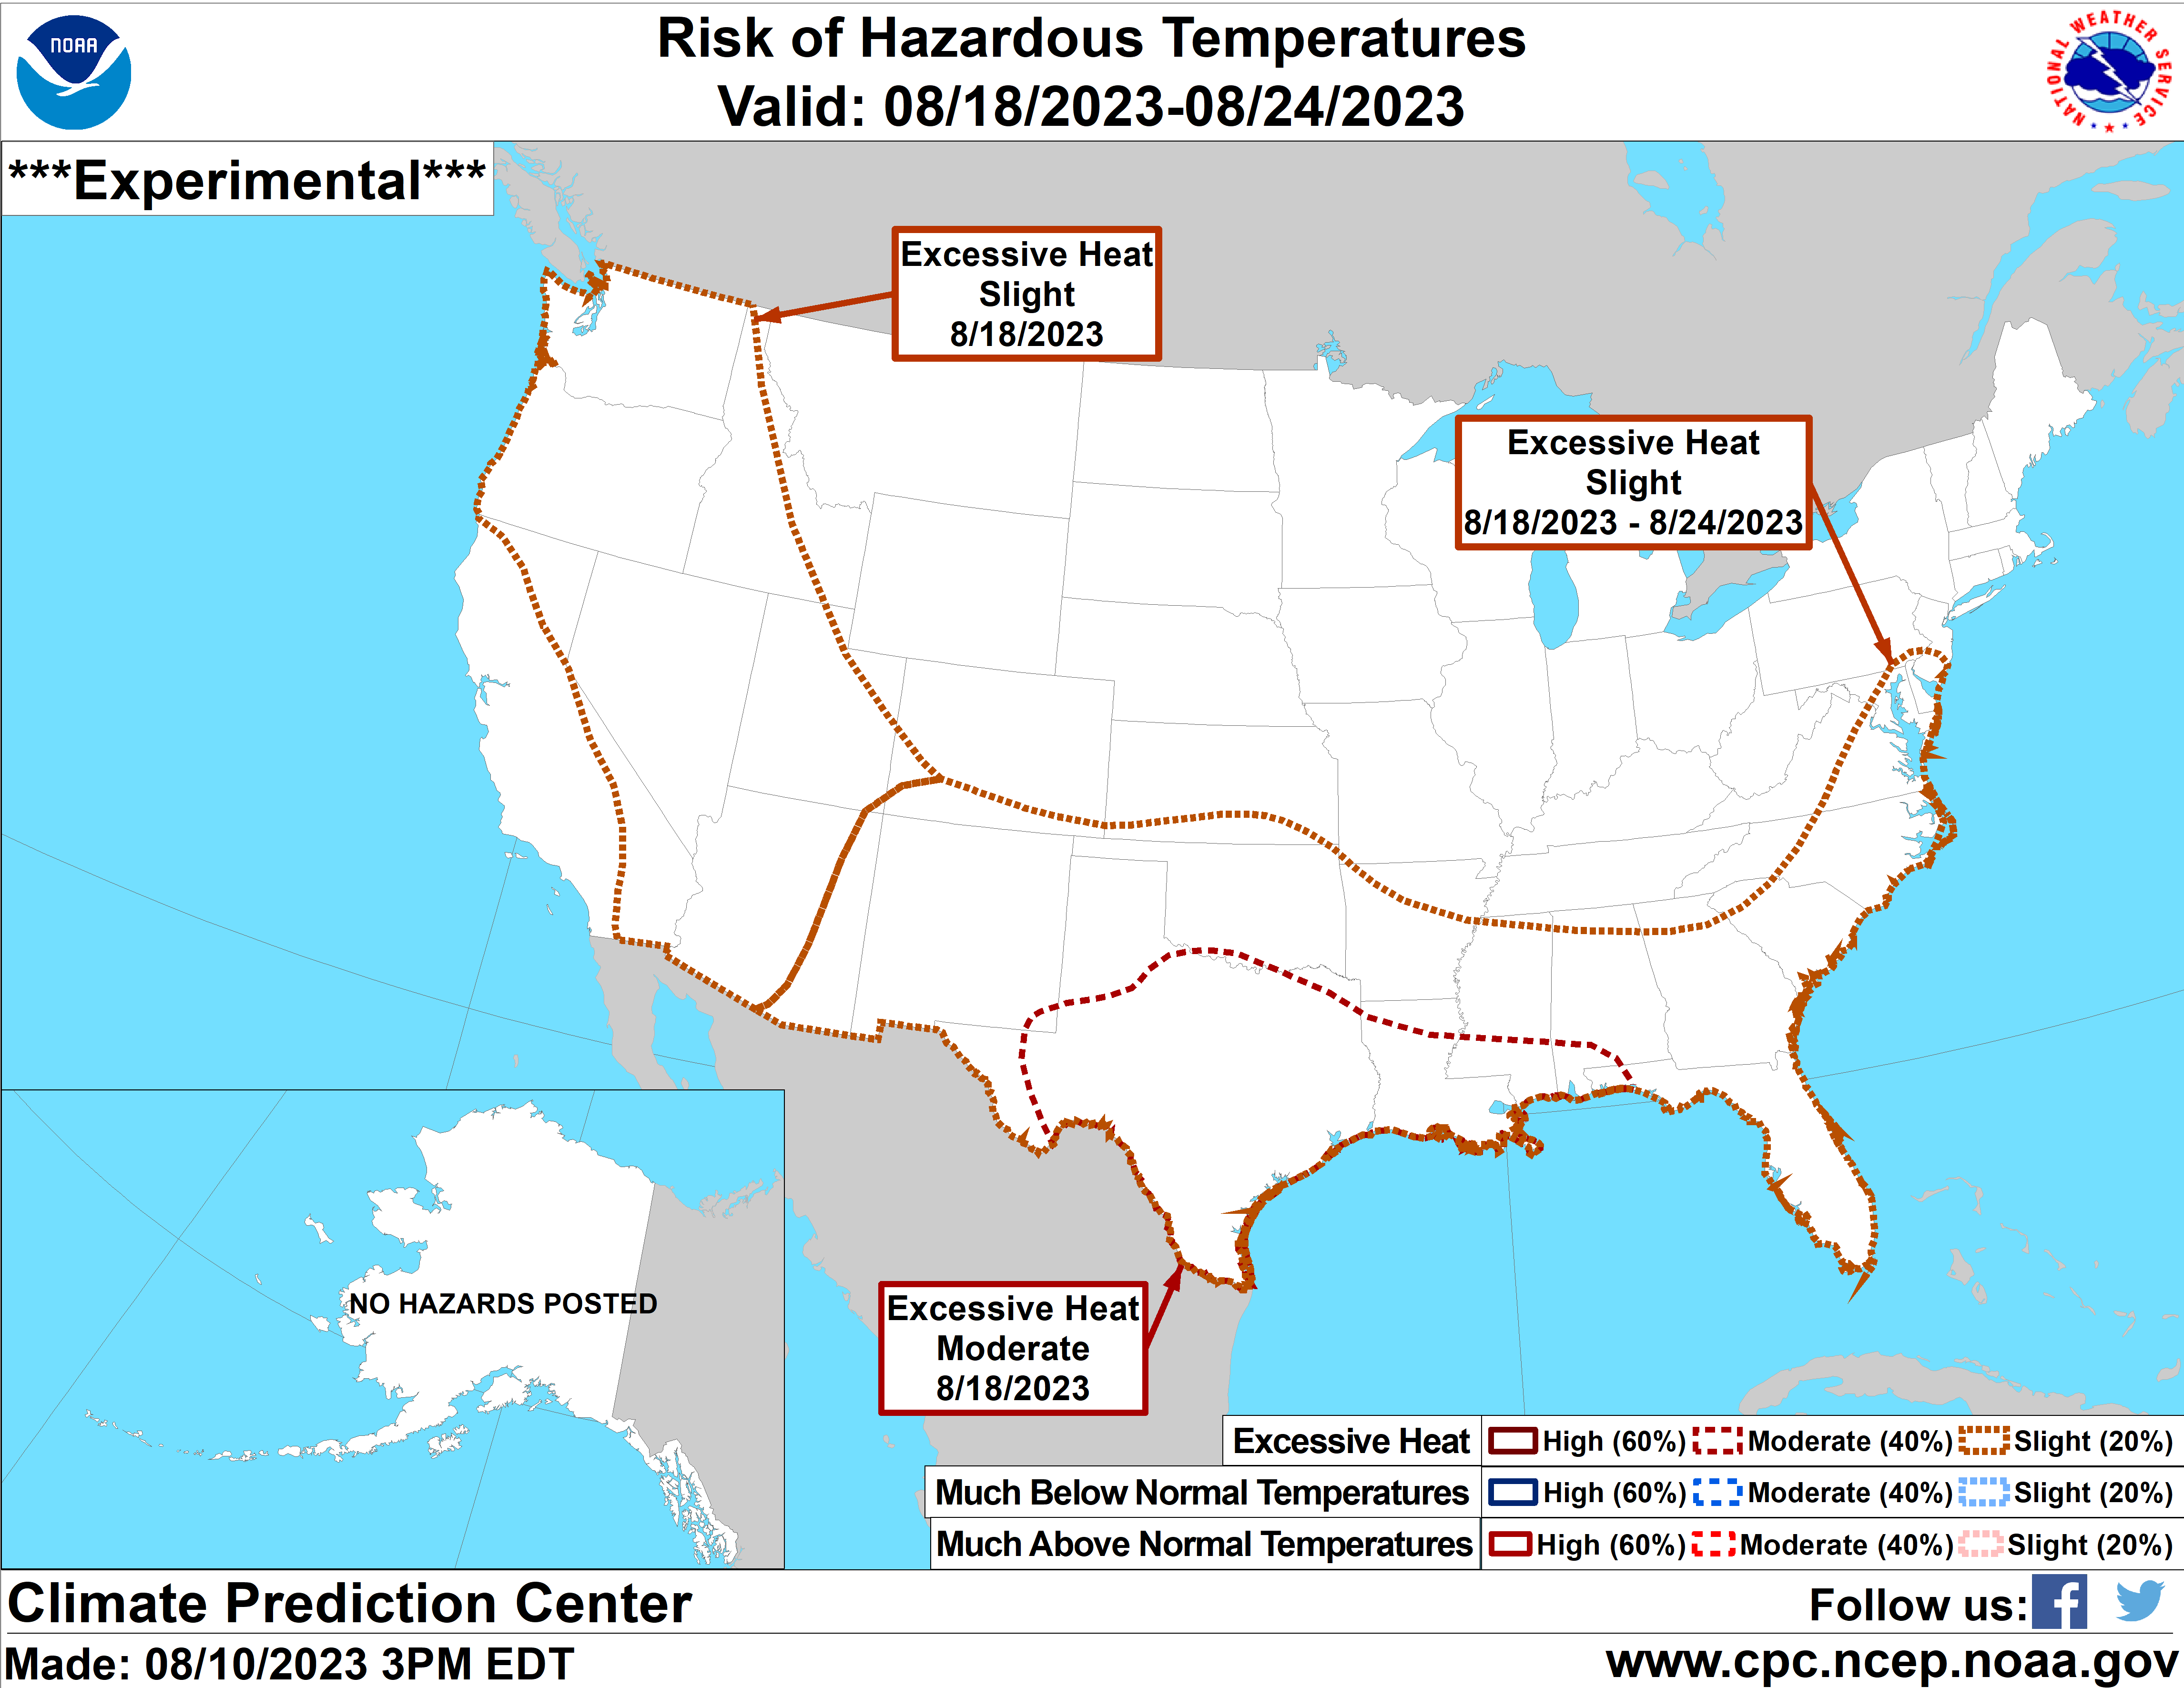
Just updated NWS week 2 forecast catching on to the pattern change
https://www.cpc.ncep.noaa.gov/products/predictions/814day/index.php
| Temperature Precipitation | |
| Click below for archives of past outlooks (data & graphics), historical analogs to todays forecast, and other formats of the 8-14 day outlooks ArchivesAnalogsLines-Only FormatGIS Data | |
Temperature Probability | |
Precipitation Probability | |
https://www.cpc.ncep.noaa.gov/products/predictions/threats/temp_probhazards_d8_14_contours.png