KEY EVENTS TO WATCH FOR:
Monday, August 14, 2023
5:00 PM ET. U.S. Treasury Secretary Yellen delivers remarks on the economy ahead of Inflation
Reduction Act anniversary
Tuesday, August 15, 2023
8:30 AM ET. August Empire State Manufacturing Survey
Mfg Idx (previous 1.1)
Employment Idx (previous 4.7)
New Orders Idx (previous 3.3)
Prices Received (previous 3.9)
8:30 AM ET. July Advance Monthly Sales for Retail & Food Services
Overall Sales-SA, M/M% (previous +0.2%)
Sales, Ex-Auto, M/M% (previous +0.2%)
Sales, Ex-Auto & Gas, M/M% (previous +0.3%)
8:30 AM ET. July Import & Export Price Indexes
Import Prices (previous -0.2%)
Non-Petroleum Prices (previous -0.3%)
Petroleum Prices (previous +1.1%)
8:55 AM ET. Johnson Redbook Retail Sales Index
Ret Sales Mo-to-Date, Y/Y% (previous +0.3%)
Latest Wk, Y/Y% (previous +0.3%)
10:00 AM ET. June Manufacturing & Trade: Inventories & Sales
Total Inventories (previous +0.2%)
10:00 AM ET. August NAHB Housing Market Index
Housing Mkt Idx (previous 56)
4:00 PM ET. June Treasury International Capital Data
4:30 PM ET. API Weekly Statistical Bulletin
Crude Stocks, Net Chg (Bbls) (previous +4.1M)
Gasoline Stocks, Net Chg (Bbls) (previous -0.4M)
Distillate Stocks, Net Chg (Bbls) (previous -2.1M)
Wednesday, August 16, 2023
7:00 AM ET. MBA Weekly Mortgage Applications Survey
Composite Idx (previous 194.5)
Composite Idx, W/W% (previous -3.1%)
Purchase Idx-SA (previous 149.9)
Purchase Idx-SA, W/W% (previous -2.7%)
Refinance Idx (previous 416.1)
Refinance Idx, W/W% (previous -4.0%)
8:30 AM ET. July New Residential Construction - Housing Starts and Building Permits
Total Starts (expected 1.45M; previous 1.434M)
Housing Starts, M/M% (expected +1.1%; previous -8%)
Building Permits (expected 1.48M; previous 1.440M)
Building Permits, M/M% (expected +2.8%; previous -3.7%)
9:15 AM ET. July Industrial Production & Capacity Utilization
Industrial Production, M/M% (expected +0.3%; previous -0.5%)
Capacity Utilization % (expected 79.1%; previous 78.9%)
Capacity Utilization, Net Chg (Pts) (previous -0.5)
10:30 AM ET. EIA Weekly Petroleum Status Report
Crude Oil Stocks (Bbl) (previous 445.622M)
Crude Oil Stocks, Net Chg (Bbl) (previous +5.851M)
Gasoline Stocks (Bbl) (previous 216.42M)
Gasoline Stocks, Net Chg (Bbl) (previous -2.661M)
Distillate Stocks (Bbl) (previous 115.447M)
Distillate Stocks, Net Chg (Bbl) (previous -1.706M)
Refinery Usage (previous 93.8%)
Total Prod Supplied (Bbl/day) (previous 20.727M)
Total Prod Supplied, Net Chg (Bbl/day) (previous +0.704M)
2:00 PM ET. Federal Open Market Committee meeting minutes published
The STOCK INDEXES? http://quotes.ino.com/ex?changes/?c=indexes
The STOCK INDEXES: The September NASDAQ 100 was higher overnight and sets the stage a slightly higher opening when the day session begins trading. Stochastics and the RSI are oversold but remain neutral to bearish signaling that sideways to lower prices are possible near-term. If September extends the decline off July's high, the 25% retracement level of the 2022-2023 rally crossing at 14,789.53 is the next downside target. Closes above the 20-day moving average crossing at 15,536.89 would temper the near-term bearish outlook. First resistance is the 50-day moving average crossing at 15,304.90. Second resistance is the 20-day moving average crossing at 15,536.73. First support is the 25% retracement level of the 2022-2023 rally crossing at 14,789.53. Second support is the June 8th low crossing at 14,425.00.
The September S&P 500 was slightly higher overnight as it consolidates some of the decline off July's high. Overnight trading sets the stage for a slightly higher opening when the day session begins trading. Stochastics and the RSI are oversold but remain neutral to bearish signaling that sideways to lower prices are possible near-term. Closes below the 50-day moving average crossing at 4477.59 is the next downside target. Closes above the 20-day moving average crossing at 4551.62 would temper the near-term bearish outlook. First resistance is the 20-day moving average crossing at 4551.62. Second resistance is July's high crossing at 4634.50. First support is the 50-day moving average crossing at 4477.59. Second support is July's low crossing at 4411.25.
INTEREST RATES http://quotes.ino.com/ex changes/?c=interest"
INTEREST RATES: September T-bonds were slightly higher overnight. Overnight trading sets the stage for a slightly higher opening when the day session begins trading. Stochastics and the RSI are neutral to bearish signaling that sideways to lower prices are possible near-term. If September renews the decline off July's high, the October-2022 low on the weekly continuation chart crossing at 117-19 is the next downside target.If September extends the rally off the August 8th low, the 20-day moving average crossing at 123-24 is the next upside target. Closes above the 20-day moving average crossing at 123-24 would signal that a low has been posted. First resistance is the 20-day moving average crossing at 123-24. Second resistance is the 50-day moving average crossing at 125-18. First support is the August 8th low crossing at 119-25. Second support is the October-2022 low on the weekly continuation chart crossing at 117-19 is the next downside target.
September T-notes were slightly higher overnight and sets the stage for a slightly higher opening when the day session begins trading. Stochastics and the RSI have turned neutral to bearish signaling that sideways to lower prices are possible near-term. If September renews the decline off July's high, the October-2022 low crossing at 108.265 is the next downside target. Closes above the 50-day moving average crossing at 112.057 would signal that a short-term low has been posted. First resistance is the 20-day moving average crossing at 111.128. Second resistance is the 50-day moving average crossing at 112.057. First support is the August 4th low crossing at 109.240. Second support is the October-2022 low on the weekly continuation chart crossing at 108.265.
ENERGY MARKETS? http://quotes.ino.com/ex?changes/?c=energy ""
ENERGIES:Septembercrude oil was slightly lower in late-overnight trading. Overnight trading sets the stage for a slightly lower opening when the day session begins trading. Stochastics and the RSI are turning neutral to bearish signaling that sideways to lower prices are possible near-term. Closes below the 20-day moving average crossing at $80.33 would signal that a short-term top has been posted. If September extends the rally off the June 28th low, the 75% retracement level of the 2022-2023 decline crossing at $88.47 is the next upside target. First resistance is last-Thursday's high crossing at $84.89. Second resistance is the 75% retracement level of the 2022-2023 decline crossing at $88.47. First support is the 20-day moving average crossing at $80.33. Second support is the 50-day moving average crossing at $75.03.
September heating oil was slightly lower overnight and sets the stage for a slightly lower opening when the day session begins trading. Stochastics and the RSI are overbought and are turning neutral to bearish signaling that sideways to lower prices are possible near-term. Closes below last-Tuesday's low crossing at 2.9375 would signal that a short-term top has been posted. If September extends the rally off May's low, the June-2022 crossing at 3.2700 is the next upside target. First resistance is last-Thursday's high crossing at 3.2310. Second resistance is the June-2022 high crossing at 3.2700. First support is last-Tuesday's low crossing at 2.9375. Second support is the 20-day moving average crossing at 2.9348.
September unleaded gas was lower overnight and sets the stage for a lower opening when the day session begins trading. Stochastics and the RSI are overbought but remain neutral to bullish signaling that sideways to higher prices are possible near-term. If September extends the rally off the June 23rd low, the October-2022 high on the weekly continuation chart crossing at 3.0221 is the next upside target. Closes below the August 3rd low crossing at 2.7131 would confirm that a short-term top has been posted while opening the door for additional weakness near-term. First resistance is last-Friday's high crossing at $2.9859. Second resistance is the October-2022 high on the weekly continuation chartcrossing at $3.0221. First support is the 20-day moving average crossing at $2.8236. Second support is August 3rd low crossing at $2.7131.
September natural gas was slightly higher overnight as it consolidates some of last-Thursday's decline. Overnight trading sets the stage for a slightly higher opening when the day session begins trading. Stochastics and the RSI are neutral to bearish signaling that a short-term appears to have been posted with last-Wednesday's high. Closes below the 50-day moving average crossing at 2.619 would signal that a short-term top has been posted. If September extends the rally off August's low, the 25% retracement level of the 2022-2023 decline crossing at 3.193 is the next upside target. First resistance is last-Wednesday's high crossing at 3.018. Second resistance is the 25% retracement level of the 2022-2023 decline crossing at 3.193. First support is August's low crossing at 2.457. Second support is the June 1st low crossing at 2.249.
CURRENCIEShttp://quotes.ino.com/ex changes/?c=currencies"
CURRENCIES:The September Dollar was steady to slightly higher overnight and sets the stage for a slightly higher opening when the day session begins trading later this morning. Stochastics and the RSI are overbought but remain neutral to bullish signaling that sideways to higher prices are possible near-term. If September extends the rally off July's low, July's high crossing at $103.275 is the next upside target. Closes below the August 4th low crossing at $101.550 would signal that a short-term top has been posted. First resistance is July's high crossing at $103.275. Second resistance is May's high crossing at $104.205. First support is the August 4th low crossing at $101.550. Second support is the 20-day moving average crossing at $100.944.
The September Euro was slightly lower overnight and sets the stage for a slightly lower opening when the day session begins trading. Stochastics and the RSI are oversold but remain neutral to bearish signaling that sideways to lower prices are possible near-term. If September renews the decline off July's high, July's low crossing at 1.08715 is the next downside target. Closes above the 20-day moving average crossing at $1.10555 would signal that a short-term low has been posted. First resistance is the 20-day moving average crossing at $1.10555. Second resistance is the July 27th high crossing at $1.11770. First support is July's low crossing at 1.08715. Second support is May's low crossing at 1.07025.
The September British Pound was steady to slightly higher overnight and sets the stage for a steady to slightly higher opening when the day session begins trading. Stochastics and the RSI are turning neutral to bearish signaling that sideways to lower prices near-term. If September renews the decline off July's high, the 50% retracement level of the March-July rally crossing at 1.2508 is the next downside target. Closes above the 20-day moving average crossing at 1.2811 would signal that a short-term top has been posted. First resistance the 20-day moving average crossing at 1.2811. Second resistance is the July 27th high crossing at 1.2999. First support is the 38% retracement level of the March-July rally crossing at 1.2658. Second support is the 50% retracement level of the March-July rally crossing at 1.2508.
The September Swiss Franc was steady to slightly lower overnight as it extends the trading range of the past two-weeks. Overnight trading sets the stage for a slightly lower opening when the day session begins trading. Stochastics and the RSI are oversold but remain neutral to bearish signaling that sideways to lower prices are possible near-term. If September extends the decline off July's high, the 50-day moving average crossing at 1.13945 is the next downside target. Closes above the 20-day moving average crossing at 1.14000 would signal that a short-term low has been posted. First resistance is the 20-day moving average crossing at 1.15483. Second resistance is the July 18th high crossing at 1.17650. First support is the 50-day moving average crossing at 1.14000. Second support is the June 30th low crossing at 1.11790.
The September Canadian Dollar was slightly higher overnight and sets the stage for a slightly higher opening when the day session begins trading. Stochastics and the RSI are oversold but remain neutral to bearish signaling that sideways to lower prices are possible near-term. If September renews the decline off July's high, the 62% retracement level of the March-July rally crossing at $74.01 is the next downside target. Closes above the 20-day moving average crossing at $75.30 would signal that a short-term low has been posted. First resistance is the 10-day moving average crossing at $74.73. Second resistance is the 20-day moving average crossing at $75.30. First support is the 62% retracement level of the March-July rally crossing at $74.01. Second support is the 75% retracement level of the March-July rally crossing at crossing at $73.49.
The September Japanese Yen was steady to slightly lower overnight as it extends this year's decline. Overnight trading sets the stage for a steady to slightly lower opening when the day session begins trading. Stochastics and the RSI are oversold and remain neutral to bearish signaling that sideways to lower prices are possible near-term. If September extends the decline off the July 14th high, the October-2022 low on the weekly continuation chart crossing at 0.066235 is the next downside target. Closes above the 20-day moving average crossing at 0.070938 would signal that a short-term low has been posted. First resistance is the 10-day moving average crossing at 0.070111. Second resistance is the 20-day moving average crossing at 0.070938. First support is the October-2022 low crossing at 0.069270. Second support is the October-2022 low on the weekly continuation chart crossing at 0.066235.
PRECIOUS METALS http://quotes.ino.com/ex changes/?c=metals"
Precious Metals: December gold was steady to slightly lower overnight and sets the stage for a slightly lower opening when the day session begins trading later this morning. Stochastics and the RSI are oversold but remain neutral to bearish signaling that sideways to lower prices are possible near-term. If October extends the decline off July's high, June's low crossing at $1939.20 is the next downside target. Closes above the 50-day moving average crossing at $1986.30 would confirm that a short-term low has been posted. First resistance is the 50-day moving average crossing at $1986.30. Second resistance is the July 20th high crossing at $2028.60. First support is the overnight low crossing at $1942.20. Second support is June's low crossing at $1939.20.
September silver was slightly lower overnight as it extends last-week's trading range. Overnight weakness sets the stage for a slightly lower opening when the day session begins trading later this morning. Stochastics and the RSI are oversold but remain neutral to bearish signaling that sideways to lower prices are possible near-term. If September extends the decline off July's high, June's low crossing at $22.340 is the next downside target. Closes above the 20-day moving average crossing at $24.068 would signal that a short-term low has been posted. First resistance is the 10-day moving average crossing at $23.269. Second resistance is the 50-day moving average crossing at $23.854. First support is the overnight low crossing at $22.585. Second support is June's low crossing at $22.340.
September copper was slightly higher overnight as it consolidates some of the decline off August's high. Overnight trading sets the stage for a slightly higher opening when the day session begins trading. Stochastics and the RSI are oversold but remain neutral to bearish signaling that sideways to lower prices are possible near-term. If September extends this month's decline, the June 29th low crossing at 3.6830 is the next downside target. Closes below the 20-day moving average crossing at 3.8445 would signal that a short-term low has been posted. First resistance is the 20-day moving average crossing at 3.8445. Second resistance is the August 4th high crossing at 3.9280. First support is the June 29th low crossing at 3.6830. Second support is May's low crossing at 3.5650.
GRAINS http://quotes.ino.com/ex changes/?c=grains
Grains: December corn was slightly lower overnight as it extends last-Friday's decline. Overnight trading sets the stage for a lower opening when the day sessions begins trading. Stochastics and the RSI are oversold but remain bearish signaling that sideways to lower prices are possible near-term. If December extends the decline off July's high, July's low crossing at $4.81 is the next downside target. Closes above the July 31st gap crossing at $5.25 1/2 would signal that a short-term low has been posted. First resistance is the 20-day moving average crossing at $5.19 1/2. Second resistance is the 50-day moving average crossing at $5.31 1/4. First support is last-Friday's low crossing at $4.83. Second support is July's low crossing at $4.81.
September wheat was lower overnight as it renewed the decline off July's high. Overnight trading sets the stage for a lower opening when the day session begins trading. Stochastics and the RSI are oversold but remain neutral to bearish signaling that sideways to lower prices are possible near-term. If September extends the decline off July's high, May's low crossing at $5.87 3/4 is the next downside target. Closes above the 20-day moving average crossing at $6.76 1/2 would signal that a short-term low has been posted. First resistance is the 50-day moving average crossing at $6.71. Second resistance is the 20-day moving average crossing at $6.76 1/2. First support is July's low crossing at $6.22. Second support is May's low crossing at $5.87 3/4.
September Kansas City wheat was lower overnight and is poised to extend the decline off July's high. Overnight trading sets the stage for a lower opening when the day session begins trading later this morning. Stochastics and the RSI are oversold but remain neutral to bearish signaling that sideways to lower prices are possible near-term. If September extends the decline off July's high, May's low crossing at $7.33 is the next downside target. Closes above the 50-day moving average crossing at $8.18 1/4 would signal that a low has been posted. First resistance is the 10-day moving average crossing at $7.68 1/2. Second resistance is the 50-day moving average crossing at $8.18 1/4. First support is the overnight low crossing at $7.47 3/4. Second support is May's low crossing at $7.33.
September Minneapolis wheat was slightly lower overnight as it challenges minor support crossing at $8.11. Overnight trading sets the stage for a slightly lower opening when the day session begins trading. Stochastics and the RSI are oversold but remain neutral to bearish signaling that sideways to lower prices are possible near-term. If September extends the decline off July's high, July's low crossing at $8.07 1/4 is the next downside target. Closes above the 20-day moving average crossing at $8.63 would signal that a low has been posted. First resistance is the 10-day moving average crossing at $8.27 3/4. Second resistance is the 50-day moving average crossing at $8.49 3/4. First support is July's low crossing at $8.07 1/4. Second support is the June 14th low crossing at $8.01 1/4.
SOYBEAN COMPLEX? http://quotes.ino.com/ex?changes/?c=grains "
November soybeans was higher overnight as it extends the rebound off last-Tuesday's low. Overnight trading sets the stage for a higher opening when the day session begins trading later this morning. Stochastics and the RSI are oversold and are turning neutral to bullish signaling that sideways to higher prices are possible near-term. Closes above the 20-day moving average crossing at $13.58 1/2 would signal that a low has been posted. If November renews the decline off July's high, the 62% retracement level of the May-July rally crossing at $12.46 3/4 is the next downside target. First resistance is the 20-day moving average crossing at $13.58 1/2. Second resistance is the July 31st gap crossing at $13.79. First support is the 50% retracement level of the May-July rally crossing at $12.82 3/4. Second support is the June 28th low crossing at $12.56 3/4.
December soybean meal was slightly higher overnight as it extends the trading range of the past two-weeks. Overnight trading sets the stage for a higher opening when the day session begins trading. Stochastics and the RSI are oversold but remain neutral to bearish signaling that sideways to lower prices are possible near-term. If December extends the decline off July's high, the July 7th low crossing at $384.70 is the next downside target. Closes above the July 28th gap crossing at $392.40 would temper the bearish outlook. First resistance is the July 28th gap crossing at $392.40. Second resistance is July's high crossing at $424.70. First support is the July 7th low crossing at $384.70. Second support is the June 29th low crossing at $374.60.
December soybean oil was higher in overnight trading as it extends the trading range of the past two-weeks. Overnight trading sets the stage for a higher opening when the day session begins trading. Stochastics and the RSI are turning neutral to bullish signaling that sideways to higher prices are possible near-term. Closes above the 20-day moving average crossing at 61.39 would temper the bearish outlook. Closes below the August 8th low crossing at 57.86 would renew the decline off July's high. First resistance is the 75% retracement level of the 2022-2023 decline crossing at 65.45. Second resistance is the 87% retracement level of the 2022-2023 decline crossing at 68.81. First support is the August 8th low crossing at 57.86. Second support is the June 29th low crossing at 54.67.
Thanks much, tallpine!
No major changes to previous thoughts(still bullish beans):
https://www.marketforum.com/forum/topic/98218/
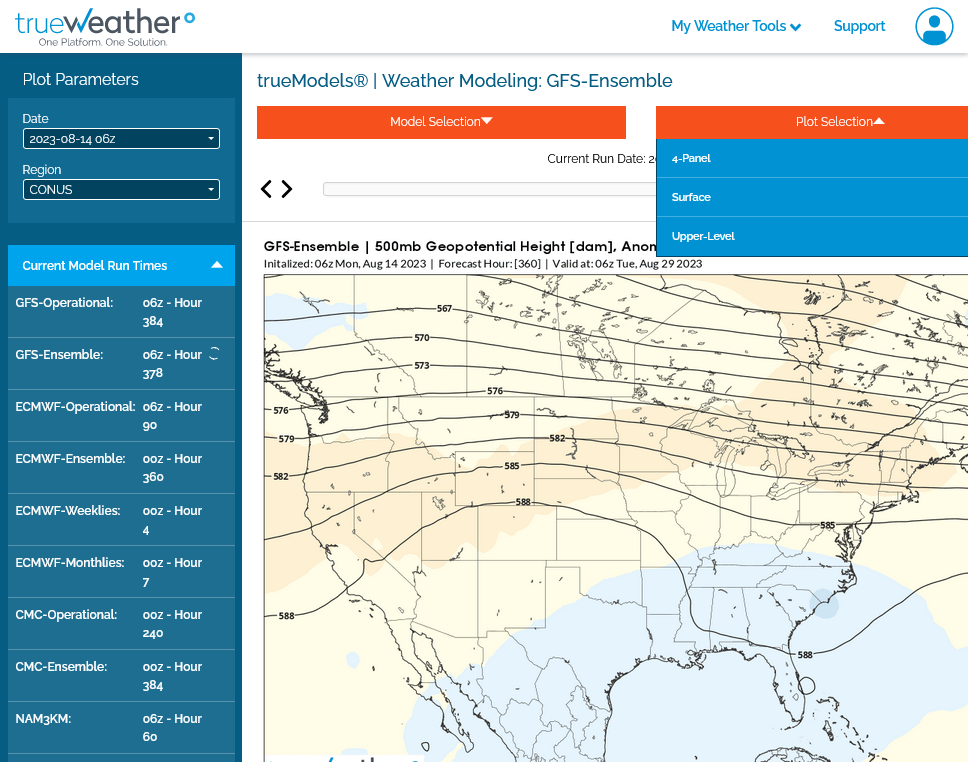
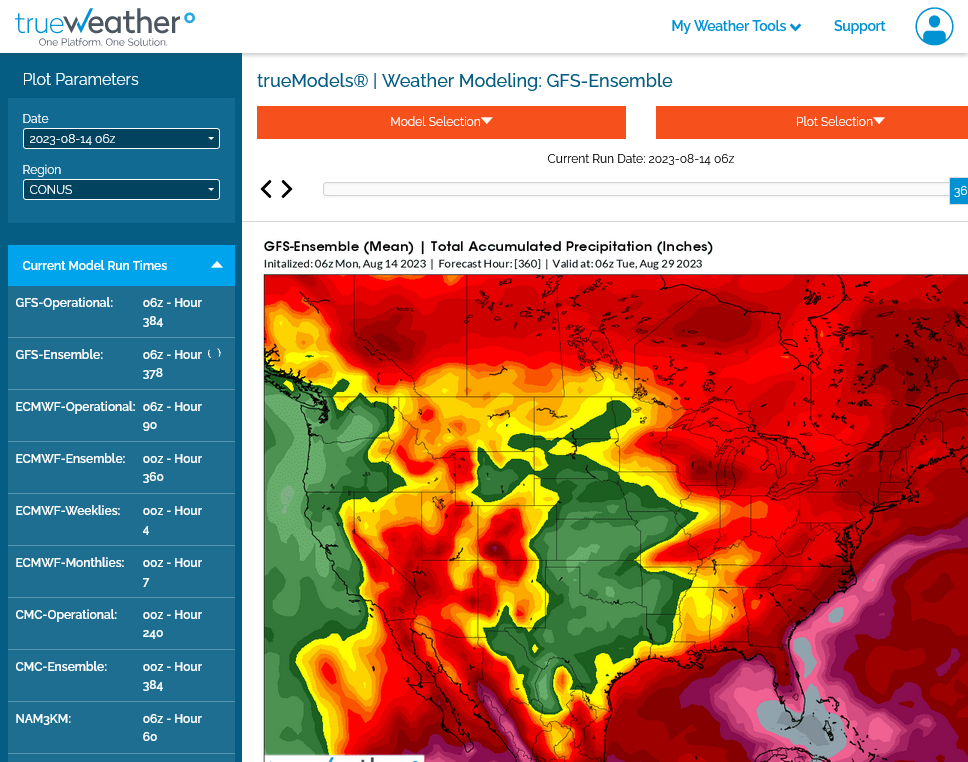
Just out 6z GEFS
1. 500mb-Upper level ridging. Trough in the Southeast will suppress moisture return
2. Total 2 week rain-below average for many places-Great Lakes area to Upper Midwest may be wetter
https://weather.gc.ca/ensemble/charts_e.html?Hour=384&Day=0&RunTime=12&Type=gz
384h GZ 500 forecast valid on Aug 30, 2023 12 UTC


Forecasts for the control (GEM 0) and the 20 ensemble members (global model not available)
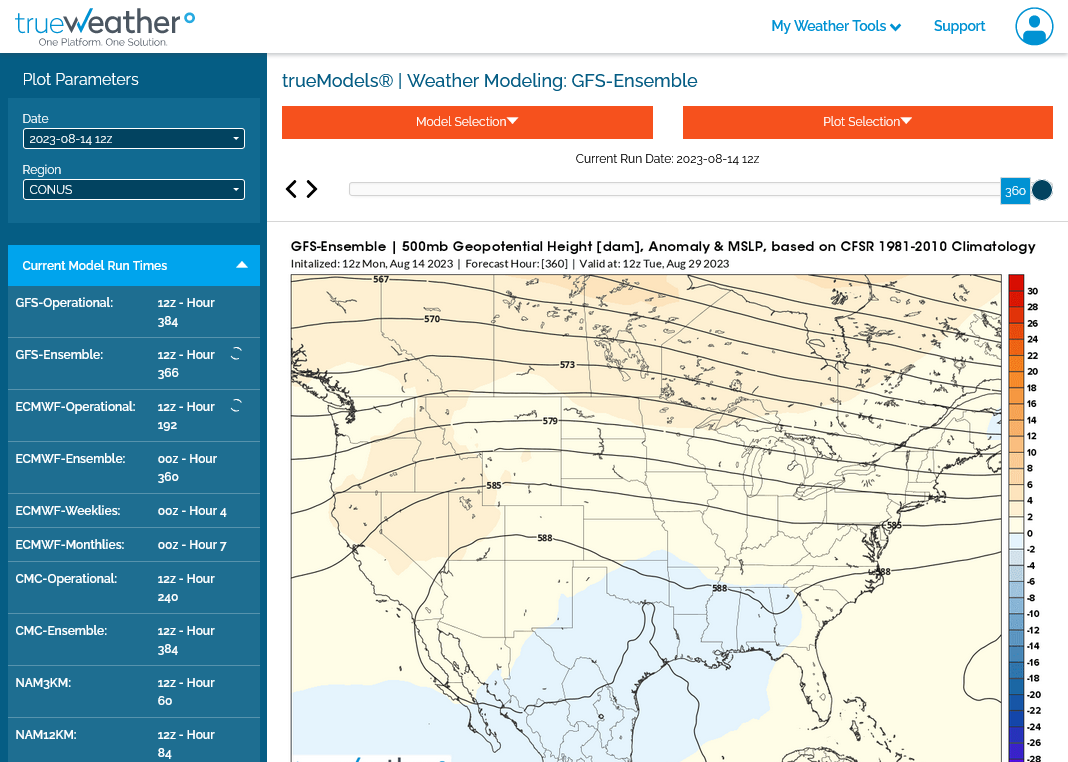
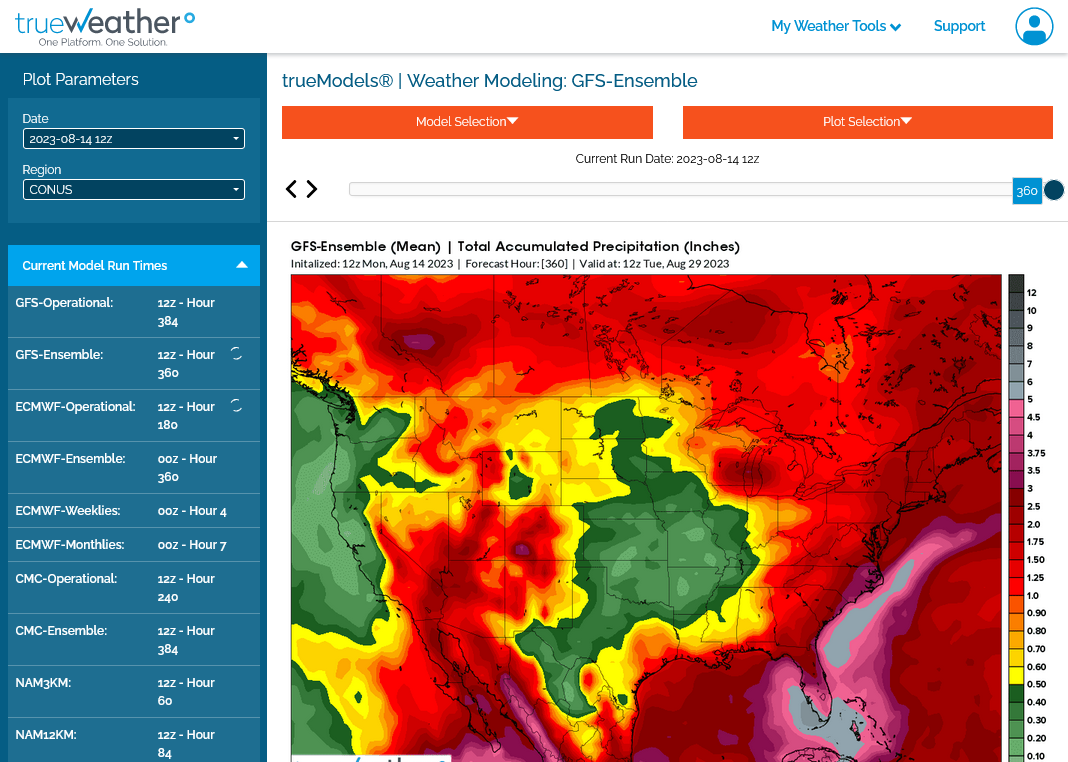
12z GEFS at 360 hours
1. 500 mb. Dry very warm zonal flow. Weakness in the south may suppress moisture return. However, packed lines suggest fast flow and potential perturbations.
2. total rains. Dry in a large section of the middle of the country. Heavy rains off the SE Coast and Fl might mean an increase in tropical activity