KEY EVENTS TO WATCH FOR:
Tuesday, August 15, 2023
8:30 AM ET. August Empire State Manufacturing Survey
Mfg Idx (previous 1.1)
Employment Idx (previous 4.7)
New Orders Idx (previous 3.3)
Prices Received (previous 3.9)
8:30 AM ET. July Advance Monthly Sales for Retail & Food Services
Overall Sales-SA, M/M% (previous +0.2%)
Sales, Ex-Auto, M/M% (previous +0.2%)
Sales, Ex-Auto & Gas, M/M% (previous +0.3%)
8:30 AM ET. July Import & Export Price Indexes
Import Prices (previous -0.2%)
Non-Petroleum Prices (previous -0.3%)
Petroleum Prices (previous +1.1%)
8:55 AM ET. Johnson Redbook Retail Sales Index
Ret Sales Mo-to-Date, Y/Y% (previous +0.3%)
Latest Wk, Y/Y% (previous +0.3%)
10:00 AM ET. June Manufacturing & Trade: Inventories & Sales
Total Inventories (previous +0.2%)
10:00 AM ET. August NAHB Housing Market Index
Housing Mkt Idx (previous 56)
4:00 PM ET. June Treasury International Capital Data
4:30 PM ET. API Weekly Statistical Bulletin
Crude Stocks, Net Chg (Bbls) (previous +4.1M)
Gasoline Stocks, Net Chg (Bbls) (previous -0.4M)
Distillate Stocks, Net Chg (Bbls) (previous -2.1M)
Wednesday, August 16, 2023
7:00 AM ET. MBA Weekly Mortgage Applications Survey
Composite Idx (previous 194.5)
Composite Idx, W/W% (previous -3.1%)
Purchase Idx-SA (previous 149.9)
Purchase Idx-SA, W/W% (previous -2.7%)
Refinance Idx (previous 416.1)
Refinance Idx, W/W% (previous -4.0%)
8:30 AM ET. July New Residential Construction - Housing Starts and Building Permits
Total Starts (expected 1.45M; previous 1.434M)
Housing Starts, M/M% (expected +1.1%; previous -8%)
Building Permits (expected 1.48M; previous 1.440M)
Building Permits, M/M% (expected +2.8%; previous -3.7%)
9:15 AM ET. July Industrial Production & Capacity Utilization
Industrial Production, M/M% (expected +0.3%; previous -0.5%)
Capacity Utilization % (expected 79.1%; previous 78.9%)
Capacity Utilization, Net Chg (Pts) (previous -0.5)
10:30 AM ET. EIA Weekly Petroleum Status Report
Crude Oil Stocks (Bbl) (previous 445.622M)
Crude Oil Stocks, Net Chg (Bbl) (previous +5.851M)
Gasoline Stocks (Bbl) (previous 216.42M)
Gasoline Stocks, Net Chg (Bbl) (previous -2.661M)
Distillate Stocks (Bbl) (previous 115.447M)
Distillate Stocks, Net Chg (Bbl) (previous -1.706M)
Refinery Usage (previous 93.8%)
Total Prod Supplied (Bbl/day) (previous 20.727M)
Total Prod Supplied, Net Chg (Bbl/day) (previous +0.704M)
2:00 PM ET. Federal Open Market Committee meeting minutes published
The STOCK INDEXES? http://quotes.ino.com/ex?changes/?c=indexes
The Dow posted an inside day with a higher close on Monday as it extends the trading range of the past three-weeks. The high-range close sets the stage for a steady to higher opening when Tuesday's day session begins trading. Stochastics and the RSI are neutral to bullish signaling that sideways to higher prices are possible near-term. If the Dow renews the rally off July's low, the February-2022 high crossing at 35,824.28 is the next upside target. Closes below last-Tuesday's low crossing at 35,007.41 would confirm that a short-term top has been posted while opening the door for additional weakness near-term. First resistance is the August 1st high crossing at 35,679.13. Second resistance is the February-2022 high crossing at 35,824.28. First support is last-Tuesday's low crossing at 35,007.41. Second support is the 50-day moving average crossing at 34,545.75.
The September NASDAQ 100 closed higher on Monday as it consolidates some of the decline off July's high. The high-range close sets the stage for a steady to higher opening when Tuesday's night session begins trading. Stochastics and the RSI are oversold but remain neutral to bearish signaling sideways to lower prices are possible. If September extends the decline off July's high, the 25% retracement level of the 2022-2023 rally crossing at 14,789.53 is the next downside target. Closes above the 20-day moving average crossing at 15,539.09 would signal that a short-term low has been posted. First resistance is the July 19th high crossing at 16,062.75. Second resistance is the December-2021 high on the weekly continuation chart crossing at 16,659.50. First support is the 25% retracement level of the 2022-2023 rally crossing at 14,789.53. Second support is June's low crossing at 14,420.00.
The September S&P 500 closed higher on Monday. The high-range close sets the stage for a steady to higher opening when Tuesday's night session begins trading. Stochastics and the RSI are oversold but remain neutral to bearish signaling that sideways to lower prices are possible near-term. Closes below the 50-day moving average crossing at 4477.61 would open the door for additional weakness near-term. Closes above the 20-day moving average crossing at 4551.69 would temper the near-term bearish outlook. First resistance is July's high crossing at 4634.50. Second resistance is the 87% retracement level of the 2022 decline on the weekly chart crossing at 4639.37. First support is the 50-day moving average crossing at 4477.61. Second support is July's low crossing at 4411.25.
INTEREST RATES? http://quotes.ino.com/ex?changes/?c=interest ""
September T-bonds closed down 7/32's at 120-17.
September T-bonds closed lower on Monday. The low-range close sets the stage for a steady to lower opening when Tuesday's day session begins trading. Stochastics and the RSI have turned neutral to bearish signaling that sideways to lower prices are possible near-term. If September renews the decline off July's high, the 50% retracement level of the 1980-2020 rally on the monthly continuation chart crossing at 118-21 is the next downside target. Closes above the 20-day moving average crossing at 123-24 would signal that a short-term low has been posted. First resistance is the 20-day moving average crossing at 123-24. Second resistance is the 50-day moving average crossing at 125-14. First support is the August 4th low crossing at 119-25. Second support is the 50% retracement level of the 1980-2020 rally on the monthly continuation chart crossing at 118-21.
September T-notes closed down 80-pts. at 109.300.
September T-notes closed lower on Monday as it extended the decline off last-Thursday's high. The high-range close sets the stage for a steady to slightly lower opening when Tuesday's day session begins trading. Stochastics and the RSI have turned neutral to bearish signaling that sideways to lower prices are possible near-term. If September renews the decline off July's high, the October-2022 low crossing at 108.265 is the next downside target. Closes above the 50-day moving average crossing at 112.056 would signal that a short-term low has been posted. First resistance is the 20-day moving average crossing at 111.125. Second resistance is the 50-day moving average crossing at 112.056. First support is the August 4th low crossing at 109.240. Second support is the October-2022 low crossing at 108.265.
ENERGY MARKETS? http://quotes.ino.com/ex?changes/?c=energy ""
September crude oil closed lower on Monday.The mid-range close sets the stage for a steady to lower opening when Tuesday's day session begins. Stochastics and the RSI are turning neutral to bearish signaling that sideways to lower prices are possible near-term. Closes below the 20-day moving average crossing at $80.31 would signal that a short-term top has been posted. If September extends the rally off June's low, the 75% retracement level of the 2022-2023 decline on the weekly chart crossing at $88.47 is the next upside target. First resistance is the 62% retracement level of the 2022-2023 decline on the weekly chart crossing at $84.20. Second resistance is the 75% retracement level of the 2022-2023 decline on the weekly chart crossing at $88.47. First support is the 20-day moving average crossing at $80.31. Second support is the 50-day moving average crossing at $75.02.
September heating oil closed lower on Monday as it consolidated some of the rally off May's low. The low-range close sets the stage for a steady to lower opening when Tuesday's day trading session begins. Stochastics and the RSI are overbought and are turning neutral to bearish signaling that sideways to lower prices are possible near-term. Closes below last-Tuesday's low crossing at 2.9374 would signal that a short-term top has been posted. If September extends the rally off May's low, the June-2022 high crossing at 3.2700 is the next upside target. First resistance is last-Thursday's high crossing at 3.2310. Second resistance is the June-2022 high crossing at 3.2700. First support is last-Tuesday's low crossing at 2.9374. Second support the 20-day moving average crossing at 2.9338.
September unleaded gas closed lower on Monday as it consolidated some of the rally off May's low. The low-range close sets the stage for a steady to lower opening when Tuesday's day session begins trading. Stochastics and the RSI are overbought but remain neutral to bullish signaling that sideways to higher prices are possible near-term. If September extends the rally off the June 23rd low, the October-2022 high on the weekly continuation chart crossing at 3.0221 is the next upside target. Closes below the August 3rd low crossing at 2.7131 would confirm that a short-term top has been posted while opening the door for additional weakness near-term. First resistance is last-Friday's high crossing at 2.9859. Second resistance is the October-2022 high on the weekly continuation chart crossing at 3.0221. First support is the 20-day moving average crossing at 2.8223. Second support is the August 3rd low crossing at 2.7131.
September Henry natural gas closed slightly higher on Monday.The high-range close sets the stage for a steady to slightly higher opening when Tuesday's day session begins trading. Stochastics and the RSI are neutral to bearish signaling that sideways to lower prices are possible near-term. Closes below the 50-day moving average crossing at 2.618 would signal that a short-term top has been posted. If September extends the rally off the August 2nd low, the 25% retracement level of the 2022-2023 decline crossing at 3.193 is the next upside target. First resistance is last-Wednesday's high crossing at 3.018. Second resistance is the 25% retracement level of the 2022-2023 decline crossing at 3.193. First support is the August 2nd low crossing at 2.457. Second support is the June 1st low crossing at 2.249.
CURRENCIES? http://quotes.ino.com/ex?changes/?c=currencies ""
The September Dollar closed higher on Monday as it extends the rally off July's low. The high-range close sets the stage for a steady to higher opening when Tuesday's session begins trading. Stochastics and the RSI are overbought but remain neutral to bullish signaling that sideways to higher prices are possible near-term. If September extends the rally off July's low, May's high crossing at 104.205 is the next upside target. Closes below last-Thursday's low crossing at 101.600 would signal that a short-term top has been posted. First resistance is today's high crossing at 103.325. Second resistance is May's high crossing at 104.205. First support is last-Thursday's low crossing at 101.600. Second support is the 20-day moving average crossing at 101.583.
The September Euro closed lower on Monday. The low-range close sets the stage for a steady to lower opening when Tuesday's day session begins trading. Stochastics and the RSI are oversold but remain neutral to bearish signaling that sideways to lower prices are possible near-term. If September extends the decline off July's high, July's low crossing at 1.08715 is the next downside target. Closes above the 20-day moving average crossing at 1.10537 would signal that a short-term low has been posted. First resistance is the 20-day moving average crossing at 1.10537. Second resistance is the July 27th high crossing at $1.11770. First support is today's low crossing at $1.08920. Second support is July's low crossing at 1.08715.
The September British Pound closed lower on Monday. The mid-range close sets the stage for a steady to lower opening when Tuesday's day session begins trading. Stochastics and the RSI are neutral to bearish signaling sideways to lower prices are possible near-term. If September renews the decline off July's high, the 50% retracement level of the March-July rally crossing at 1.2508 is the next downside target. Closes above the 20-day moving average crossing at 1.2809 would signal that a short-term low has been posted. First resistance is the 20-day moving average crossing at 1.2809. Second resistance is the July 27th high crossing at 1.2999. First support is today's low crossing at 1.2619. Second support is the June 29th low crossing at 1.2594.
The September Swiss Franc closed lower on Monday as it extends the decline off July's high. The mid-range close sets the stage for a steady to lower opening when Tuesday's day session begins trading. Stochastics and the RSI are oversold but remain neutral to bearish signaling that sideways to lower prices are possible near-term. Closes below the 50-day moving average crossing at 1.13994 would open the door for additional weakness near-term. Closes above the 20-day moving average crossing at 1.15468 would signal that a short-term low has been posted. First resistance is the 20-day moving average crossing at 1.15468. Second resistance is the July 18th high crossing at 1.17650. First support is 50-day moving average crossing at 1.13994. Second support is the June 30th low crossing at 1.11790.
The September Canadian Dollar closed lower on Monday. The low-range close sets the stage for a steady to lower opening when Tuesday's day session begins trading. Stochastics and the RSI are oversold but remain neutral to bullish signaling that sideways to higher prices are possible near-term. If September extends the decline off July's high, the 62% retracement level of the March-July rally crossing at 74.01 is the next downside target. Closes above the 20-day moving average crossing at 75.29 would signal that a short-term low has been posted. First resistance is the 10-day moving average crossing at 74.72. Second resistance is the 20-day moving average crossing at 75.29. First support is the 62% retracement level of the March-July rally crossing at 74.01. Second support is the 75% retracement level of the March-July rally crossing at 73.49.
The September Japanese Yen closed lower on Monday as it extends this year's decline. The low-range close sets the stage for a steady to lower opening when Tuesday’s day session begins trading. Stochastics and the RSI are oversold but remain neutral to bearish signaling that sideways to lower prices are possible near-term. If September extends the decline off the July 14th high, the October-2022 low on the weekly continuation chart crossing at 0.066235 is the next downside target.Closes above the 50-day moving average crossing at 0.071379 would signal that a short-term low has been posted. First resistance is the 50-day moving average crossing at 0.071379. Second resistance is the July 28th high crossing at 0.073015. First support is today's low crossing at 0.069060. Second support is the October-2022 low crossing at 0.069270.
PRECIOUS METALS? http://quotes.ino.com/ex?changes/?c=metals ""
December gold closed lower on Monday as it extends the decline off July's high. The mid-range close sets the stage for a steady to lower opening when Tuesday's day session begins trading. Stochastics and the RSI are oversold but remain neutral to bearish signaling that sideways to lower prices are possible near-term. If December extended the decline off July's high, the 50% retracement level of the 2022-2023-rally crossing at $1919.90 is the next downside target. Closes above the 50-day moving average crossing at $1986.20 would signal that a short-term low has been posted. First resistance is the 50-day moving average crossing at $1986.20. Second resistance is July's high crossing at $2028.60. First support is today's low crossing at $1934.20. Second support is the 50% retracement level of the 2022-2023-rally crossing at $1919.90.
September silver closed lower on Monday as it extends the decline off July's high. The mid-range close sets the stage for a steady to lower opening when Tuesday's day session begins trading. Stochastics and the RSI are oversold but remain neutral to bearish signaling that sideways to lower prices are possible near-term. If September extends the decline off July's high, June's low crossing at 22.340 is the next downside target. Closes above the 50-day moving average crossing at 23.851 would signal that a short-term low has been posted. First resistance is the 50-day moving average crossing at 23.851. Second resistance is the 20-day moving average crossing at 24.062. First support is the 50% retracement level of the 2022-2023-rally crossing at 22.450. Second support is the 62% retracement level of the 2022-2023-rally crossing at 21.452.
September copper closed slightly higher on Monday as it consolidated some of this month's decline. The high-range close sets the stage for a steady to slightly higher opening when Tuesday's day session begins trading. Stochastics and the RSI are oversold but remain neutral to bearish signaling that sideways to lower prices are possible near-term. If September extends this month's decline, May's low crossing at 3.5650 is the next downside target. Closes above the 20-day moving average crossing at 3.8446 would signal that a short-term low has been posted. First resistance is the 20-day moving average crossing at 3.8446. Second resistance is August's high crossing at 4.0240. First support is the June 29th low crossing at 3.6830. Second support is May's low crossing at 3.5650.
GRAINS? http://quotes.ino.com/ex?changes/?c=grains "
December Corn closed up $0.00 1/2-cents at $4.87 3/4.
December corn closed fractionally higher on Monday leaving last-Friday's key reversal down unconfirmed. The mid-range close sets the stage for a steady to higher opening when Tuesday's night session begins trading. Stochastics and the RSI are oversold but remain bearish signaling that sideways to lower prices are possible near-term. If December extends the decline off July's high, the September-2021 low on the weekly chart crossing at $4.62 1/2 is the next downside target. Closes above the 50-day moving average crossing at $5.31 1/4 would signal that a short-term low has been posted. First resistance is the 20-day moving average crossing at $5.19 1/2. Second resistance is the 50-day moving average crossing at $5.31 1/4. First support is July's low crossing at $4.81. Second support is the September-2021 low on the weekly chart crossing at $4.62 1/2.
September wheat closed down $0.10 3/4-cents at $6.16.
September wheat closed lower on Monday. The low-range close sets the stage for a steady to lower opening when Tuesday's day session begins trading. Stochastics and the RSI are oversold but remain neutral to bearish signaling that sideways to lower prices are possible near-term. If September extends the decline off July's high, May's low crossing at $5.87 3/4 is the next downside target. Closes above the 20-day moving average crossing at $6.76 would signal that a short-term low has been posted. First resistance is the 20-day moving average crossing at $6.76. Second resistance is July's high crossing at $7.77 1/4. First support is today's low crossing at $6.05 1/4. Second support is May's low crossing at $5.87 3/4.
September Kansas City Wheat closed down $0.05 1/4-cents at $7.50 1/2.
September Kansas City wheat closed lower on Monday as it extended the decline off July's high and tested May's low crossing at $7.33. The mid-range close sets the stage for a steady to lower opening when Tuesday's day session begins trading. Stochastics and the RSI are oversold but remain bearish signaling that sideways to lower prices are possible near-term. Closes below May's low crossing at $7.33 would mark a downside breakout of the December-August trading range. Closes above the 20-day moving average crossing at $8.18 1/4 would signal that a short-term low has been posted. First resistance is the 10-day moving average crossing at $7.68 1/4. Second resistance is the 50-day moving average crossing at $8.18 1/4. First support is May's low crossing at $7.33. Second support is the December-2021 low crossing at $7.29 1/2.
September Minneapolis wheat closed down $0.09 1/2-cents crossing at $8.05 1/2.
September Minneapolis wheat closed lower on Monday as it extends the decline off July's high. The low-range close sets the stage for a steady to lower opening when Tuesday's day session begins trading. Stochastics and the RSI are oversold but remain bearish signaling that sideways to lower prices are possible near-term. If September extends the decline off July's high, the June 7th low crossing at $7.92 3/4 is the next downside target. Closes above the 20-day moving average crossing at $8.62 3/4 would signal that a short-term low has been posted. First resistance is the 10-day moving average crossing at $8.27. Second resistance is the 50-day moving average crossing at $8.49 1/2. First support is June 7th low crossing at $7.92 3/4. Second support is the May 31st low crossing at $7.78 1/4.
SOYBEAN COMPLEX? http://quotes.ino.com/ex?changes/?c=grains "
November soybeans closed up $0.18 1/2-cents at $13.26.
November soybeans closed higher on Monday as it extends the rebound off the 50% retracement level of the May-July rally crossing at $12.82 3/4. The high-range close sets the stage for a steady to higher opening when Tuesday's day session begins trading. Stochastics and the RSI are oversold but are turning neutral to bullish signaling that sideways to higher prices are possible near-term. Closes above the 20-day moving average crossing at $13.58 3/4 would confirm that a short-term low has been posted. If November renews the decline off July's high, the June 28th low crossing at $12.56 3/4 is the next downside target. First resistance is the 20-day moving average crossing at $13.58 3/4. Second resistance is the July 31st gap crossing at $13.79. First support is the June 28th low crossing at $12.56 3/4. Second support is the 62% retracement level of the May-July rally crossing at $12.46 3/4.
December soybean meal closed up $3.30 at $392.00.
December soybean meal posted an inside day with a higher close on Monday leaving last-Friday's key reversal down unconfirmed. The mid-range close sets the stage for a steady opening when Tuesday's day session begins trading. Stochastics and the RSI are oversold but remain neutral to bearish signaling that sideways to lower prices are possible near-term. Closes below last-Monday's low crossing at $387.20 would open the door for additional weakness near-term. Closes above the 20-day moving average crossing at $402.50 would signal that a short-term low has been posted. First resistance is last-Friday's high crossing at $407.70. Second resistance is July's high crossing at $424.70. First support is last-Monday's low crossing at $387.20. Second support is the July 7th low crossing at $384.70.
December soybean oil closed up 93 pts. at 61.15.
December soybean oil closed higher on Monday. The high-range close sets the stage for a steady to slightly higher opening when Tuesday's day session begins trading. Stochastics and the RSI have turned neutral to bullish signaling that sideways to higher prices are possible near-term. Closes above the 20-day moving average crossing at 61.41 would signal that a short-term low has been posted. Closes below last-Tuesday's low crossing at 57.86 would renew the decline off July's high. First resistance is the 20-day moving average crossing at 61.41. Second resistance is July's high crossing at 65.58. First support is last-Tuesday's low crossing at 57.86. Second support is the June 29th low crossing at 54.67.
LIVESTOCKhttp://quotes.ino.com/exchanges/?c=livestock
October hogs closed down $2.18 at $79.15.
October hogs closed lower on Monday as it extended the decline off August's high. The low-range close sets the stage for a steady to lower opening when Tuesday's day session begins trading. Stochastics and the RSI are oversold but remain neutral to bearish with signaling that sideways to lower prices are possible near-term. If October extends the decline off August's high, the June 30th low crossing at $77.58 is the next downside target. Closes above the 20-day moving average crossing at $83.22 would signal that a short-term low has been posted. First resistance is August's high crossing at $86.75. Second resistance is the 75% retracement level of the April-May decline crossing at $87.50. First support is the June 30th low crossing at $77.58. Second support is the June 8th low crossing at $74.03.
October cattle closed down $0.65 at $180.68.
October cattle closed lower on Monday. The low-range close sets the stage for a steady to lower opening on Tuesday. Stochastics and the RSI are turning neutral to bearish signaling that sideways to lower prices are possible near-term. If October extends the decline off July's high, the 50-day moving average crossing at $178.78 is the next downside target. If October renews this year's rally into uncharted territory, upside targets will be hard to project. First resistance is July's high crossing at $185.75. Second resistance is unknown. First support is the 50-day moving average crossing at $178.78. Second support is July's low crossing at $176.20.
October Feeder cattle closed down $1.03 at $251.85.
October Feeder cattle closed lower on Monday as it extends the July-August trading range. The low-range close sets the stage for a steady to lower opening when Tuesday's day session begins trading. Stochastics and the RSI are neutral to bearish signaling that sideways to lower prices are possible near-term. Closes below the July 6th low crossing at $246.03 would mark a downside breakout of the aforementioned trading range. If October extends the rally off June's low into uncharted territory, upside targets will be hard to project. First resistance is last-Monday's high crossing at $256.25. Second resistance is unknown. First support is the 50-day moving average crossing at $248.02. Second support is the July 6th low crossing at $246.03.
FOOD & FIBERhttp://quotes.ino.com/ex changes/?c=food
September coffee closed sharply lower on Monday as it renewed the decline off April's high. The low-range close sets the stage for a steady to lower opening on Tuesday. Stochastics and the RSI are neutral to bearish signaling sideways to lower prices are possible near-term. If September extends the decline off June's high, the January low crossing at $14.46 is the next downside target. Closes above the 50-day moving average crossing at $16.61 would signal that a short-term low has been posted. First resistance is the 50-day moving average crossing at $16.61. Second resistance is May's low crossing at $17.32. First support is today's low crossing at $15.07. Second support is the January low crossing at $14.46.
September cocoa closed slightly higher on Monday as it consolidates some of the decline off August's high. The high-range close sets the stage for a steady to higher opening on Tuesday. Stochastics and the RSI are oversold but remain bearish signaling that sideways to lower prices are possible near-term. If September extends the decline off August's high, the 38% retracement level of the 2022-2023 rally crossing at 30.95 is the next downside target. Closes above the 20-day moving average crossing at 34.40 would signal that a short-term low has been posted.
October sugar posted an inside day with a lower close on Monday. The low-range close sets the stage for a steady to lower opening on Tuesday. Stochastics and the RSI are neutral to bullish signaling that sideways to higher prices are possible near-term. If October renews the rally off June's low, June's high crossing at 26.19 is the next upside target. If October extends the decline off July's high, the July 7th low crossing at 23.11 is the next downside target.
December cotton closed lower on Monday as it consolidated some of the rally off June's low. The mid-range close sets the stage for a steady to lower opening on Tuesday. Stochastics and the RSI are neutral to bullish signaling sideways to higher prices are possible near-term. If December extends the rally off June's low, the 75% retracement level of the May-July decline crossing at 91.29 is the next upside target. Closes below the 20-day moving average crossing at 85.23 would confirm that a short-term top has been posted while opening the door for additional weakness near-term.
Thanks much, tallpine!
The crop condition for beans improved even MORE than expected at +5%. WOW!
https://www.marketforum.com/forum/topic/98218/
https://www.marketforum.com/forum/topic/98218/#98258
No matter how bullish the forecast is, that's the biggest August improvement ever and means we open lower........maybe by as much as 10c for the beans.
With the growing season running out and the market needing to adjust the crop bigger than the one the USDA told us was out there last Friday, it's going to be much harder to go higher than it would ordinarily be if the crop was moisture stressed right now and the hot/dry would hurt.
2 weeks of no rain and some major heat next week is probably going to set back crop conditions 2 weeks from now but +5% stings for the bulls.
It could make for extreme volatility. An extreme improvement in the crop vs no rain for 2 weeks( in the southeastern 2/3 of the Cornbelt) and 10 days of major heat to end the month.
I might still be interested in getting long again(like earlier today) but only after the market has fully digested this bearish shocker.
Don't read anything into that as I'm watching tonight and tomorrow early.
Last European model
1. Upper level ridging with some rains around the periphery
2. Dry for at least the southern half of the Cornbelt
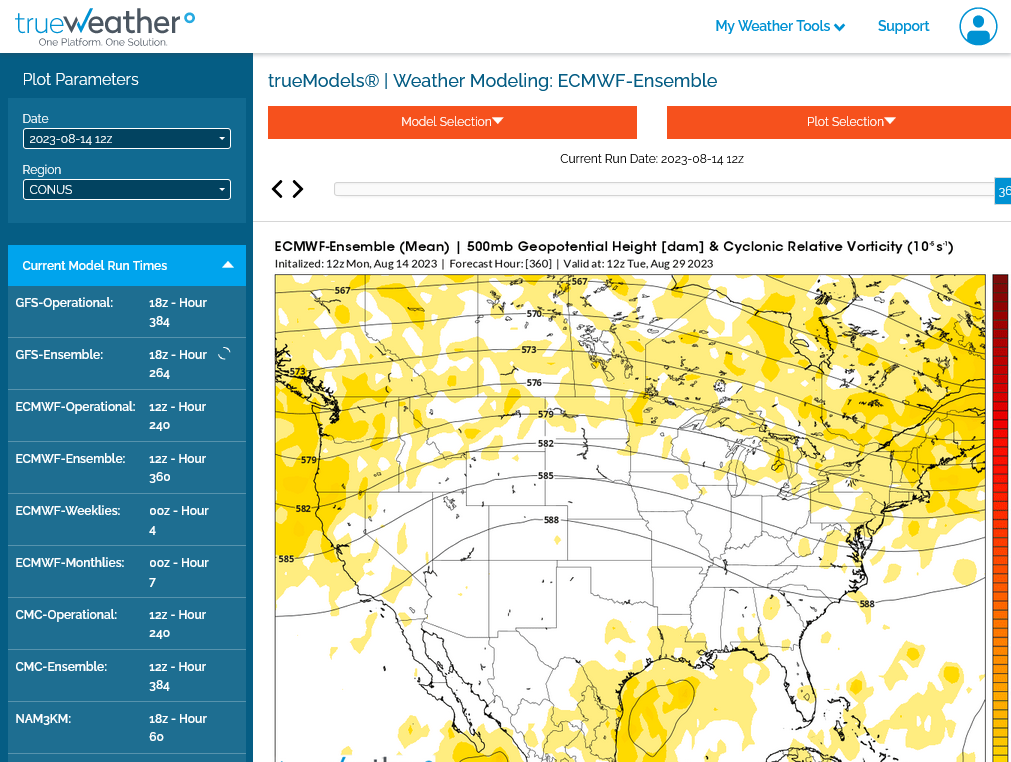
If not for the huge increase in the crop ratings for beans, +5%, this would be bullish.
It likely will end up being bullish but we first need to dial in that record 1 week improvement.....IN AUGUST, when beans are filling pods, extremely key time frame.... so this just boosted yields.
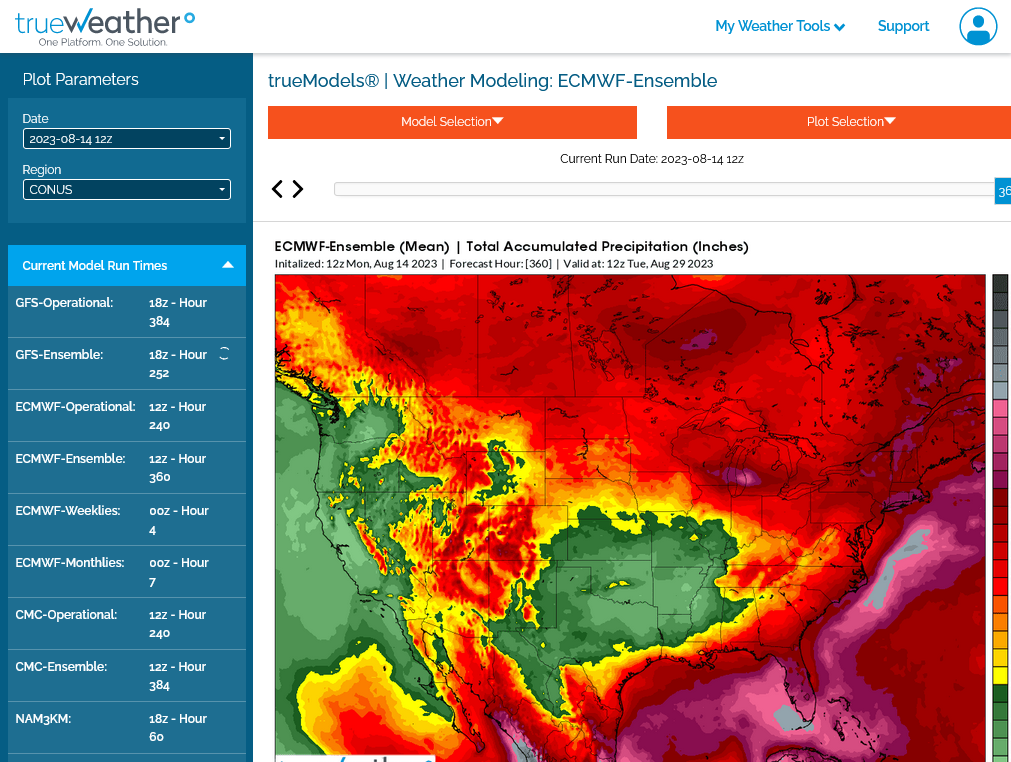
7 Day Total precipitation below:
http://www.wpc.ncep.noaa.govcdx /qpf/p168i.gif?1530796126

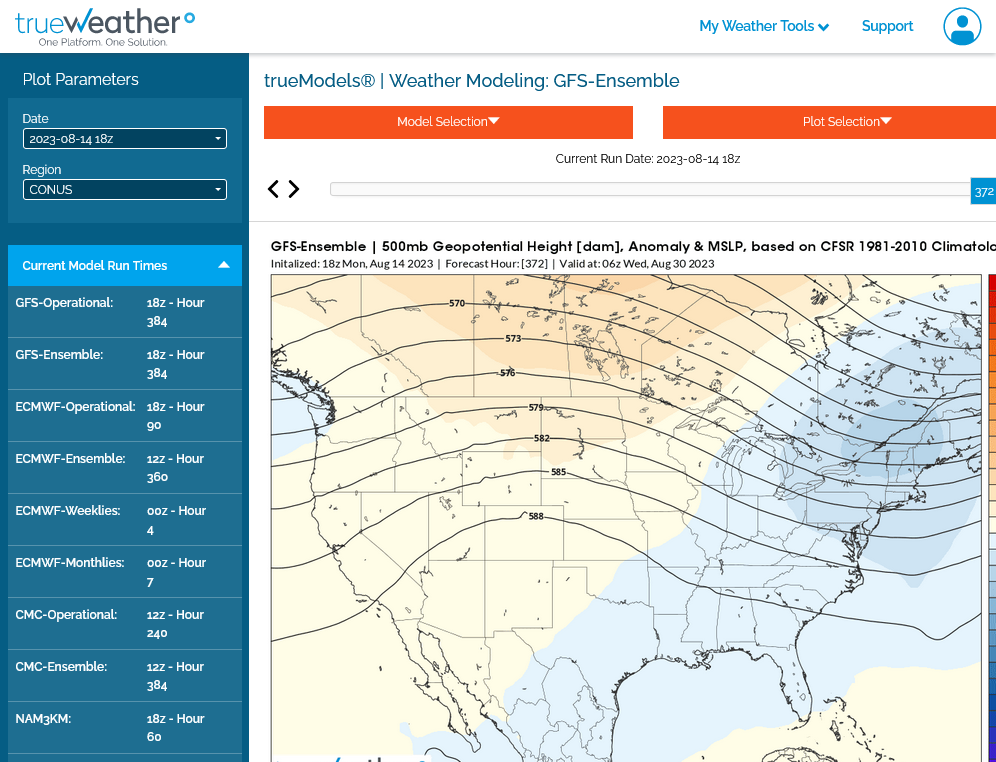
Extended weather.
https://www.cpc.ncep.noaa.gov/products/predictions/610day/ | |||||||||
| 6 to 10 day outlooks | |||||||||
| Click below for information about how to read 6-10 day outlook maps Temperature Precipitation | |||||||||
| Click below for archives of past outlooks (data & graphics), historical analogs to todays forecast, and other formats of the 6-10 day outlooks ArchivesAnalogsLines-Only FormatGIS Data | |||||||||
Temperature Probability | |||||||||
Precipitation Probability | |||||||||
Just updated 18z GEFS.
1. 500 mb August 30. Ridge in the Plains, trough along the NE/E Coast.
2. Total rains.........no more rain this month in the Midwest. Good thing its the end of the growing season!!!
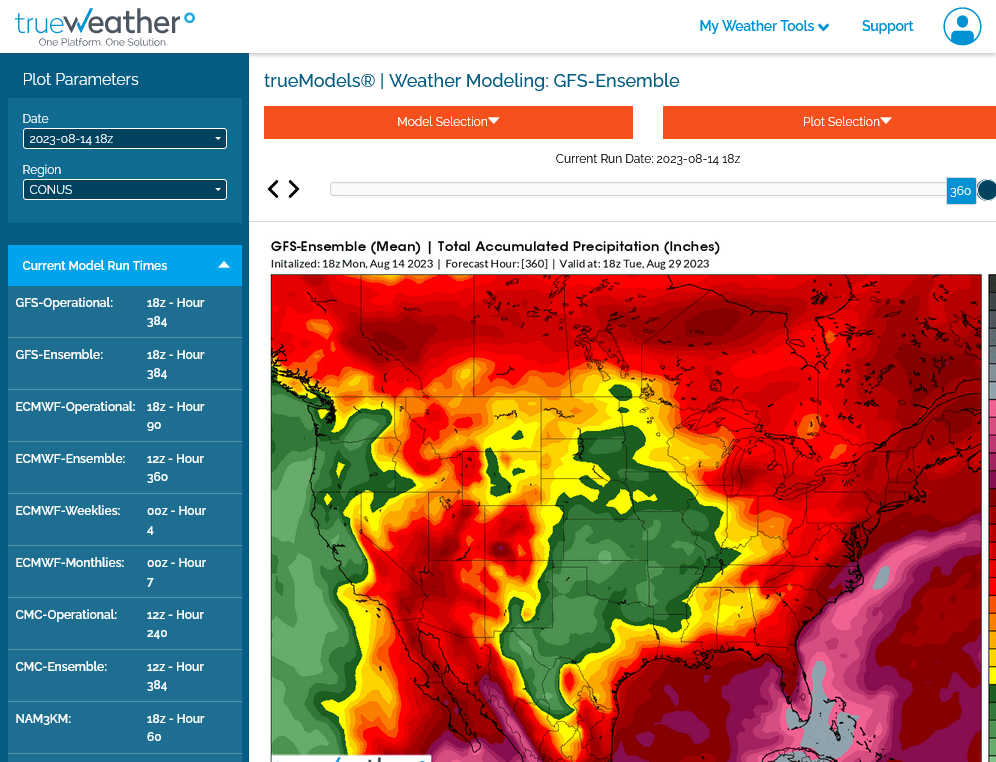
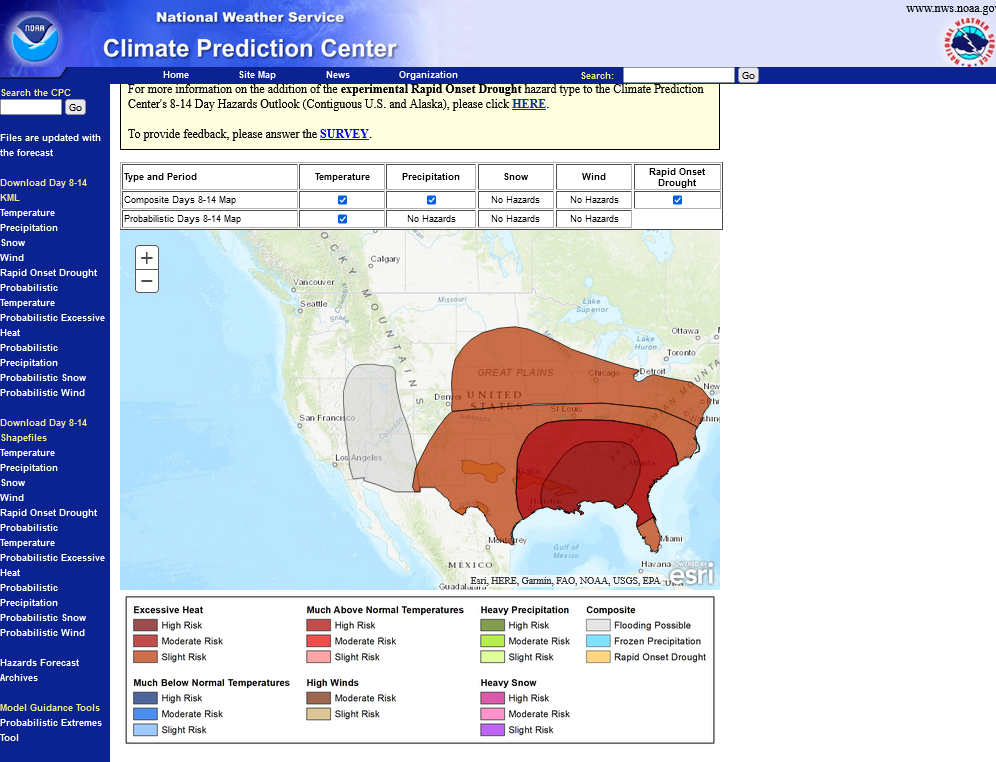
Excessive heat risk in different shades of red.
Gray is heavy rain threat in the Southwest.
https://www.cpc.ncep.noaa.gov/products/predictions/threats/threats.php
Not surprising, we opened down almost -10c yesterday evening, then after midnight, when the last model update came out without much rain, we spiked to +8c higher and tested the USDA spike higher on Friday(which filled a gap lower from Aug 6(Sunday NIght) from all the rains that fell last week.
Now, we're back to -6c.
A battle between the hot/dry bullish forecast the next 2 weeks and the incredible +5 G/E rating for the S crop.
Honestly, I have no idea what the funds will do when we open later this morning.
They could press either side and we make new highs or new lows for the week and leave me easily explaining why they did it.
1. The +5 G/E is going to be rear view window trading stuff at some point.
2. The impressive hot/dry might be with us the rest of the month
3. Current soil moisture has been restored in many places which will make hot/dry less damaging at this late stage.

