KEY EVENTS TO WATCH FOR:
Tuesday, August 15, 2023
8:30 AM ET. August Empire State Manufacturing Survey
Mfg Idx (previous 1.1)
Employment Idx (previous 4.7)
New Orders Idx (previous 3.3)
Prices Received (previous 3.9)
8:30 AM ET. July Advance Monthly Sales for Retail & Food Services
Overall Sales-SA, M/M% (previous +0.2%)
Sales, Ex-Auto, M/M% (previous +0.2%)
Sales, Ex-Auto & Gas, M/M% (previous +0.3%)
8:30 AM ET. July Import & Export Price Indexes
Import Prices (previous -0.2%)
Non-Petroleum Prices (previous -0.3%)
Petroleum Prices (previous +1.1%)
8:55 AM ET. Johnson Redbook Retail Sales Index
Ret Sales Mo-to-Date, Y/Y% (previous +0.3%)
Latest Wk, Y/Y% (previous +0.3%)
10:00 AM ET. June Manufacturing & Trade: Inventories & Sales
Total Inventories (previous +0.2%)
10:00 AM ET. August NAHB Housing Market Index
Housing Mkt Idx (previous 56)
4:00 PM ET. June Treasury International Capital Data
4:30 PM ET. API Weekly Statistical Bulletin
Crude Stocks, Net Chg (Bbls) (previous +4.1M)
Gasoline Stocks, Net Chg (Bbls) (previous -0.4M)
Distillate Stocks, Net Chg (Bbls) (previous -2.1M)
Wednesday, August 16, 2023
7:00 AM ET. MBA Weekly Mortgage Applications Survey
Composite Idx (previous 194.5)
Composite Idx, W/W% (previous -3.1%)
Purchase Idx-SA (previous 149.9)
Purchase Idx-SA, W/W% (previous -2.7%)
Refinance Idx (previous 416.1)
Refinance Idx, W/W% (previous -4.0%)
8:30 AM ET. July New Residential Construction - Housing Starts and Building Permits
Total Starts (expected 1.45M; previous 1.434M)
Housing Starts, M/M% (expected +1.1%; previous -8%)
Building Permits (expected 1.48M; previous 1.440M)
Building Permits, M/M% (expected +2.8%; previous -3.7%)
9:15 AM ET. July Industrial Production & Capacity Utilization
Industrial Production, M/M% (expected +0.3%; previous -0.5%)
Capacity Utilization % (expected 79.1%; previous 78.9%)
Capacity Utilization, Net Chg (Pts) (previous -0.5)
10:30 AM ET. EIA Weekly Petroleum Status Report
Crude Oil Stocks (Bbl) (previous 445.622M)
Crude Oil Stocks, Net Chg (Bbl) (previous +5.851M)
Gasoline Stocks (Bbl) (previous 216.42M)
Gasoline Stocks, Net Chg (Bbl) (previous -2.661M)
Distillate Stocks (Bbl) (previous 115.447M)
Distillate Stocks, Net Chg (Bbl) (previous -1.706M)
Refinery Usage (previous 93.8%)
Total Prod Supplied (Bbl/day) (previous 20.727M)
Total Prod Supplied, Net Chg (Bbl/day) (previous +0.704M)
2:00 PM ET. Federal Open Market Committee meeting minutes published
The STOCK INDEXES? http://quotes.ino.com/ex?changes/?c=indexes
The STOCK INDEXES: The September NASDAQ 100 was lower overnight and sets the stage a lower opening when the day session begins trading. Stochastics and the RSI are oversold but remain neutral to bearish signaling that sideways to lower prices are possible near-term. If September extends the decline off July's high, the 25% retracement level of the 2022-2023 rally crossing at 14,789.53 is the next downside target. Closes above the 20-day moving average crossing at 15,502.86 would temper the near-term bearish outlook. First resistance is the 50-day moving average crossing at 15,181.50. Second resistance is the 20-day moving average crossing at 15,502.86. First support is the 25% retracement level of the 2022-2023 rally crossing at 14,789.53. Second support is the June 8th low crossing at 14,425.00.
The September S&P 500 was lower overnight and sets the stage for a lower opening when the day session begins trading. Stochastics and the RSI are oversold but remain neutral to bearish signaling that sideways to lower prices are possible near-term. Closes below the 50-day moving average crossing at 4480.85 is the next downside target. Closes above the 20-day moving average crossing at 4546.91 would temper the near-term bearish outlook. First resistance is the 20-day moving average crossing at 4546.91. Second resistance is July's high crossing at 4634.50. First support is the 50-day moving average crossing at 4480.85. Second support is July's low crossing at 4411.25.
INTEREST RATES http://quotes.ino.com/ex changes/?c=interest"
INTEREST RATES: September T-bonds were lower overnight as it extends the decline off last-Thursday's high. Overnight trading sets the stage for a lower opening when the day session begins trading. Stochastics and the RSI are oversold but remain neutral to bearish signaling that sideways to lower prices are possible near-term. If September renews the decline off July's high, the October-2022 low on the weekly continuation chart crossing at 117-19 is the next downside target.Closes above the 20-day moving average crossing at 123-12 would signal that a low has been posted. First resistance is the 20-day moving average crossing at 123-12. Second resistance is the 50-day moving average crossing at 125-12. First support is the August 8th low crossing at 119-25. Second support is the October-2022 low on the weekly continuation chart crossing at 117-19 is the next downside target.
September T-notes were lower overnight and sets the stage for a lower opening when the day session begins trading. Stochastics and the RSI are oversold but remain neutral to bearish signaling that sideways to lower prices are possible near-term. If September renews the decline off July's high, the October-2022 low crossing at 108.265 is the next downside target. Closes above the 20-day moving average crossing at 111.074 would signal that a short-term low has been posted. First resistance is the 10-day moving average crossing at 110.218. Second resistance is the 20-day moving average crossing at 111.074. First support is the overnight low crossing at 109.205. Second support is the October-2022 low on the weekly continuation chart crossing at 108.265.
ENERGY MARKETS? http://quotes.ino.com/ex?changes/?c=energy ""
ENERGIES:Septembercrude oil was lower in late-overnight trading as it extends the decline off last-Thursday's high. Overnight trading sets the stage for a lower opening when the day session begins trading. Stochastics and the RSI are bearish signaling that sideways to lower prices are possible near-term. Closes below the 20-day moving average crossing at $80.61 would signal that a short-term top has been posted. If September extends the rally off the June 28th low, the 75% retracement level of the 2022-2023 decline crossing at $88.47 is the next upside target. First resistance is last-Thursday's high crossing at $84.89. Second resistance is the 75% retracement level of the 2022-2023 decline crossing at $88.47. First support is the 20-day moving average crossing at $80.61. Second support is the August 3rd low crossing at $78.69.
September heating oil was slightly lower overnight and sets the stage for a slightly lower opening when the day session begins trading. Stochastics and the RSI have turned bearish signaling that sideways to lower prices are possible near-term. Closes below the 20-day moving average crossing at 2.9578 would signal that a short-term top has been posted. If September renews the rally off May's low, the June-2022 crossing at 3.2700 is the next upside target. First resistance is last-Thursday's high crossing at 3.2310. Second resistance is the June-2022 high crossing at 3.2700. First support is the 20-day moving average crossing at 2.9578. Second support is last-Tuesday's low crossing at 2.9375.
September unleaded gas was slightly lower overnight and sets the stage for a slightly lower opening when the day session begins trading. Stochastics and the RSI are overbought and are turning neutral to bearish signaling that sideways to lower prices are possible near-term. Closes below the August 3rd low crossing at 2.7131 would confirm that a short-term top has been posted while opening the door for additional weakness near-term. If September extends the rally off the June 23rd low, the October-2022 high on the weekly continuation chart crossing at 3.0221 is the next upside target. First resistance is last-Friday's high crossing at $2.9859. Second resistance is the October-2022 high on the weekly continuation chartcrossing at $3.0221. First support is the 20-day moving average crossing at $2.8357. Second support is August 3rd low crossing at $2.7131.
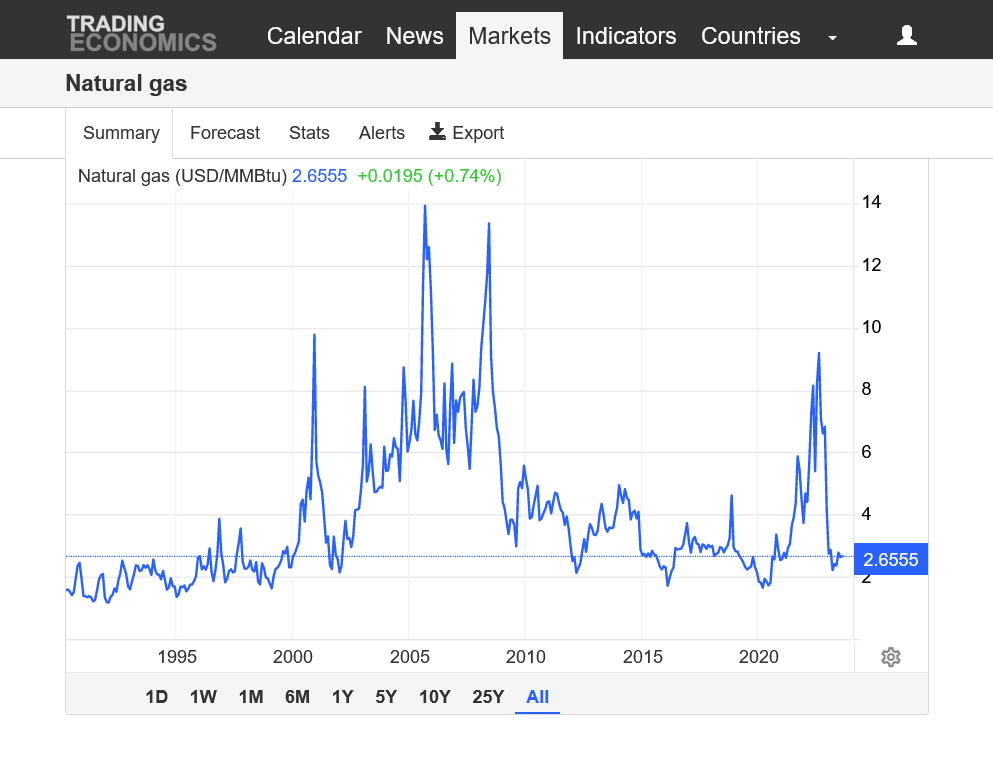
September natural gas was slightly higher overnight and sets the stage for a slightly higher opening when the day session begins trading. Stochastics and the RSI are neutral to bearish signaling that a short-term top appears to have been posted with last-Wednesday's high. Closes below the 50-day moving average crossing at 2.628 would signal that a short-term top has been posted. If September resumes the rally off August's low, the 25% retracement level of the 2022-2023 decline crossing at 3.193 is the next upside target. First resistance is last-Wednesday's high crossing at 3.018. Second resistance is the 25% retracement level of the 2022-2023 decline crossing at 3.193. First support is the 50-day moving average crossing at 2.628. Second support is August's low crossing at 2.457.
CURRENCIEShttp://quotes.ino.com/ex changes/?c=currencies"
CURRENCIES:The September Dollar was steady to slightly lower overnight as it consolidates some of the rally off last-Thursday's low. Overnight weakness sets the stage for a slightly lower opening when the day session begins trading later this morning. Stochastics and the RSI are overbought but remain neutral to bullish signaling that sideways to higher prices are possible near-term. If September extends the rally off July's low, May's high crossing at $104.205 is the next upside target. Closes below last-Thursday's low crossing at $101.600 would signal that a short-term top has been posted. First resistance is July's high crossing at $103.275. Second resistance is May's high crossing at $104.205. First support is last-Thursday's low crossing at $101.600. Second support is the July 27th low crossing at $100.320.
The September Euro was higher overnight as it consolidates some of the decline off last-Thursday's high. Overnight trading sets the stage for a higher opening when the day session begins trading. Stochastics and the RSI are oversold but remain neutral to bearish signaling that sideways to lower prices are possible near-term. If September renews the decline off July's high, July's low crossing at 1.08715 is the next downside target. Closes above the 20-day moving average crossing at $1.10379 would signal that a short-term low has been posted. First resistance is last-Thursday's high crossing at $1.10850. Second resistance is the July 27th high crossing at $1.11770. First support is July's low crossing at 1.08715. Second support is May's low crossing at 1.07025.
The September British Pound was slightly higher overnight and sets the stage for a steady to slightly higher opening when the day session begins trading. Stochastics and the RSI are diverging and are turning neutral to bullish signaling that sideways to higher prices near-term. Closes above last-Thursday's high crossing at 1.2822 would signal that a short-term low has been posted. If September renews the decline off July's high, the 50% retracement level of the March-July rally crossing at 1.2508 is the next downside target. First resistance last-Thursday's high crossing at 1.2822. Second resistance is the July 27th high crossing at 1.2999. First support is the 38% retracement level of the March-July rally crossing at 1.2658. Second support is the 50% retracement level of the March-July rally crossing at 1.2508.
The September Swiss Franc was higher overnight as it extends the trading range of the past three-weeks. Overnight trading sets the stage for a higher opening when the day session begins trading. Stochastics and the RSI are oversold but remain neutral to bearish signaling that sideways to lower prices are possible near-term. Closes below the 50-day moving average crossing at 1.14057 would open the door for a possible test of the June 30th low crossing at 1.11790. Closes above the 20-day moving average crossing at 1.15324 would signal that a short-term low has been posted. First resistance is the 20-day moving average crossing at 1.15325. Second resistance is the July 18th high crossing at 1.17650. First support is the 50-day moving average crossing at 1.14057. Second support is the June 30th low crossing at 1.11790.
The September Canadian Dollar was lower overnight and sets the stage for a lower opening when the day session begins trading. Stochastics and the RSI are oversold but remain neutral to bearish signaling that sideways to lower prices are possible near-term. If September extends the decline off July's high, the 62% retracement level of the March-July rally crossing at $74.01 is the next downside target. Closes above the 20-day moving average crossing at $75.20 would signal that a short-term low has been posted. First resistance is the 10-day moving average crossing at $74.60. Second resistance is the 20-day moving average crossing at $75.20. First support is the 62% retracement level of the March-July rally crossing at $74.01. Second support is the 75% retracement level of the March-July rally crossing at crossing at $73.49.
The September Japanese Yen was steady to slightly lower overnight as it extends this year's decline. Overnight trading sets the stage for a slightly lower opening when the day session begins trading. Stochastics and the RSI are oversold and remain neutral to bearish signaling that sideways to lower prices are possible near-term. If September extends the decline off the July 14th high, the October-2022 low on the weekly continuation chart crossing at 0.066235 is the next downside target. Closes above the 20-day moving average crossing at 0.070743 would signal that a short-term low has been posted. First resistance is the 10-day moving average crossing at 0.069971. Second resistance is the 20-day moving average crossing at 0.070743. First support is the overnight low crossing at 0.068920. Second support is the October-2022 low on the weekly continuation chart crossing at 0.066235.
PRECIOUS METALS http://quotes.ino.com/ex changes/?c=metals"
Precious Metals: December gold was lower overnight as it extends the decline off May's high and sets the stage for a lower opening when the day session begins trading later this morning. Stochastics and the RSI are oversold but remain neutral to bearish signaling that sideways to lower prices are possible near-term. If October extends the decline off July's high, the 62% retracement level of the 2022-2023 rally crossing at $1919.90 is the next downside target. Closes above the 50-day moving average crossing at $1984.80 would confirm that a short-term low has been posted. First resistance is the 50-day moving average crossing at $1984.80. Second resistance is the July 20th high crossing at $2028.60. First support is the overnight low crossing at $1933.20. Second support is the 62% retracement level of the 2022-2023 rally crossing at $1919.90.
September silver was lower overnight as it extends the decline off July's high. Overnight weakness sets the stage for a lower opening when the day session begins trading later this morning. Stochastics and the RSI are oversold but remain neutral to bearish signaling that sideways to lower prices are possible near-term. If September extends the decline off July's high, the 62% retracement level of the 2022-2023 rally crossing at $21.452 is the next downside target. Closes above the 20-day moving average crossing at $23.925 would signal that a short-term low has been posted. First resistance is the 10-day moving average crossing at $23.075. Second resistance is the 50-day moving average crossing at $23.822. First support is the overnight low crossing at $22.405. Second support is the 62% retracement level of the 2022-2023 rally crossing at $21.452.
September copper was sharply lower overnight as it extends the decline off August's high. Overnight trading sets the stage for a sharply lower opening when the day session begins trading. Stochastics and the RSI are oversold but remain neutral to bearish signaling that sideways to lower prices are possible near-term. If September extends this month's decline, May's low crossing at 3.5650 is the next downside target. Closes below the 20-day moving average crossing at 3.8366 would signal that a short-term low has been posted. First resistance is the 20-day moving average crossing at 3.8366. Second resistance is the August 4th high crossing at 3.9280. First support is the June 29th low crossing at 3.6830. Second support is May's low crossing at 3.5650.
GRAINS http://quotes.ino.com/ex changes/?c=grains
Grains: December corn was lower overnight as it extends the decline off July's high. Overnight trading sets the stage for a lower opening when the day sessions begins trading. Stochastics and the RSI are oversold but remain bearish signaling that sideways to lower prices are possible near-term. If December extends the decline off July's high, the 62% retracement level of the 2020-2022 rally crossing at $4.50 3/4 is the next downside target. Closes above the 20-day moving average crossing at $5.17 1/4 would signal that a short-term low has been posted. First resistance is the 20-day moving average crossing at $5.17 1/4. Second resistance is the 50-day moving average crossing at $5.30. First support is July's low crossing at $4.81. Second support is the 62% retracement level of the 2020-2022 rally crossing at $4.50 3/4.
September wheat was lower overnight as it extends the decline off July's high. Overnight trading sets the stage for a lower opening when the day session begins trading. Stochastics and the RSI are oversold but remain neutral to bearish signaling that sideways to lower prices are possible near-term. If September extends the decline off July's high, May's low crossing at $5.87 3/4 is the next downside target. Closes above the 20-day moving average crossing at $6.73 would signal that a short-term low has been posted. First resistance is the 50-day moving average crossing at $6.70 1/2. Second resistance is the 20-day moving average crossing at $6.73. First support is Monday's low crossing at $6.05 1/4. Second support is May's low crossing at $5.87 3/4.
September Kansas City wheat was steady to fractionally higher overnight. Overnight trading sets the stage for a steady to fractionally higher opening when the day session begins trading later this morning. Stochastics and the RSI are oversold but remain neutral to bearish signaling that sideways to lower prices are possible near-term. If September extends the decline off July's high, the December-2021 low crossing at $7.29 1/2 is the next downside target. Closes above last-Wednesday's high crossing at $7.79 1/2 would signal that a short-term low has been posted. First resistance is last-Wednesday's high crossing at $7.79 1/4. Second resistance is the 50-day moving average crossing at $8.17 1/4. First support is Monday's low crossing at $7.32 3/4. Second support is the December-2021 low crossing at $7.29 1/2.
September Minneapolis wheat was slightly lower overnight as it extends the decline off July's low. Overnight trading sets the stage for a slightly lower opening when the day session begins trading. Stochastics and the RSI are oversold but remain neutral to bearish signaling that sideways to lower prices are possible near-term. If September extends the decline off July's high, the June 7th low crossing at $7.92 3/4 is the next downside target. Closes above the 20-day moving average crossing at $8.59 would signal that a low has been posted. First resistance is the 10-day moving average crossing at $8.22. Second resistance is the 50-day moving average crossing at $8.49 1/2. First support is the June 7th low crossing at $7.92 3/4. Second support is the May 31st low crossing at $7.78 1/4.
SOYBEAN COMPLEX? http://quotes.ino.com/ex?changes/?c=grains "
November soybeans was lower overnight as it consolidates some of the rally off last-Tuesday's low. Overnight trading sets the stage for a lower opening when the day session begins trading later this morning. Stochastics and the RSI are turning neutral to bullish signaling that sideways to higher prices are possible near-term. Closes above the 20-day moving average crossing at $13.55 would signal that a low has been posted. If November renews the decline off July's high, the 62% retracement level of the May-July rally crossing at $12.46 3/4 is the next downside target. First resistance is the 20-day moving average crossing at $13.55. Second resistance is the July 31st gap crossing at $13.79. First support is the 50% retracement level of the May-July rally crossing at $12.82 3/4. Second support is the June 28th low crossing at $12.56 3/4.
December soybean meal was lower overnight as it extends the trading range of the past three-weeks. Overnight trading sets the stage for a lower opening when the day session begins trading. Stochastics and the RSI are oversold but remain neutral to bearish signaling that sideways to lower prices are possible near-term. If December renews the decline off July's high, the July 7th low crossing at $384.70 is the next downside target. Closes above the July 28th gap crossing at $392.40 would temper the bearish outlook. First resistance is the July 28th gap crossing at $392.40. Second resistance is July's high crossing at $424.70. First support is the July 7th low crossing at $384.70. Second support is the June 29th low crossing at $374.60.
December soybean oil was higher in overnight trading as it extends the trading range of the past three-weeks. Overnight trading sets the stage for a higher opening when the day session begins trading. Stochastics and the RSI are bullish signaling that sideways to higher prices are possible near-term. Closes above the 20-day moving average crossing at 61.49 would temper the bearish outlook. Closes below the August 8th low crossing at 57.86 would renew the decline off July's high. First resistance is the 75% retracement level of the 2022-2023 decline crossing at 65.45. Second resistance is the 87% retracement level of the 2022-2023 decline crossing at 68.81. First support is the August 8th low crossing at 57.86. Second support is the June 29th low crossing at 54.67.
Thanks, tallpine!
This was the last comment, which was less than an hour ago:
By metmike - Aug. 15, 2023, 7:15 a.m.
https://www.marketforum.com/forum/topic/98257/#98276
Not surprising, we opened down almost -10c yesterday evening, then after midnight, when the last model update came out without much rain, we spiked to +8c higher and tested the USDA spike higher on Friday(which filled a gap lower from Aug 6(Sunday NIght) from all the rains that fell last week.
Now, we're back to -6c.
A battle between the hot/dry bullish forecast the next 2 weeks and the incredible +5 G/E rating for the S crop.
Honestly, I have no idea what the funds will do when we open later this morning.
They could press either side and we make new highs or new lows for the week and leave me easily explaining why they did it.
1. The +5 G/E is going to be rear view window trading stuff at some point.
2. The impressive hot/dry might be with us the rest of the month
3. Current soil moisture has been restored in many places which will make hot/dry less damaging at this late stage.
+++++++++++++++++++++
Everything else is about the same:
Record improvement in the S crop vs Hot/dry the rest of August(late in the season). Could be a crazy day session coming up.
The market has chosen the downside today because of the +5 condition rating, in addition, Crude is -$2 which is likely adding pressure.
-16c at the moment for beans
Corn is making new lows for the week and the move but beans are still holding the lows for this week and well above the recent low. They have the more positive technical picture, even with the sharp losses today.
That's my positive spin on what still looks pretty bad.
If the weather forecast this bullish(but late) can't inspire speculative buying today, exactly at what point will it?
Answer:
1. I don't know when that point will be well enough to use it to pick the right, low risk spot to buy
2. It can't
3. Picking a point of strong support would be the "take a chance" option..........but then, it might be more gambling based on "wanting" to be long
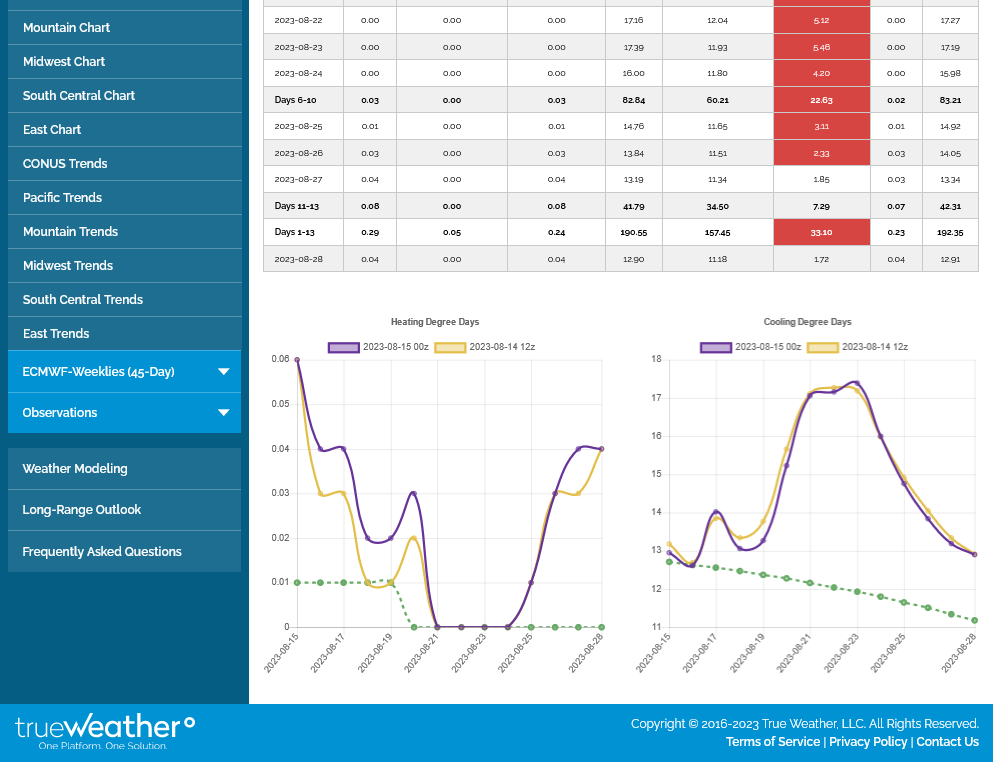
Strongly agree with this assessment. The models all took out heat overnight. The GEFS by a whopping -7 CDDs but the EE a more modest -1.5 CDDS. All models show the magnitude of the heat spike higher next week to be very transient. During week 2, it's still hot in some places but LESS and LESS hot.
The last EE below in the purple. Right side it CDDs.
S down -22c.
Unless they get rescued with a last might spike up, this will make the technical picture look pretty bad.
++++++++++
We barely closed above Sunday nights spike lows and are still well above reversal lows from 1 week ago, which were 1282.
Corn is well below all that now and much weaker than beans.
Comprehensive Crop condition analysis here:
https://www.marketforum.com/forum/topic/98218/
+++++++++++++++++++
1. Beans barely holding on, with still an outside chance of it being a bull flag after the Aug. 8 reversal up that had some follow thru last week.
https://futures.tradingcharts.com/chart/ZS/
%20Daily%20Commodity%20Futures%20Price%20Chart%20CBOT.png)
2. Corn is technical toast. Well below the lows of the year now. Amazing how the charts look so different between C and S right now. Previous low was just above 4.81 and we closed around 4.74.
https://futures.tradingcharts.com/chart/ZC/
%20Daily%20Commodity%20Futures%20Price%20Chart%20CBOT.png)
Cotton put in an ugly day after the -5% condition report on Monday. Crude down sharply today put on additional pressure. But its still barely holding on to a potential bullish story but can drop much more than this before its more decidely negative. Last Friday's spike above 80c and close just below that looks like a double top with the late July high.
What do you think, tjc?
https://futures.tradingcharts.com/chart/CT/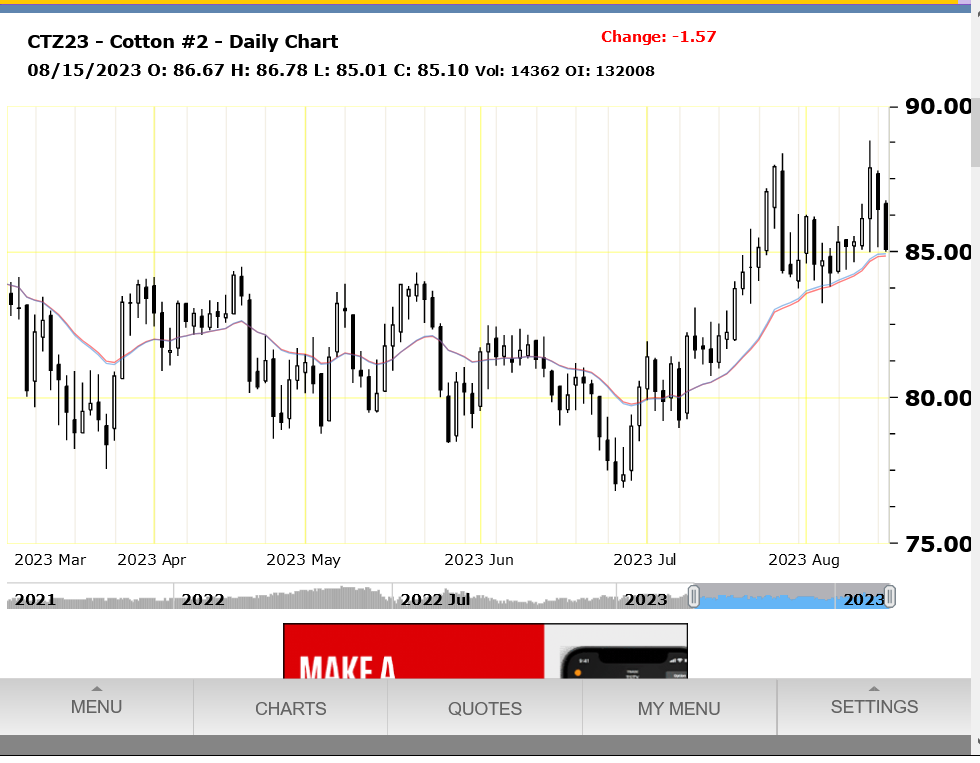
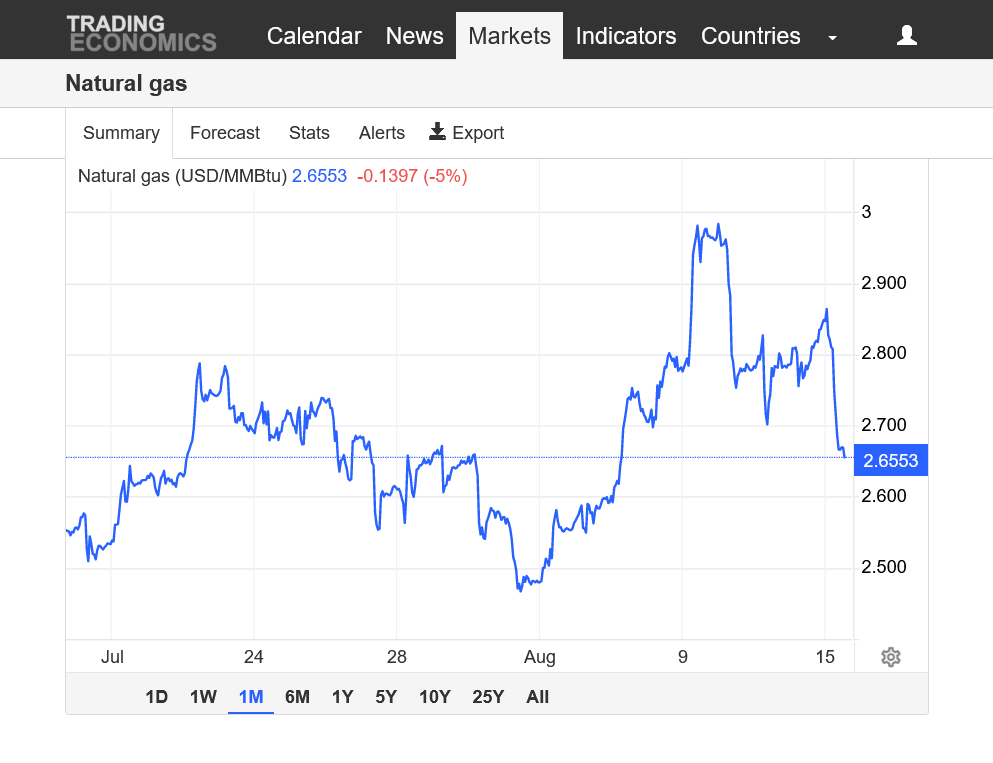
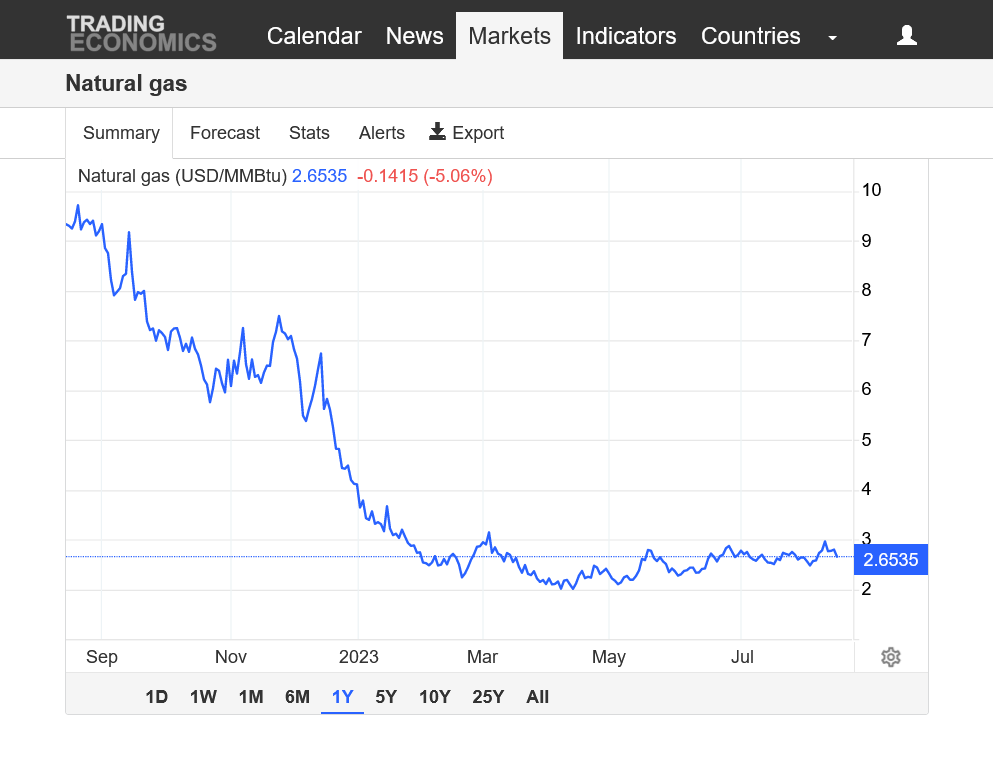
Major top last week.
https://tradingeconomics.com/commodity/natural-gas
1. 1 month
2. 1 year
3. 30+ years
Questions:
1. When was the last time that beans and corn had double digit losses during the growing season with a forecast like this below(though it's LATE in the growing season right now and TOO late to hurt the crop much)?
Answer: NEVER in my memory trading over 3 decades
2. When was the last time that the S crop condition went +5 G/E in key pod filling month, August?
Answer: NEVER and that's the entire reason for #1.
The market is confident that the crop is made here on August 15th!. I think that these next 2 weeks of weather will take a couple of bushels off where were are at this moment, HOWEVER, +5 in the crop condition yesterday added MORE THAN that.
7 Day Total precipitation below:
http://www.wpc.ncep.noaa.govcdx /qpf/p168i.gif?1530796126

Extended weather.
https://www.cpc.ncep.noaa.gov/products/predictions/610day/ | |||||||||
| 6 to 10 day outlooks | |||||||||
| Click below for information about how to read 6-10 day outlook maps Temperature Precipitation | |||||||||
| Click below for archives of past outlooks (data & graphics), historical analogs to todays forecast, and other formats of the 6-10 day outlooks ArchivesAnalogsLines-Only FormatGIS Data | |||||||||
Temperature Probability | |||||||||
Precipitation Probability | |||||||||
Week 2 extreme weather risks from the best weather service on the planet, our NWS:
https://www.cpc.ncep.noaa.gov/products/predictions/threats/threats.php

All the comprehensive weather here:
https://www.marketforum.com/forum/topic/83844/

